http://www.sciencepublishinggroup.com/j/ijdsa doi: 10.11648/j.ijdsa.20190506.12
ISSN: 2575-1883 (Print); ISSN: 2575-1891 (Online)
The Modeling of a Stochastic SIR Model for HIV/AIDS
Epidemic Using Gillespie's Algorithm
Kavyu Mary Kamina
*, Samuel Mwalili, Anthony Wanjoya
Department of Statistics and Actuarial Sciences, Jomo Kenyatta University of Agriculture and Technology, Nairobi, Kenya
Email address:
*Corresponding author
To cite this article:
Kavyu Mary Kamina, Samuel Mwalili, Anthony Wanjoya. The Modeling of a Stochastic SIR Model for HIV/AIDS Epidemic Using Gillespie's Algorithm. International Journal of Data Science and Analysis. Vol. 5, No. 6, 2019, pp. 117-122.
doi: 10.11648/j.ijdsa.20190506.12
Received: October 8, 2019; Accepted: October 28, 2019; Published: November 4, 2019
Abstract:
Mathematical modeling of disease has been an indispensable tool in accounting for disease transmission dynamics as well as disease spread. Epidemiological disease models have been used to explain the dynamics of HIV/AIDS in the population from the early 1900s. The models developed however faced considerable challenges ranging from inaccurate representation of natural data for deterministic models, to methods of forecasting such as statistical extrapolation which assumes that current conditions will prevail which is not always the case. Despite the spread of HIV/AIDS having been explored widely, not much literature is available on the Gillespie Algorithm based SIR model. This algorithm is able to give a statistically correct of the course of a disease with initial conditions to begin with and propensity functions to update the system. The purpose of this paper is to build on the concept of Gillespie's Algorithm based SIR models by developing a stochastic SIR model to simulate disease evolution in the population setting. The values produced through simulation by the model developed in this paper using a tau value as the time step of the model were compared to HIV/AIDS data from 1985 to 2018, given by NACC. We conclude that the simulated model reflects reality.Keywords:
Stochastic, Simulation, Deterministic, SIR Model, Continuous-Time Markov Chain, Gillespie's Algorithm Models1. Introduction
On June 5, 1981 a mysterious disease was recognized among MSM in the USA. In 1982 the CDC identified the same disease among IVDU, hemophiliacs and Haitian residents. In the same year, it was identified that it attacks the immune system of the host, incapacitating them to heal subsequently leading to death. It was characterized by its etiological agent HIV in 1983, [1]. These researchers from France, Francoise Barre-Sinoussi and Jean-Claude Chermann together with Luc Montagnier, speculate that this virus could be what latter develops to AIDS. A serological test, was then made available. In 1984, Robert Gallo discovered that HIV was responsible for AIDS.
This virus, being highly transmittable is analyzed and capturing how it is transmitted is crucial in attempting to model the disease. There are several channels in which the
total. Sex workers have the highest percentage of HIV prevalence at 29.3% according to the Kenya HIV estimates report- National Aids Control Council.
2. Literature Review
Mathematical modeling of HIV is the use of statistical tools and procedures to recognize the general pattern in the transmission of HIV and to translate a problem into a statistical form for subsequent analysis. There are various questions still left unanswered to date on the HIV epidemic. These questions are encompassed in the modeling of the HIV immunology, the HIV dynamics as well as the AIDS dynamics such as the dynamic distribution of the disease in the population and its likely magnitude. This study employs mathematical modeling tools in the transmission probability of HIV and analyses done on how the cumulative number of infected individuals responds as well as the AIDS death probability and how the cumulative cases of removed individuals responds to this probability.
The following reviews consider models developed for HIV/AIDS data that either differed too greatly with other model estimates or still fail even with developments on the model. In 2010 several authors came up with a model to predict HIV transmission in China in 2002 [3]. They applied these dynamic models to forecast the transmission of HIV for the Chinese population. In this model, there were no forms of intervention. The average number of partners was different at different ages in the HIV to AIDS cycle. The transmission parameter was held constant for all stages of HIV. The formulated model was used to forecast the number of PLWHA. This model approximated that there would be 6000000 cases of HIV and 400000 cases of AIDS in China if there were no forms of interventions implemented. In 2007 the government of China alongside UNAIDS made an estimate of 700000 cases of HIV and 85000 cases of AIDS in China at the time, which is much lower that the estimates made by Liu [4]. The number of HIV infections in 2010 was predicted to approximately 1000000. The group most affected would be the 31-40 years group. The group comprising of the largest individuals predicted to be living with HIV/AIDS was approximately 650000.
There is need now more than ever to develop the SIR model since its application is going beyond epidemiological application such as how cues influence behaviour in a social setting and the spread of ideas [5].
There are several challenges facing models used for HIV estimates developed by UNIADS. In several concentrated epidemics, HIV prevalence estimates do not match reported cases and mortality estimates do not match reported deaths, even after adjusting. There are issues estimating prevalence in high risk groups and the size of high risk groups. Furthermore, it provides inaccurate estimates where an epidemic has not gone beyond its peak [6]. Even with the 2013 updates of Spectrum where adjustments were made in the parameter values empirically to improve the fit to program data, the estimates given by Spectrum still differed
with data available. More adjustments are needed as they desire to make the process where Spectrum selects the incidence curve for the data an automatic process [7].
A stochastic differential equation SI model with demographic stochasticity has already been developed [8]. They considered and analyzed a two stage SI model that allowed for random variation in the demographic structure of the population with the population size changing at different times which had an exponentially distributed rate of infection. The parameter depended on the varying population size N. This meant that both the population size varied as well as the transmission/contact rate. They used the Milstein method to simulate for analysis.
Despite the fact that a lot of research has been done on modeling disease trajectory, not much literature is available on the use of Gillespie based SIR models to simulate the trajectory of a disease in the population. The Gillespie's algorithm based SIR model concept considered the Gillespie algorithm, Euler alongside other CME based exact methods which showed that Gillespie's algorithm had the least execution time [9]. This makes it a prime candidate for the tau step vantage point. Events are selected stochastically in the tau time step such that in the least possible computed time step, one or several events are selected to occur randomly.
Other authors have made contributions to mathematical epidemiology by performing simulations that explain the process of disease spread. In their works they build a disease spread prediction model based on the SIR model and applied parameter values to a stochastic model based on Gillespie's algorithm. This is applied to data and the conclusion was that the model well explains the process of the spread of the disease in the population [10].
3. Rationale of the Study
Mathematical models generated as deterministic have been used in the past and they offer a lot to be studied and concluded from statistically. According to Koopman, deterministic differential equation models cannot capture the real-life representation because no matter how finely they divide populations into geographic and social space, the infectious population is spread out to cover the entire space. The inability of differential equation models to capture stochastic effects therefore has been demonstrated by studies done by Koopman [11].
In spite having a lot of work done on mathematical modeling, there isn't adequate literature on the modeling the evolution of disease in the population through simulation. Several execution options have been suggested for the SIR model such as Gillespie's algorithm and agent-based models but they have not been extensively explored in literature. This paper will contribute and build on to the existing literature on modeling disease dynamics in the population with the model tested on HIV/AIDS data 1985-2018 to investigate if the simulated values would reflect results that are close to reality.
This paper will help bridge the gap between conceptual epidemiological models and its simulated version by providing a developed version of an SIR model that solves one inherent problem that deterministic models do not reflect the natural data.
In some instances, these deterministic models do not capture some model characteristics and this could lead to biases.
4. Methodology
4.1. The Stochastic SIR Model
The Classic SIR model
The Kermack-McKendrick theory illustrates individuals grouped as susceptible and removeds only [13]. The transmission and infection rates were considered to be variant. The initial conditions changed over time and demographics not being included such that change over time was described as;
(1)
(2)
(3)
The Kermack-McKendrick theory was later developed to a version where they tackled the problem of endemics [14], [15]. They set the transmission and infection rates as invariant for all ages and this allowed the inclusion of an infectives class. This transformed the theory to the basic SIR model such that when demographics were included becomes
(4)
(5)
(6)
where
N denotes the total host population. denotes the birth rate and death rate denotes the infection rate
denotes the recovery rate t denotes time point Model development
The Gillespie algorithm was used to simulate a statistically correct trajectory given initial SIR conditions. The model explored how altering transmission dynamics affected the model as a whole. The death rates were distinguished such that one death event led an individual out of the model while the other death event led an individual into a different classes. The SIR model explained how the epidemic manifests in all the compartments. The reliability of the simulated values would set the precedent for the valued to be predicted based on the model is also explored. All these aspects determine the quality of the inference drawn. The graphical representation of the developed stochastic model is shown;
Figure 1. The stochastic SIR model.
(7)
(8)
(9)
denotes the rate of birth
denotes the rate of non-AIDS death denotes the rate of infection denotes AIDS death rate denotes model's time step Gillespie's procedure
The Gillespie simulation procedure was developed to produce a statistically correct course for finite well-mixed populations [16, 17]. The assumption is that the population is finite and is sub-divided into categories of finite discrete compartments. The interaction between states is made possible by events outlined in this model as birth, infection, non-AIDS death an AIDS death. The compartments consist of initial state values S(t0), I(t0) and R(t0) are contained in a
vector and described at initial time t0.
, , (10)
This Gillespie's algorithm based stochastic SIR model generates a statistically correct trajectory from the initial vector as
, , (11)
where i=s, i, r
S+I+R=N
denotes a function characterized by two quantities as a state change vector and a propensity function.
, the state change vector defined as
, , (12)
where is the change in state i caused by one event. Assuming that the resulting state is . A propensity function is the probability of one event occurring in the time interval ! , ".
Continuous-time Markov chains are the basic tool for building discrete population epidemic models. The Markov property lets us specify a model by giving the transition probabilities-defined as rates-on a small interval between the compartments. Considering the fact that the propensity functions require to be in probability form, we explore this assumption further by defining and interpreting it.
A Markov chain model is one where the probability of the next event depends on the probability of the present state. This implies the probabilities are individual therefore discrete. Discrete evolution is modelled in discrete time. A Markov chain is interpreted here then, as a stochastic discrete-valued model with the Markov property that future states of a process depend on the current state. Continuous-time Markov chains are the basic tool for building discrete population epidemic models. The Markov property lets us specify a model by giving the transition probabilities-defined as rates-on a small interval between the compartments. The transition probabilities assigned are defined on an open interval (t, t + ), such that the probability an individual moves from the susceptible compartment to the infectives compartment is [ 1 ]. The SIR Markov chain model transition probabilities for a closed population are;
$! 1 " % (13)
$! " 1 % (14)
$! 1 " % (15)
$! " 1 % (16)
where
denotes the rate of flow of individuals from susceptibles to infectives
denotes the rate of flow of individuals from infectives to removeds.
The wait times between events can either assume an exponentially distributed wait time or the rate of flow between compartments can assume any of the following distributions depending on the results.
4.1.1. Exponential Increments Between &'( Events
The wait times between one event and the next can assume an exponential distribution
∆ ~+,- (17)
4.1.2. Poisson Increments in &'( Events
The counting process for the flows in the compartments
has a Poisson model with evolution in time
∆ ~$%.//%0 (18)
4.1.3. Binomial Increments with Linear Probability in &'(
Events
The counting process for the flows in the compartments has a binomial model with linear probability in the evolution of time.
∆ ~ 1.0%2. 3 (19)
4.1.4. Binomial Increments with Exponential Decaying Probability in &'( Events
The counting process for the flows in the compartments has a binomial model with exponentially decaying probability in the evolution of time.
∆ ~ 1.0%2. 3 , 1 +,- (20)
4.2. Goodness-of-fit of the Stochastic Model to HIV/AIDS Cases
In order to assess how the simulated data performs against natural data, a modified chi-square test was used. The data was obtained from NACC for HIV/AIDS cases. The means and variances of the simulated and natural data were computed. Considering the hypotheses,
4 = If the mean and variance of the simulated and natural data are equal, the simulated mean does not fit the data.
45 = If the mean and variance of the simulated and natural data are not equal, the simulated data fits the natural data.
A modified chi-square test for simulation models was used to see how well the simulated data fit the natural data [18].
5. Results and Discussion
5.1. The Simulated Stochastic SIR Model
Figure 2. Simulated HIV/AIDS cases alongside natural data HIV/AIDS cases.
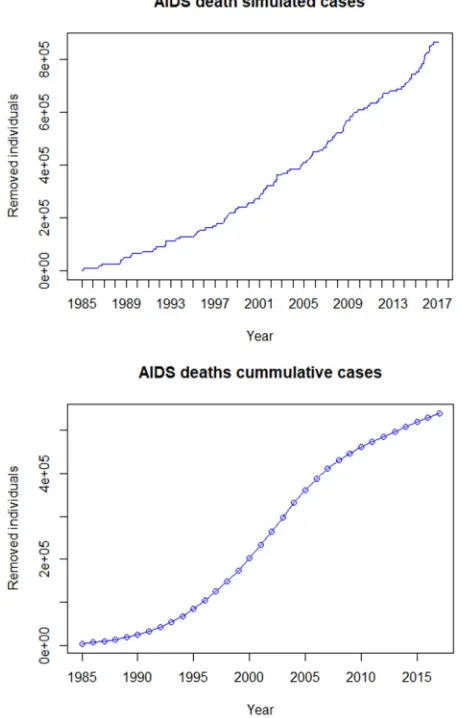
Figure 3. Simulated AIDS death cases alongside natural data AIDS death cases.
5.2. Goodness-of-fit for the Stochastic Model
In order to have confidence in the predicted value, we apply a test to check the simulated values against the natural data values by employing hypotheses.
Table 1. Means and variances of simulated and natural data.
Data type Mean Variance
Natural data infecteds 388766.7 2726320.2
Simulated data infecteds 789411.8 9501142
Natural data removeds 251260.4 3734534.4
Simulated data removeds 460882.4 4766099
An upper tailed test was done-since chi-square test is an asymmetrical distribution-at 33 degrees of freedom and
6 0.05. The results produced show non-equal means and variances. This prompted the use of a modified chi-square test [3]. To begin with, the Pearson's goodness-of-fit test is
:; ∑ = ,> ;
> ?
@A (21)
where
Oi- the observed values
Ei- the expected values
In this study, the means and variances found were non equal. Waller proposed a generalized :; as
B; ∑ = ,> ; > ?
@A (22)
where
C represents the variance of D
The calculated value found was 64.958. The critical value was 47.4. Since the calculated value is greater than the critical value, the decision rule is to reject the null hypothesis. Therefore, the conclusion is that the simulated data model fits the natural data model.
6. Conclusion and Recommendation
Mathematical modeling of disease trajectory using Gillespie based algorithms is yet to be explored extensively in literature. In this study, a simulation was carried out on the SIR model to explain the trajectory of the disease by employing a stochastic element using Gillespie’s simulation algorithm. After simulating, values were produced by the algorithm for each time step. The simulated curves were compared to HIV/AIDS data. The simulated curves were found to resemble the data available in reality. Therefore, the implementation of a stochastic factor to an epidemiological model is a useful contribution to mathematical modeling.
Mathematical modeling is an area that requires more research. Recommendation for research would be to explore other variations of the SIR model such as SI, SEIR under Gillespie's algorithm.
Furthermore, making parameter values time-varying under the Gillespie algorithm and comparing it with the version where parameters are invariant to see which performs better is another recommendation.
References
[1] F. C. J.-C. R. F. N. M. T. C. S. G. J. D. C. A.-B. C. V.-B. F. R. C. o. Barré-Sinoussi, "Isolation of a T-lymphotropic retrovirus from a patient at risk for acquired immune deficiency syndrome (AIDS)," Science, vol. 220, no. 4599, pp. 868-871, 1983.
[2] W. A. M. S. R. T. D. O. T. R. S. J. V. N. L. P. N. B. J. F. K. D. P. W. S. M. o. Paxton, "Relative resistance to HIV--1 infection of CD4 lymphocytes from persons who remain uninfected despite multiple high--risk sexual exposures," Nature medicine, vol. 2, no. 4, p. 412, 1996.
[3] W. A. N. G. R. K. H. J. L. U. O. C.-p. Z. N. W. A. N. G. Jun-jie, "Dynamic mathematical models of HIV/AIDS transmission in China," Chinese medical journal, vol. 123, no. 15, p. 2120, 2010.
[4] A. I. D. S. Council, "Working Committee Office UN Theme Group on AIDS in China," A joint assessment of HIV/AIDS prevention, treatment and care in China. Beijing: Ministry of Health, China, 2007.
[5] H. S. Rodrigues, "Application of SIR epidemiological model: new trends," arXiv preprint arXiv: 1611.02565, 2016. [6] L. S. J. A. B. T. R. A. E. a. H. D. R. Bao, "Modelling national
HIV/AIDS epidemics: revised approach in the UNAIDS Estimation and Projection Package 2011," BMJ Publishing Group Limited, no. 88, pp. 3-18, 2012.
[7] J. A. K. S. E. G. C. S. K. V. Stover, "Updates to the spectrum model to estimate key hiv indicators," wolter Kluwer Health,
vol. 28, no. 4, 2014.
[8] D. L. Y. a. M. X. Greenhalgh, "Sde sis epidemic model with demographic stochasticity and varying population size.,"
Applied Mathematics and Computation,, vol. 276, p. 218–238, 2016.
[9] A. M. N. DURAD MUHAMMAD HANIF, "Analysis Of Sir Epidemic Models," VFAST Transactions on Software Engineering, vol. 6, no. 1, pp. 1-6, 2015.
[10] S. a. C. B. Ryu, "Development of epidemic model using the stochastic method," Journal of the Korean Data and Information Science Society, vol. 26, no. 2, pp. 301-312, 2015.
[11] J. S. C. S. E. S. C. P. R. C. S. J. G. Koopman, "Stochastic effects on endemic infection levels of disseminating versus local contacts," Mathematical biosciences, vol. 180, no. 1-2, pp. 49-71, 2002.
[12] R. P. Dobrow, "Introduction to stochastic processes with R," 2016.
[13] W. O. M. A. G. Kermack, "A contribution to the mathematical theory of epidemics," Proceedings of the royal society of london. Series A, Containing papers of a mathematical and physical character, vol. 115, no. 772, pp. 700-721, 1927. [14] W. O. M. A. G. Kermack, "Contributions to the mathematical
theory of epidemics. II.—The problem of endemicity,"
Proceedings of the Royal Society of London. Series A, containing papers of a mathematical and physical character,
vol. 138, no. 834, pp. 55-83, 1932.
[15] W. O. M. A. G. Kermack, "Contributions to the mathematical theory of epidemics. III.—Further studies of the problem of endemicity," Proceedings of the Royal Society of London. Series A, Containing Papers of a Mathematical and Physical Character, vol. 141, no. 843, pp. 94-122, 1933.
[16] D. T. Gillespie, "A general method for numerically simulating the stochastic time evolution of coupled chemical reactions,"
Journal of computational physics, vol. 22, no. 4, pp. 403-434, 1976.
[17] D. T. Gillespie, "Exact stochastic simulation of coupled chemical reactions," The journal of physical chemistry, vol. 81, no. 25, pp. 2340-2361, 1977.
[18] L. A. S. D. C. J. E. R. L. A. Waller, "Monte Carlo assessments of goodness-of-fit for ecological simulation models,"
Ecological Modelling, vol. 164, no. 1, pp. 49-63, 2003. [19] G. H. K. R. S. Friedland, "Transmission of the human
immunodeficiency virus," New England Journal of Medicine,
vol. 317, no. 18, pp. 1125-1135, 1987.
[20] V. Isham, "Mathematical modelling of the transmission dynamics of HIV infection and AIDS: a review," Journal of the Royal Statistical Society: Series A (Statistics in Society),
vol. 151, no. 1, pp. 5-30, 1988.
[21] R. G. M. H. Brookmeyer, "A method for obtaining short-term projections and lower bounds on the size of the AIDS epidemic," Journal of the American Statistical Association,