Ellipsometric light scattering to probe the interface of colloids - current
applications and future challenges
Andreas Erbe1,aand Reinhard Sigel2
1 Max-Planck-Institut f¨ur Eisenforschung GmbH, Max-Planck-Str. 1, 40237 D¨usseldorf, Germany
2 University Fribourg, Adolphe Merkle Institute, Chemin du Mus´ee 3, Perolles, CH-1700 Fribourg, Switzerland
Abstract. In recent years, ellipsometric light scattering (ELS) has been developed into a technique which can be used to characterise the interface between spherical colloidal particles and their surrounding medium. Here, we give an overview over previous successful applications of the technique, and its current limits. The success-ful applications include the characterisation of temperature-dependent swelling of a thermo-sensitive polymer coating on a latex particle, the measurement of birefringence and molecular orientation in a vescile shell, and the characterisation of the ion distribution around electrostatically stabilised latex particles. As a result of the characterisation of the ion distribution, disagreement with the Poisson-Boltzmann description has been reported before. Here, a few more experimental results on latex particles in the presence of CsBr are discussed.
1 Introduction
The colloid science has seen many applications over cen-turies. From the medieval colouring of windows to mod-ern paints and adhesives there are many applications that rely on matter on the length scale below 1μm. Further-more, in nature there are colloids determining the colour of species and structures on the colloidal length scale fa-cilitating mass transport on the intracellular level.
Every time structures containing colloids are assem-bled, the control over their stability is of crucial impor-tance. Van der Waals attractions, which promote particle aggregation and phase separation from the liquid phase have to be outranged by other, repulsive interactions. Such a stabilization is decided on the interface between the par-ticles and their surrounding medium. Despite its impor-tance, not a lot is know about the structure of these in-terfaces in solution. Available techniques include routine measurements of electrophoretic mobilities, wide-spread small-angle X-ray and neutron scattering. The structure can be probed by the recently developed and interface sen-sitive visible-ir sum frequency generation [1–3]. In recent years, we have established ellipsometric light scattering (ELS) as a technique to probe thickness, refractive index, and anisotropy of colloidal interfaces [4–8]. Here, we give an overview of the technique, highlight previous applica-tions from our lab, and show current limits, which can be overcome only with more method development.
2 Experimental Setup
The full details of the setup are presented elsewhere [5]. Briefly, based on a commercial setup (ALV GmbH,
Ger-a e-mail:
[email protected],[email protected]
many) for concurrent static ligth scattering (SLS) and dy-namic light scattering (DLS), two lasers can be chosen to be focused on a sample through a polarisation state gen-erator, and analysed through a polarisation state analyser, before being detected either by a photomultiplier or an avalanche photodiode. The range of scattering anglesθis 12◦to 150◦.
The polarisation state generator was a combination of a linear polariser, followed by a compensator plate giv-ing λ/4 retardation at λ = 633 nm −λ/4 retardation at
λ = 532 nm, where λis the light wavelength. The polar-isation state analyser was a compensator of the same type, followed by a polariser.
A drawback of the first experimental implementation is the long duration of a measurement, which takes typically one night instrument time per wavelength for the required angular range. The involved commercial instrument is op-timized for DLS, i.e. the detection of stochastic intensity fluctuations in the scattering signal, caused by the diffusion of the scattering particles. Thus, sufficient time averaging is required in ELS measurements in order to determine the average scattering intensity with sufficient accuracy. For faster measurements in a second experiment, the point de-tection of the optical fiber was replaced by a two dimen-sional detection with a CCD camera [9]. A whole range of scattering angles is recorded simultaneously. Futher, diff er-ent pixels of the camera related to the same scattering an-gle represent different degrees of rotation of the scattering plane (defined by the directions of incident and scattered light) towards the fixed polarization coordinates of the in-cident beam. Therefore, each picture contains several po-larization settings. The larger area of the CCD chip collects more light, thus increasing the sensitivity. With all these improvements, a set of ELS measurements at 7 λbased on two lasers and a mercury lamp was collected within 5 '2,HSMFRQI
2ZQHGE\WKHDXWKRUVSXEOLVKHGE\('36FLHQFHV
hours total measurement time [9]. Details of the optimized apparatus and the measurements at 7λwill be the subject of a separate publication.
3 Polarisation analysis
With polariser and compensator before and compensator and analyser after the sample, a synthesis and analysis of any arbitrary state of polarisation is possible, hence all el-ements of the Mueller matrix can be measured simply by intensity measurements. Experimentally, we are interested in the determination of the Mueller matrix elements of the scattering samples. So far, we have focused on spherical particles, which simplifies the Mueller matrix. For a sin-gle spherical particle, all nonvanishing Mueller matrix el-ements can be written in terms of the two nonvanishing amplitude scattering coefficientsS1andS2[10]. Their re-lation to the Mueller matrix elementsMlmis given as [10]
M11= 1 2
|S2|2+|S1|2
(1)
M12= 1 2
|S2|2− |S1|2
M33= 1 2
S∗2S1+S2S∗1
M43= i 2
S2∗S1−S2S∗1
.
Furthermore,M22 =M11,M44 =M33,M21 =M12,M34 = −M43, and all otherMlm=0.
The amplitude scattering coefficientsS1andS2are the diagonal elements of the Jones matrix of a spherical parti-cle,
EH EV
(f)
=exp [ik(d− −z)]
ikd
S2 0
0 S1
EH EV
(i)
, (2)
whereEH
EV
defines a polarisation with basis states parallel (EH) and perpendicular (EV) to the scattering plane (for a horizontally orientated scattering plane these basis polar-izations are horizontal and vertical). The index f denotes the final (scattered) state, whileiis used to designate the initial (incident) state. The wave vector of the incoming light isk,zis the position of the scatterer along the beam anddis the distance between scatterer and detector.
For polydisperse samples, and for illumination with anything other than a plane wave, the situation becomes more involved. In these cases, one needs to consider the ex-act composition of the scattering matrix, or the respective Mueller matrix. In turn, a proper way of parallel decompo-sition would be needed to retrieve details about the poly-dispersity [11]. How the different species contribute to the overall signal, i.e. how exactly the averaging is performed is a function of the measurement scheme, as discussed pre-viously [4].
Different measurement schemes of the Mueller matrix elements based on intensity measurements with different polarisations have been described and realised [10]. Such
intensity-based schemes fall into the simplest type of po-larimetric experiments, and have their limits in accuracy, especially if low intensities need to be measured. In ELS, instead of focusing on the measurement of all matrix el-ements over a large angular range, we exploit symmetry considerations to measure few meaningful parameters with high accuracy and high angular resolution in an angular range with contains the information about the interface of particles.
The details of the ellipsometric measurement scheme employed here have been described elsewhere [4, 5]. In a nutshell, the intensityI is measured at different polariser Pand analyserAangles at a fixed compensator angle, and subjected to a fitting procedure of the equation
I(P,A)=Id+
|S1|2 +
|S2|2 +Is
1+cos2(θ) −cos(2A +2δA)
|S1|2 −
|S2|2 +Is
1−cos2(θ)
+sin(2A +2δA) |S1|2 −
|S2|2 tan(2ΨQ) sin(2P−Δ)
+sin(2A+2δA)2Is|cos(θ)|sin(2P), (3)
whereδAis (formally) the adjustment error in the analyser, Id the detector dark signal, and Is the solvent’s scattering intensity detected with vertical polarisation. This proce-dure is not optimized for speed but for accuracy. It cor-responds to the two-zone-averaging of classical reflection ellipsometry, where most imperfections of the optical com-ponents cancel out in first order [12]. From the fitting re-sults, the experimental quantities tan(ΨQ), with
tan(2ΨQ)=
2S∗1S2
|
S1|2−|S2|2
, (4)
tan(ΨI)=
|
S2|2
|
S1|2
, and (5)
Δ=argS∗1S2
(6)
are extracted [4, 5]. The angular brakets denote averaging over particles with different sizes in a polydisperse mix-ture, over particles at different positions a beam deviating from a plane wave, and over different wavelengths if quasi-monochromatic light is used. The two different quantities tan(ΨQ) and tan(ΨI), are two versions of the ellipsomet-ric amplitude ratio tan(Ψ), which contain the same scat-tering matrix elements, i.e. the same Mueller matrix ele-ments. For monodisperse samples under illumination with a monochromatic plane wave, tan(ΨQ) = tan(ΨI). While the intensity-based quantity tan(ΨI), which can also be de-rived from polarised static light scattering as the simplest possible intensity-based polarimetric experiment, contains coherent and incoherent scattering contributions, the quan-tity tan(ΨQ) filters the coherent scattering contributions on-ly [4, 5].
series of products of the Mie coefficientsalandbland Leg-endre polynomials. The number ofalandblwhich need to be included in the series is a function of the size of parti-cles, and increases with increasing size [10].
4 Examples
The reason for the adoption of the measurement scheme becomes clear when considering a point scattering centre and the analogy between light scattering from a spherical particle and reflection from a planar interface [6]. In re-flection ellipsometry, the sensitivity to deviations from the ambient-substrate system can be detected with high sen-sitivity for transparent samples at the Brewster angle. For ELS, there is also such a Brewster angle, around the scat-tering angle of 90◦. While in reflection ellipsometry, the Brewster angle is mainly governed by the minimum of the amplitude reflection coefficients with p-polarisation, it cor-responds to the minimum inS2 in ELS. The special sen-sitivity of measurements to deviations from the ideal point scattering behaviour especially due to anisotropy near that minimum was noticed before [13], but is only now ex-ploited on a regular basis.
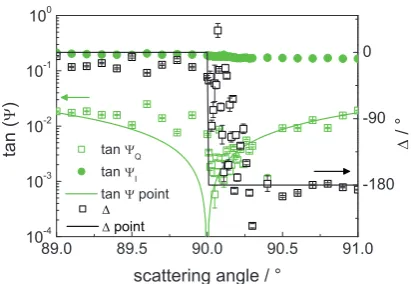
This Brewster angle is illustrated in Figure 1. It com-pares measurements from sodium dodecyl sulfate (SDS) micelles in salt-free aqueous solution to the expected re-sults for a point scatterer (Rayleigh scattering). There is a clear minimum in both measured the tan(ΨQ), as well as tan(ΨI). This minimum goes along with a “jump” inΔ from 0◦ to±180◦. As discussed previously, the minimum in tan(ΨI) is not as sharp as the minimum in tan(ΨQ) [4, 5]. The sharper minimum for tan(ΨQ) shows the benefits of the ellipsometric detection scheme over the simple intensity-based quantities.
89.0 89.5 90.0 90.5 91.0
10
-4
10
-3
10
-2
10
-1
10
0
-180 -90 0
/ °
t
an
(
)
scattering angle / ° tan
Q
tan
I
tan point
point
Fig. 1.Ellipsometric parameters tan(ΨQ) (green open squares),
tan(ΨI) (green circles), andΔ(black open squares) of SDS
mi-celles, compared to tan(ΨQ) (green line) andΔ(black line) for a
point scatterer at a wavelength of 532 nm.
The radius of the SDS micelles was determined by dy-namic light scattering as (3.6±0.5) nm. Compared to a
wavelength of 532 nm, these micelles are usually consid-ered as point scatterers. A full Mie Mie computation con-firms the point scattering behaviour. As Figure 1 shows, the behaviour is indeed very close: the minimum in tan(ΨQ) (i.e. the Brewster angle) is close to the minimum for the point scatterer. There are, however, remaining deviations which are above the experimental error, in the exact posi-tion of the Brewster angle. While the ideal point scatterer shows a Brewster angle of 90◦, in the case of SDS we ob-serve a∼0.1◦ shift to higher scattering angles. This shift can be caused by ion adsorption, far-reaching changes in the solvent structure around the particle, or anisotropy due to internal structure [5, 7, 8]. The shift shows the high sen-sitivity of ELS for Mie scattering effects beyond the simple approximation in of Rayleigh scattering.
The position of the Brewster angle reflects the size of the particles. With positive contrast, i.e. if the refractive in-dex of the particle is larger than the the refractive inin-dex of the medium, the Brewster angle shifts to larger angles with increasing particle size [5]. Note the high sensitivity of ELS on particle size. In SLS, in contrast, the minimum size for the radius of gyration which can be measured is usually indicated asλ/20. If the particles are sufficiently small so that only Mie coefficientsa1,a2,b1andb2need to be included in the computation, the position of the Brew-ster angleθBcan be computed analytically as [14]
cos(θB)=
−3a1−5b2+
√
(3a1+5b2)2−40a2(3b1−5a2)
20a2 . (7)
Figure 1 also implies that far away from the Brew-ster angle, many systems show very similar parameters, an expected phenomenon for particles which are smaller than the wavelength. This similarity is shown for triblock copolymer colloids ([7], see also 4) in Figure 2 over the complete range of scattering angles available. The inset shows in detail the results near the Brewster angle. From such measurements, information about the layers around the particles can be extracted. Far away from the Brewster angle there is no special feature in the curve, if the par-ticles are sufficiently small (see section 6), implying that the ELS curves of particles of many different types look identical. In the region far from the Brewster angle, devia-tions from the ideal behaviour can be shown to arise from nonidealities in the optical setup. Measurements far away from the Brewster angles have been used to calibrate the birefringence of the sample cells used [6, 5].
5 Applications
20 40 60 80 100 120 140 160 10
-3
10
-2
10
-1
10
0
90 91 92 10
-3 10
-2
0 90 180
PEG-
PNIPAM-PMMA
/ °
ta
n
(
Q
)
scattering angle / °
0 45 90 135 180
scatteri ng angl e / °
Fig. 2.Ellipsometric parameters tan(ΨQ) (red open squares) and Δ(black filled squares) of a dispersion of PEG-PNIPAM-PMMA particles [6] measured at 633 nm at 25◦C. An inset shows a mag-nified view of the region around the Brewster angle with the same quantities as the main figure.
insoluble aboveTLCST. By ELS, it was possible not only to determine the temperature-dependent decrease of the layer thickness of the layers on the particles, but also the temperature-dependent increase in the layer refractive in-dex. For the characterisation of such particles, the index sensitivity is a major advantage over small angle scattering techniques, which have to rely on contrast variation tech-niques in order to elucidate the contrast of the layers [6].
A further successful application was the characterisa-tion of the ion distribucharacterisa-tion around charged, spherical latex particles stabilised by perfluoroctanate or SDS [7]. Diff er-ent concer-entrations of NaCl were added, and a pronounced shift in the location of the Brewster angle was observed. The NaCl concentration was kept well below the critical coagulation concentration, so the repulsive electrostatic in-teractions remain sufficiently strong to avoid particle ag-gregation and to keep a situation with isolated particles in solution. For the different NaCl concentrations, a thick-ness parameter and a refractive index could be extracted from the measurements. For high concentrations of NaCl, both quantities are inconsistent with the frequently applied Poisson-Boltzmann (PB) description of the ion distribu-tion. The behaviour observed resembles a prewetting tran-sition, and may be due to ion-ion interactions, effects of water structure or van-der-Waals interactions between the low molecular weight ions and the colloidal particles. All the aforementioned effects are not considered in the PB de-scription. This experiment is one of the few studies in the field of the characterisation of the ion distribution about such large particles [7]. A related observation concerncs the wetting of colloidal interfaces in an aqueous medium by oct-1-en [15].
In follow-up experiments, CsBr was used instead of NaCl as a salt with higher refractive index contrast. The results of the ellipsometric curves are displayed in Figure 3. As in the previous results for NaCl, there is also a char-acteristic shift in the Brewster angle, due to the presence of
the CsBr near the surface. In this case, however, the sim-ple core-shell model employed in previous analyses [7] is not sufficient to describe the data. Comparing the raw data published previously with NaCl [7] to those obtained with CsBr, there are slight differences. While with addition of NaCl, the Brewster angle shifts to lower scattering angles with increasing salt concentration, the opposite is observed with addition of CsBr. The overall shift in the Brewster angle with increasing salt concentration is lower for CsBr (0.05◦ for CsBr, 0.1◦ for NaCl). The fact that in the case of the experiments with CsBr, the minimum of tan(ΨQ) is less pronounced, as well as the slight overall shift of the Brewster angle may be related to an non-perfect alignment of the setup while these experiments where conducted.
90.8 91.0 91.2 91.4
10
-3
10
-2
-180 -90 0
c CsBr
= 1.2*10 -3
M c
CsBr = 1.8*10
-4 M
t
an(
Q
)
scattering angle / °
/ °
Fig. 3.Ellipsometric parameters tan(ΨQ) (green) andΔ(black) at
532 nm of poly(styrene) latex Eur41 as used in previous experi-ments [5, 7] in the presence of 1.2×10⁻³M CsBr (open squares), and 1.8×10⁻⁴M CsBr, respectively.
The non-perfect alignment may contribute to the fact that these data cannot quantitatively be fit to the oversim-plified model of a single shell with constant refractive in-dex. Some qualitative insight can nevertheless be obtained. Simulations performed previously show that the changes in the signal predicted by the PB description are below the er-ror limit of detection [7]. Here, a significant effect is found for CsBr. Even though the overall refractive index contrast is larger for CsBr, the change in the raw data is smaller than for NaCl, indicating a difference between the salts. It must be stated, however, that enrichment of one ionic species on the surface goes along with depletion of another species, leading to involved effects on the overall refractive index.
po-larisability, the tilt angle of the lipid acyl chains with re-spect to the bilayer normal could be determined. The value was found to be (29±0.5)◦, which is close to the tilt angle found in planar bilayers. To our knowledge, this experi-ment was the first successful determination of the tilt angle in a spherical structure.
As a next step, the internal anisotropy of poly(styrene) spherical latex particles could be shown [5]. Such poly(sty-rene) particles are frequently assumed to be isotropic, but again due to the fact that one deals with radial anisotropy, the anisotropy is difficult to determine by other methods. On the other hand, considering the growth mechanism of a latex particle and the action of the interface tension, an internal anisotropy is not surprising. In fact, if there is an anisotropy, it is expected to be radial, therefore does not show up in many experiments.
6 Outlook
In the previous applications, the focus was on spherical particles. Non-spherical, polydisperse particles, especially with an anisotropic internal structure, are important sys-tems, because they are frequently occuring for inorganic colloidal systems. The understanding of such particles pre-sents, however, potentially some difficulties. Sequential de-composition of Mueller matrices may be useful in order to separate the effects in the signals from different origins [11, 16, 17].
Previously, especially for large particles, cases where observed where the data at the different wavelengths em-ployed in the study cannot be fit simultaneously to a phys-ically suitable model. The reason for this is unclear so far. For metal particles, computations have shown consid-erable deviations of the Brewster angle from 90◦have been found already for very small particle sizes. This behaviour is due to the large refractive index difference. So far, metal particles have not been investigated at all by ELS, due to potential problems with their absorption, and technical is-sues in the fits. An ELS investigation of metallic particles is, however, still on the agenda.
One other interesting problem to be explored are non-spherical particles. The setup can basically be used also in other measurement schemes. Therefore, Mueller ma-trix elements from non-spherical particles can also be de-termined. However, the extraction of meaningful data re-quires fast and reliable forward calculation of the scatter-ing functions, which is still a stickscatter-ing point.
Overall, ELS has a high potential to develop over the coming years, from routine sample analysis, e.g. in indus-trial environments, to high-end scientific problems, such as follow-ups on the ion distribution question, or induced anisotropy.
7 Acknowledgements
Most of the experimental work was done at the Max Planck Institute of Colloids and Interfaces in Potsdam. We thank Klaus Tauer for the supply of high-quality samples and
Birgit Schonert for help in sample preparation. Funding by the Max Planck Society and the German Science founda-tion (Project SI 1092/1-1) is gratefully acknowledged.
References
1. S. Roke, W.G. Roeterdink, J.E.G.J. Wijnhoven, A.V. Petukhov, A.W. Kleyn, M. Bonn, Phys. Rev. Lett.91, (2003) 258302
2. S. Roke, M. Bonn, A.V. Petukhov, Phys. Rev. B70, (2004) 115106
3. S. Roke, O. Berg, J. Buitenhuis, A. van Blaaderen, M. Bonn, Proc. Nat. Acad. Sci.103, (2006) 13310-13314 4. R. Sigel, A. Erbe, Appl. Opt.47, (2008) 2161-2170 5. A. Erbe, K. Tauer, R. Sigel, Langmuir 25, (2009)
2703-2710
6. A. Erbe, K. Tauer, R. Sigel, Phys. Rev. E,73, (2006) 031406
7. A. Erbe, K. Tauer, R. Sigel, Langmuir,23, (2007) 452-459
8. A. Erbe, R. Sigel, Eur. Phys. J. E22, (2007) 303-309 9. A. Stark, PhD thesis (University of Potsdam, Potsdam
2008)
10. C.F. Bohren, D.R. Huffman,Absorption and scatter-ing of light by small particle(Wiley-VCH, Weinheim 2004)
11. J.J. Gil, Eur. Phys. J. Appl. Phys.40, (2007) 1-47 12. R.M.A. Azzam, N.M. Bashara, Ellipsometry and
Po-larized Light, Elsevier Science Publisher, Amsterdam, 1992
13. B. Lange, S.R. Arag´on, J. Chem. Phys. 92, (1990) 4643-4650
14. A. Erbe, PhD thesis (University of Potsdam, Potsdam 2004)
15. K. Tauer, N. Weber, S. Nozari, K. Padtberg, R. Sigel, A. Stark, A. V¨olkel, Macromol. Symp.281, (2009) 1-13
16. O. Arteaga, A. Canillas, J. Opt. Soc. Am. A26, (2009) 783-793
![Fig. 2. Ellipsometric parameters tan(ΨQ) (red open squares) andΔ (black filled squares) of a dispersion of PEG-PNIPAM-PMMAparticles [6] measured at 633 nm at 25 ◦C](https://thumb-us.123doks.com/thumbv2/123dok_us/9032543.1439771/4.595.321.529.288.428/ellipsometric-parameters-squares-lled-dispersion-pnipam-pmmaparticles-measured.webp)
