Power Management System For Isolated Hybrid
PV/WT/PEMFC Power Generation
Rupendra Kumar Pachauri, Yogesh K. Chauhan, Safia A. Kazmi
Abstract: In this article, an energy source for standalone power generating scheme is incorporated into a hybrid wind turbine (WT)/photovoltaic (PV)/fuel cell (FC). WT and PV systems are the system's main power generator, while the FC system is used as an energy backup source. For the suggested scheme, a general power management strategy is intended to handle the power flows among the various sources of energy. Using MATLAB/Simulink, a simulation model for the hybrid power scheme was developed. The system efficiency is explored using transient assessment of system parameters under distinct load demand energy situations.
Index Terms: Blade pitch angle, fuel cell, hybrid power generation, photovoltaic system, power management, renewable energy, wind turbine.
—————————— ——————————
1.
INTRODUCTION
DUE to its multiple advantageous properties like the ecological, financial, etc., renewable energy (RE) sources are becoming extremely demanding. Reliability is another important aspect where, the hybrid power generation is gaining more popularity [1]. The conventional electric power is generated using fossils fuels (hybrid or non-hybrid systems), but the rising fuel prices, scarcity and difficulties of transportation, have forced to search more energy sources [2]. In different apps, the WT based conversion scheme and PV technologies are frequently used [3]. Nowadays, wind power is one of the increasing RE sources and is used for several reasons [4]. The PV cell transforms solar energy directly into power but the PV system's energy conversion efficiency is small [5-7]. The PV system uses residential appliances, business machinery, lighting and air conditioning for all kinds of houses, primarily as a grid-connected energy [8]. PV panels and construction roofs can be installed on the floor. For various locations, the climatic situations such as sun irradiance, wind speed, variable temperature are different which reduce the performance of the system for electric power production from PV and WT system. For reliability point of view, hybrid power generation concept is more acceptable now-a-days [9]. For this purpose, PV and WT are considered as a primary sources and FC, storage devices used as power backup sources. FC is a static noise less system, eco-friendly and high power density system; also it is used for both mobile and stationary applications [10].
The authors of [11] proposed a concept with extensive studies to integrate more than one RE sources e.g. solar, wind and hydrogen for power generation. In [12], the authors gave a concept on the hybrid power generation. The dynamic conduct of an island system with a hybrid energy scheme will be analyzed and the impact on the transient conduct of the structure of the multiple hybrid energy system working
methods examined. The writers of [13] reported on a hybrid power generation concept that includes RE sources such as wind, PV and battery systems. With grid inclusion, the efficiency of the scheme proposed was explored. The authors in [14], proposed a concept on hybrid power system with the combination of RE sources e.g. wind, hydropower and PV system etc. The transient analysis of the system is investigated on the customer variable load. In [15], a hybrid energy generation system WT/PV/FC was intended and examined. In this setup, a FC stack, electrolyzer and H2 storage tank are used as an energy storage system. The performance of the MATLAB/Simulink based system is investigated under dynamic performance. The authors of [16] discussed a concept on the hybrid PV/FC/battery power generation and power management scheme is also used. The authors of [17] proposed a system which is an integration of RE sources, such as FC and battery system for power generation. To investigate with a smart power management scheme, the writers of [18] suggested a grid-connected WT/PV hybrid energy scheme. The findings of the simulation confirmed the suggested scheme of hybrid generation. The authors of [19] proposed a concept on the hybrid WT/FC and a super capacitor. A general approach to energy monitoring was developed to monitor energy flow. A hybrid system mathematical assessment using MATLAB/Simulink models. The simulation findings demonstrate the efficiency of the control approach to optimally manage the hybrid power generation device in distinct power generation and load demand situations. The writers of [20] reported hybrid generation of PV / FC energy; FC operation was based on the electrolyzer scheme. The authors in [21], proposed a hybrid WT/PV/FC/ultra-capacitor system for stand-alone applications. A variety of wind velocity, solar radiation and load demand circumstances test the dynamic conduct of the suggested hybrid scheme. An advance power management scheme can be implemented to enhance the system performance. The motive of the above literature review is to add study news to the design of an advanced PV/WT/FC hybrid energy management scheme. Furthermore, the transient investigation of amalgamation WT/PV/FC power system is carried out for performance improvement by designing a simple and effective power management scheme.
——————————————
Dr. Rupendra Pachauri is currently working as an Assistant Professor (Sr. Scale) in the Department of Electrical and Electronics Engineering, School of Engineering, University of Petroleum and Energy Studies, Dehradun, India, PH-+91-7455077626. E-mail: [email protected]
Dr. Yogesh K. Chauhan is currently working as an Associate Professor in the Department of Electrical Engineering, KNIT, Sultanpur, Uttar Pradesh, Email: [email protected]
4757
2
SYSTEM
DESCRIPTION
AND
UNIT
SIZING
2.1 System description
The system description for the suggested hybrid RE scheme is shown in the Fig. 1. The system consists of (i) PV system (a) Fuzzy logic controlled MPPT method (b) DC-DC solar boost converter (ii) WECS (a) Fuzzy logic controlled blade pitch angle controller (b) AC-DC converter (iii) Proton exchange membrane fuel cell (PEMFC) (a) Fuzzy logic controlled reactants flow pressure controller (b) DC-DC FC boost converter (iv) Dump load (v) Variable DC load.
DC Bus
P
E
M
F
C ifc
Fuzzy Logic Controller K 2 O m 2 H m ref P act P Pressure Actuator D C /D C
PEM Fuel Cell System
H2 Storage Tank
2 H m 1 S 2 S 3 S Dump Load 4 S Wind Energy Conversion Sytem
F L C o n tro lle r
r e f a c tu a l
U tility V a ria b le
W in d
B la d e P itc h A n g le C o n tro l
P M S G
E le c tric
c a b le D
io de R ec tif ie r Fuzzy Logic Controlled MPPT PWM Pulse Generator Boost Convereter DC/DC G T Sensed Parameters V I D VPV
IPV IL PV System
PV System with MPPT Control
2 O m P ow er m an ag em en t s ys te m
O2 Storage Tank
C on tr ol si gn al s Demand power
Fig. 1 System configuration of hybrid PV/WT/FC energy
system
2.2 System unit-sizing
The unit size mentioned here applies to the stand-alone hybrid system in Fig. 1. The object of the unit size research is to correctly dimension the system parts and ensure electrical supply reliability. The considered variation of load demand is shown in Fig. 2 as,
0 2 4 6 8
1000 2000 3000 4000 Time (Sec) P d e m a n d ( W ) Case- I II III IV V VI VII VIII
Fig. 2 Variation of demand power
The following idea is implemented before the debate on the unit size to indicate the general effectiveness and accessibility of a RE source [22].
Capacity factor (Kcf) of used RE source is given as,
act cf rated P K P (1)
where, Pact is the average current production over a time period and Prated is the RE source power evaluation. The objective is to minimize the distinction between energy produced (Pgen) and demand power. The aim is to minimize the difference between the generated power (Pdem) and the demand power over a fixed time period [24].
_ _ _ _
act dem
cf WT WT rated cf PV PV rated dem
P P P
K P K P P
(2)
Where, PPV_rated is the power ranking of PV array and PWT_rated is the WT power capacity. Similarly, the Kcf_PV and Kcf_WT are the capacity factors of PV and WT array respectively. The rated power for the PV scheme is conveyed to balance energy generation and demand using Eq. (3) as,
_ _
_
_
-dem cf WT WT rated PV rated
cf PV
P K P
P
K
(3)
Fig. 2, it can be observed that the load demand (average) is 2.3 kW. Then accordingly to the Eq. (3), the PV array size is evaluated to be as 1506.35W. The system component parameters are shown in Table 1.
TABLE1
SYSTEM COMPONENT PARAMETERS
Solar PV array
Rated power 1506.35 W
Module rating 50W(21.55V×2.32A) @ STC No. of modules (SP) 10 × 3 = 30 modules
WECS
Rated Power 1528 W
Rated torque -19 Nm
Cut-in speed 3 m/s
Cut-out speed 24 m/s
PEMFC System
Stack power 1209 W
Single FC voltage 0.631 V
No. FCs in stack 337
3
MODELING
OF
SYSTEM
The modeling of various system components are detailed in this section.
3.1 Modeling of FLC based MPPT assisted PV system
3.1.1 Modeling of PV system
ph
I
D
s
R
o
I
I
c
c
V
Fig. 3 Electrical circuit of solar PV cell
PV system cell voltage (VC) is mainly based on cell temperature and the load present in Eq. (4) as,
ln ph o c
C
C s c
o
I I I
AkT
V R I
e I
(4)
The CTV and CTI temperature coefficients for V and I are shown by Eq. (5)-(6) respectively.
1
TV T a x
C T T
(5)
1 T
TI x a
C
C T T
S
(6)
Correction coefficients factors (CSV and CSI) are given in Eq. (7)-(8) as,
1
SV T S x c
C S S (7)
1 1
SI x c
c
C S S
S
(8) The VCX and Iphx are expressed by Eq. (9)-(10),
cx TV SV C
V C C V
(9)
phx TI SI ph I C C I
(10)
Using Eq. (4)-(10), modelling of PV system is done in MATLAB/Simulink GUI environment.
3.1.2 Fuzzy logic controlled MPPT method
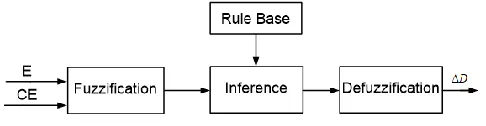
The fuzzification, rule base, inference and de-fuzzification are main components of FLC [24], as shown in Fig. 4 as,
Fig. 4 FLC-based MPPT method block diagram
Error (E) and change of error (CE) are defined in Eq. (11) and (12) as,
(n)
(n 1)
(n)
(n)
(n 1)
PV PV
PV PV
Power
Power
Error
Voltage
Voltage
(11)
ChangeError
(n)
Error
(n)
Error
(n 1)
The Input and output variables membership functions are shown in Fig. 5(a)-(c) as,
1
0.8
0.6
0.4
0.2
0
0.2
0.4
0.6
0.8
1
NB
NM NS
ZE
PS
PM
PB
'E'
(a) Error ‘E’
0.04
NB NM NS ZE PS PM PB
0.02
0.01 0 0.01 0.02 0.04
'C
E'
0.03
0.03
(b) Change in error ‘CE’
0 0.1 0.2 0.3 0.4 0.5 0.6 0.7 0.8 0.9 1.0
NB
NM
NS
ZE
PS
PM
PB
' D'
(c) Duty cycle ‘ΔD’
Fig. 5(a)-(c) Membership function of FLC based MPPT
method
The used rule base (RB) are shown in Table 2 as,
TABLE2
RULE BASE FOR DUTY CYCLE CONTROL
3.2 Modeling of WECS 3.2.1 Modeling of WT
WT is a mechanical energy that converts wind power. A WT can operate with the changeable angle and tip rate ratio (TSR) at a constant speed to generate constant energy [25]. The wind power is same to the quantity of per second energy produced. The mechanical power of WT is given by Eq. (13) as,
2 3
0.5 ( , )
m p w
P R C V (13)
4759 5
2
1 3 4 6
( , ) i
C
p
i
C
C C C C e C
(14)
3
1 1 0.035
0.08 1
i
(15)
/ w
R V
(16)
Where, ω is the rotor speed (rad/s). The Cp (efficiency coefficient) is the element of the energy obtained by WT from the complete power.
3.2.2 Modeling of permanent synchronous generator The PMSGs are used for a variety of business applications. Usually PMSG converts WT's mechanical output into power for the scheduled system. Eq. (17) and (18) gives the PMSG mathematical model [24] as,
( ( ) )
q s q e qs ls d q
qs ls
di R i L L i u
dt L L
(17)
( s d e( qs ls)q d)
d
ds ls
R i L L i u di
dt L L
(18)
The generator rotor speed (ωe) (rad/s) and EM torque (τem) are given in Eq. (19) and (20) as,
e p g
(19)
1.5 (( ) )
em p Lds L i ils d q iq f
(20)
3.2.3 Blade pitch angle controller
Error and Change Error are given in Eq. (21) and (22) as,
Error
(n)
(n)
(n 1)
(21)(n)
(n)
(n 1)
ChangeError
Error
Error
(22) The rule base (25 rules) considered in this controller, is shown in Table 3 as,TABLE3
FUZZY RULE BASE FOR BLADE PITCH ANGLE
E/CE NB NS ZE PS PB NB NB NB NS NS ZE NS NB NS NS ZE PS ZE NS NS ZE PS PS PS NS ZE PS PS PB PB ZE PS PS PB PB
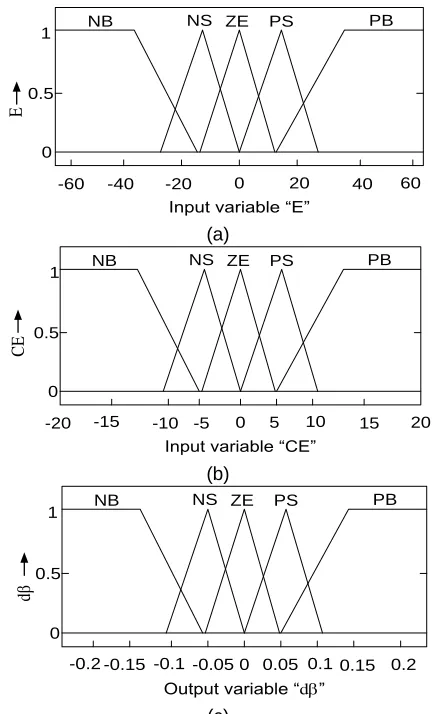
For FLC design, the shift in the pitch angle (dβ) is the error "E" and error "CE" of the WT torque and output. With this obtained pitch angle, WT optimal torque is achieved. The features input-output are depicted in the Fig. 6(a)-(c) as,
0 20 40 60
-20 -40 -60 0 0.5
1 NB NS ZE PS PB
Input variable “E”
E
(a)
0 5 15 20
-5 -10 -20
0 0.5
1 NB NS ZE PS PB
Input variable “CE”
-15 10
CE
(b)
0 0.05 0.15 0.2 0
0.5
1 NB NS ZE PS PB
Output variable “d” 0.1 -0.05
-0.1 -0.15 -0.2
dβ
(c)
Fig. 6(a)-(c). Membership functions of FL based blade pitch
angle controller
3.3 Modeling of fuel cell system
3.3.1 Proton exchange membrane fuel cell
The FC voltage (Vfc), at any occurrence could be represented by Eq. (23). Nernst voltage (E) (Without load voltage) is decreased by three types of voltage drop classifications as,
fc act conc ohm
V
E V
V
V
(23)
The Nernst equation (NE) is represented in Eq. (24) [30] as,,
2 2
2
1 2
0 ln
2
H O H O P P RT
E E
F P
(24)
The activation decrease can be shown by the Tafel’s expression in Eq. (25) that decreases the activation voltage
V
act as,
5
2
0.9514 0.00312 0.00018 ln
7.4 10 ln .
act
V T T I
T Conc O
(25)
2
2 498
6
.
5.08 10
exp
TPo
Conc O
(26)
The voltage drop is almost linear in nature and ohmic (Vohm). Membrane resistance (Rmem) is determined by separating tm
by conductivity
k1cm1
, are shown in Eq. (27) and (28) as,ohm mem
V
IR
(27)m mem
t
R
(28)
The cell potential reduces quickly at greater present densities owing to mass limits. The linearity is called the concentration of potential and is expressed in Eq. (29) [28] as,
3
1 2
(
273)
c l conc
V
c
c T
e
(29)Here the coefficients
c
1,c
2 andc
3 and Eq. (23)-(29) could beanalysed for cell potential.
3.3.2 H2 and O2 flow rate controller
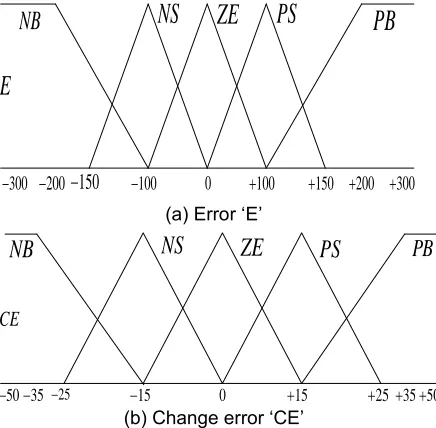
A FLC is used to control the reactants (H2 & O2) flow pressure of the PEMFC. In the FLC, E and CE are considered as input variables and molar flow rate as output as shown in Fig. 7 [29]. Both the E and CE can be obtained for nth sample time using Eq. (30) -(31) as,
ref(n)
act(n)
Error n
Power
Power
(30)
1
ChangeError n
error n
error n
(31) The membership function of E, CE (inputs) and reactant molar flow rate output
mH2
are shown in Fig. 8(a)-(c) and fuzzy RB depicted in Table 4 as,NB
NS
ZE
PS
PB
300
E
200
150
100 0 100 150 200 300(a) Error ‘E’
0
NB
NS
ZE
PS
PB
CE
15
15
25
25
50
35 3550
(b) Change error ‘CE’
NB
NS
ZE
PS
PB
2
H
m
0.1
0.08 0.05 0.01 0 0.01 0.05 0.08 0.1
(c) Reactant molar flow rate
Fig. 7(a)-(c). Membership functions
TABLE 4
RULE BASE FOR HYDROGEN FLOW RATE
E/CE NB NM ZE PM PB NB NB NB NS NS ZE NS NB NS NS ZE PS ZE NS NS ZE PS PS PS NS ZE PS PS PB PB ZE PS PS PB PB
The authors in [30] proposed that suitable value of hydrogen is 2.617 times that of O2 and the optimal factor is achieved as 2.608 for PEMFC operation. In this controller, both reactants are controlled simultaneously by using this relation in FLC.
4
POWER
MANAGEMENT
SYSTEM
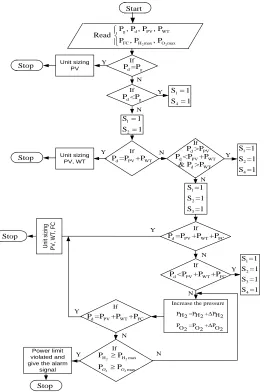
The general power management approach among distinct energy sources is required for optimum use. WECS is controlled by a photovoltaic device and a controller of blade angles controlled by a highest surveillance point. In addition, the flow pressure controller for reactants (H2 and O2) is intended for effective and precise FC operation under variable demand force. The energy difference between the sources and the demand for load is calculated and expressed in Eq. (32) as,
net WT PV Load Dump P P P P P
(32)
where, PWT is the WECS generated power, PLoad is the load demand, PPV is the PV system power and PDump is the dump power. The principal power management strategy is that, whenever excess power is generated by PV and WECS system (Pnet> 0); it is directed towards the dump load. Hence, the power balance equation can be expressed in Eq. (33) as,
WT PV Load Dump P P P P
(33)
When there is insufficiency in generated power (Pnet< 0); the FC system starts to generate the required power to meet the load demand. Eq. (34) can express the power balance as,
WT PV FC Load
P P P P
(34) where, PFC is the FC system power produced.
4761
2 2
g d PV WT FC H max O max
P , P , P , P Read
P , P , P
d
P =Pg
Y
N
d g
P <P 1
4 S 1 S 1 Y 1 2 S 1 S 1
d PV WT
P =P +P
Y N
d PV WT
P <P +P Y 1
2 4 S =1 S =1 S =1 N 1 2 3 S =1 S =1 S =1
d PV WT FC
P =P +P +P
d PV WT FC
P <P +P +P
1 2 3 4 S =1 S =1 S =1 S =1 N N Y Y N
Increase the pressure
PH2=PH2+ΔPH2
PO =PO +ΔPO
2 2 2
d PV WT FC
P =P +P +P
Y
2 2
2 2 H H max
max
P P PO PO
N
Power limit violated and give the alarm
signal Y Stop N If If If If If If If If Start U ni t s iz in g P V , W T , F C Unit sizing PV, WT Unit sizing PV d PV P >P d WT
& P >P
Stop Stop Stop
Fig. 8 Flow chart of the power management scheme for the
proposed hybrid RE system
5
RESULTS
AND
DISCUSSION
Studies were performed using separate load demand to check system efficiency under different circumstances. The findings achieved validate the model of the simulation as,
• Characteristics of the PV, WT and FC system • Analysis of PV system
• Analysis of WT system • Analysis of FC system
• Analysis with power management scheme in various load demands
5.1 Characteristics of the PV, WT and FC system
The Performance curves of the PV, WT and FC system are depicted in Fig. 9(a)-(c). Fig. 9(a) shows the P-V and I-V characteristic of the designed PV system for changing irradiation level which is step varied in the range 400-1000W/m2. Due to change in irradiation level, the PV output V, I and P are analyzed to vary in the range 8-21.55V, 1.7-2.32A and 13.6-50W respectively.
0 4 8 12 16 20 24
15 25 35 45 55 Voltage (Volt) P o w e r (W a tt )
Sx=1000 W/m2
Sx=800 W/m2
Sx=600 W/m2
Sx=400 W/m2
(i)
0 4 8 12 16 20 24
1.5 2 2.5 Voltage (Volt) C u rr e n t (A )
Sx=600 W/m2 Sx=800 W/m2 Sx=1000 W/m2
Sx=400 W/m2
(ii)
(a)(i)-(ii) P-V and I-V curves of PV system with variable irradiance
2 4 6 8 10 12 14
0 0.1 0.2 0.3 0.4 0.5 Cp
=0o =2o =4o =6o =8o =10o =12o =14o =16o
(b)
0.5 1 1.5 2 2.5 3
0 0.4 0.8 1.2 Current (Amp) Vo lt a g e (Vo lt ) Voc V act V conc Vohm Vfc (c)
Fig. 9(a)-(c) Characteristics of PV, WT and FC system
Fig. 9(b) shows the Cp-λ curve for variable β (0 o
-16o) of the designed PMSG assisted WT system. It is evident from the curve that maximum value of Cp i.e. 0.48 is achieved at λ =8 and minimum value of β i.e.0o
Single PEMFC voltage is observed to be 0.631V.
5.2 Characteristics of the PV, WT and FC system
The production voltage, present and energy of the PV scheme supported by the MPPT technique based on the FLC are shown in Fig. 10 as,
Fig. 10 Voltage, current and power of FLC based MPPT
assisted PV system
In the Fig. 10 For FLC-based MPPT-PV scheme with irradiance levels of 1000 W / m2, working temperature 25 °C is observed 215.51V, 6.99A and 1506.35W, respectively.
5.3 Performance analysis of WT system
The performance of blade pitch angle controller assisted WECS is analyzed under changed wind speed conditions. The wind speed is varied randomly 10-12.5 m/sec (range), shown in Fig. 11 as,
Fig. 11 Variation of wind speed (m/s)
As the wind speed varies in the above specified pattern, the output of WT torque (τWT) changes. This change in WT torque is adjusted by the blade pitch angle controller by varying β as shown in Fig. 12(a)-(b). The reference value of τWT is taken as -19 Nm and the variation of τWT and β is reported to in the range -18.69 to -19.23 Nm and 2 to 8.107o respectively.
0 2 4 6 8 10
-20 -19 -18
Time (Sec)
W
T
(
N
m
)
(a) Output WT torque
0 2 4 6 8 10
2 4 6 8
Time (Sec)
(
o)
(b) Blade pitch angle of WT
Fig. 12(a)-(b) WT torque and blade pitch angle of WECS at
variable wind speed
5.4 Performance analysis of FC system
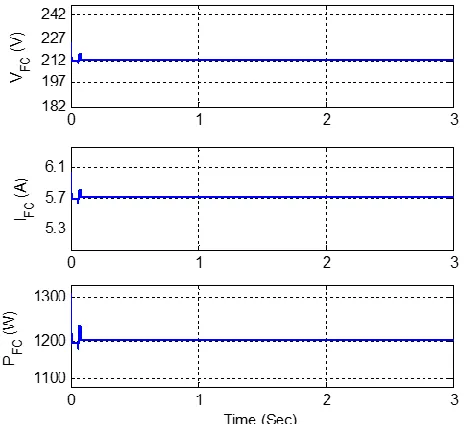
In Fig. 14, 2122.3V, 5.7A and 1209.71W are displayed the output V, I and P of the designed FC system as,
Fig. 14 PEMFC voltage, current and power at fixed reactants
flow pressure
5.5 Performance analysis of FC system
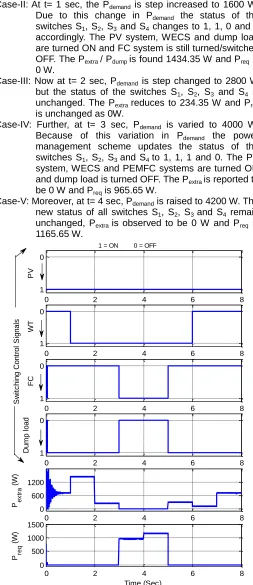
For variable power demand circumstances from case I to VIII, the performance of the suggested electricity management aided generation system is analyzed as,
4763 Case-II: At t= 1 sec, the Pdemand is step increased to 1600 W.
Due to this change in Pdemand the status of the switches S1, S2, S3 and S4 changes to 1, 1, 0 and 1 accordingly. The PV system, WECS and dump load are turned ON and FC system is still turned/switched OFF. The Pextra / Pdump is found 1434.35 W and Preq is 0 W.
Case-III: Now at t= 2 sec, Pdemand is step changed to 2800 W but the status of the switches S1, S2, S3 and S4 is unchanged. The Pextra reduces to 234.35 W and Preq is unchanged as 0W.
Case-IV: Further, at t= 3 sec, Pdemand is varied to 4000 W. Because of this variation in Pdemand the power management scheme updates the status of the switches S1, S2, S3 and S4 to 1, 1, 1 and 0. The PV system, WECS and PEMFC systems are turned ON and dump load is turned OFF. The Pextra is reported to be 0 W and Preq is 965.65 W.
Case-V: Moreover, at t= 4 sec, Pdemand is raised to 4200 W. The new status of all switches S1, S2, S3 and S4 remain unchanged, Pextra is observed to be 0 W and Preq is 1165.65 W.
0 2 4 6 8
1 0
PV
0 2 4 6 8
1 0
FC
0 2 4 6 8
1 0
S
w
itc
h
in
g
C
o
n
tr
o
l S
ig
n
a
ls
D
u
m
p
l
o
a
d
0 2 4 6 8
0 500 1000 1500
Time (Sec)
P re
q
(
W
)
0 2 4 6 8
1 0
WT
0 2 4 6 8
0 600 1200
P e
x
tr
a
(
W
)
1 = ON 0 = OFF
Fig. 15 Performance of power management scheme
0 2 4 6 8
500 1000 1500 2000
P P
V
(
V
)
0 2 4 6 8
0 500 1000 1500 2000
P W
T
(
W
)
0 2 4 6 8
0 500 1000 1500
P F
C
(
W
)
0 2 4 6 8
0 600 1200
Time (Sec)
P d
u
m
p
(
W
)
Fig. 16 Hybrid PV/WT/FC and dump power
0 2 4 6 8
0 2.5 5 7.5
PH
2
(
a
tm
)
0 2 4 6 8
0 7 14 21
Time (Sec) P O
2
(
a
tm
)
Fig. 17 Variation of reactants flow pressure (atm)
Case-VI: Furthermore, at t= 5 sec, Pdemand is step varied (reduced) to 2755 W. To compensate this change in Pdemand the status of the switches S1, S2, S3 and S4 is updated to 1, 1, 0 and 1 respectively. The PV system, WECS and dump load are turned ON and PEMFC system is turned OFF. The Pextra is reported to be 279.35 W and Preq is 0W.
Case-VII: At t= 6 sec, Pdemand is further step decreased to 1400 W. As a result of this variation in Pdemand, the status of all the switches S1, S2, S3 and S4 is updated to 1, 0, 0 and 1 respectively. The PV system and dump load are turned ON and WECS, FC systems are turned OFF. The Pextra is observed to be 106.35 W and Preq is 0 W.
Case-VIII: Finally at t= 7 sec, Pdemand is further step decreased to 800 W. The status of the switches S1, S2, S3 and S4 remain unchanged as previous case-VII. The Pextra and Preq are observed to be 706.35 W and 0 W respectively.
6.
CONCLUSION
A stand-alone dc-linked RE-based PV/WT/FC scheme is suggested in this document. The setup of the system and its unit size are explained; the features of the principal parts of the scheme are acquired: PV/WT/FC systems. The WT and PV systems are the primary generation sources of energy and FC systems that supply energy to the system under energy deficit circumstances are power back-up sources. The
suggested MATLAB/Simulink model of the hybrid scheme has been created. The transient system analysis was examined at variable load. In addition, the overall strategy for energy management for the proposed hybrid energy system is developed for the ideal application of different RE sources. The energy management system is tested in a number of instances and general output is satisfactory.
APPENDIX
Operating parameters of PEMFC, PV, WT and PMSG systems
PEM fuel cell operating parameters Operating parameters of PV
Reference potential, (E0) 1.229 V Curve fitting factor, A 1.4
Universal gas const., (R) 8.314 Jmol-1K-1 Boltzman constant,
k
1.38x10⁻²³ J/KFaraday constant, (F) 9.6485 C mol-1 Cell temperature , Tc 45 °C
Stack temperature, (T) 353 K Electron charge,
e
1.602x10⁻¹⁹ CoulombsFuel cell pressure, (P) 1.2 atm Series resistance, Rs 0.037
H2O Molar flow rate, (QH2O) 0.0298 mol sec-1 WT operating parameters
Anode volume, (Vanode) 0.0159 m3
Number of blades 3
Cathode volume, (Vcathode) 0.0025 m3 Blade radius (R) 4.5m Anode flow const. (kanode) 0.004 mols-1 atm-1 Gear ratio (G) 40
O2 Gas Constant, (
2 O
R
) 1.185
10-3 J kg-1 K-1 Pitch angle (β) Adjusted pitchH2O pressure, (
2 H O
P
) 2.032 atm Air density (ρ) 1.2 kg/m3 H2 Gas Constant, (2 H
R
) 0.00125 J kg-1K-1 Wind speed (vw) 10-18 m/secMembrane resistance (Rmem) 0.0056 Ω Tip speed ratio (λ) 9
Mass of H2O at Cath., (
2 H O
m
) 18.0
10-3 kg mol-1 Power Coefficient (Cp) 0.451 ,
2 0.951, 3.12
10-3 C1, C2, C3 0.5176, 116, .43 ,
4 1.8
10-4, 7.4
10-5 C4, C5, C6 5, 21, .0068Membrane Cond., ( ) 45.31 k1cm-1 PMSG operating parameters
Membrane thickness, (tm) 0.0026 cm Stator Phase Resistance (Rs) 0.4250 ohm
1, 2 1.1
10-4, 1.2
10-6 Inductance (Ld, Lq) 0.0084, 0.0084 H3 8
10-3 Inertia (Jg) 0.001469 Kg m2l
0.002 Friction factor (F) 0.0003035 N m sNumber of electrons, (n) 2 No. of pole 2
Mass of H2, (
2 H
m
) 0.004 kg mol-1 Rated torque (g) -15 NmMass of O2, (
2 O
m
) 0.0002 kg mol-1 Rated voltage & current 1140V, 7.15 AREFERENCES
[1] Bajpai P, Dash V. Hybrid renewable energy systems for power generation in stand-alone applications: a review. Renewable and Sustainable Energy Reviews 2012; 16: 2926–2939.
[2] Yilanci A, Dincer I, Ozturk H K. A review on solar hydrogen/fuel cell hybrid energy system for stationary applications. Progress in Energy and Combustion Science 2009; 35: 231-244.
[3] Balachander K, Kuppusamy S, Vijayakumar P. Comparative study of hybrid photovoltaic -fuel cell system/hybrid wind-fuel cell system for smart grid distributed generation system. IEEE Conference on Emerginging Trends in Science, Engineering and Technology 2012: 462-466.
[4] Rashidi H, Niazi S, Khorshidi J. Optimal sizing method of solar-hydrogen hybrid energy system for stand-alone application using fuzzy based particle swarm optimization algorithm. Australian Journal of Basic and Applied Sciences 2012; 6: 249-256.
[5] Varun, S K Singhal. Review of augmentation of energy needs using renewable energy sources in India. Renewable and Sustainable Energy Reviews 2007; 11: 1607– 1615.
[6] Narendra D, Kaushika, K Nalin, K. Gautam. Energy yield simulations of interconnected solar PV arrays. IEEE Transactions on Energy Conversion 2013; 18(1): 127-134. [7] Kawamura H, K Naka, N Yonekura, S Yamanaka, H Kawamura, H Ohno, K Naito. Simulation of I–V characteristics of a PV module with shaded PV cells. Solar Energy Materials Solar Cells 2003; 75(3/4): 613-621.
[8] Qi J, Zhang Y, Chen Y. Modeling and maximum power point tracking (MPPT) method for PV array under partial shade conditions. Renewable Energy 2014; 66: 337-345. [9] Ipsakis D, Voutetakis S, Seferlis P. Power management
strategies for a stand-alone power system using renewable energy sources and hydrogen storage. International Journal of Hydrogen Energy 2009; 34: 7081-7095.
4765 storage. IEEE Transactions on Control Systems
Technology 2014; 22: 169-179.
[11]Adi V S K, C T Chang. Development of flexible designs for PVFC hybrid power. Renewable Energy 2015; 74: 176- 186.
[12]Papaefthymiou S V, V G Lakiotis, I D Margaris, S A Papathanassiou. Dynamic analysis of island systems with wind-pumped-storage hybrid power stations. Renewable Energy 2015; 74: 544-554.
[13]Paiva J E, A S Carvalho. Controllable hybrid power system based on renewable energy sources for modern electrical grids. Renewable Energy 2013; 53: 271-279. [14]Carmeli M S, F C Dezza, M Mauri. Control strategies and
configurations of hybrid distributed generation systems. Renewable Energy 2012; 41: 294-305.
[15]Nelson D B, M H Nehrir, C Wang. Unit sizing and cost analysis of stand-alone hybrid wind/PV/fuel cell power generation systems. Renewable Energy 2006: 31: 1641-1656.
[16]Wu W, C Y Wang, J J Hwang. Scenario-oriented design of an MFC/PV/Battery based hybrid power generation system. Electrical Power and Energy Systems 2015; 66: 34-40.
[17] Hajizadeh A, M A Golkar. Intelligent power management strategy of hybrid distributed generation system. Electrical Power and Energy Systems 2007; 29: 783-795.
[18]Hong C M, C H Chen. Intelligent control of a grid-connected wind-photovoltaic hybrid power systems. Electrical Power and Energy Systems 2014; 55: 554-561. [19]Abdelkafi A, L Krichen. Energy management optimization
of a hybrid power production unit based renewable energies. Electrical Power and Energy Systems 2014; 62: 1-9.
[20]Hosseini M, I Dincer, M A Rosen. Hybrid solar-fuel cell combined heat and power systems for residential applications: Energy and exergy analysis. Journal of Power Sources 2013; 221: 372-380.
[21]Onar O C, M Uzunoglu, M S Alam.Modeling, control and
simulation of an autonomous wind
turbine/photovoltaic/fuel cell/ulta-capacitor hybrid power system. Journal of Power Sources 2008; 185: 1273-1283. [22]Wang C, Nehrir M H. Power management of a
stand-alone wind/photovoltaic/fuel cell energy system. IEEE Transactions on Energy Conversion 2008; 23: 957-967. [23] Chiang S J, Chang K T, Yen C Y. Residential
photovoltaic energy storage system. IEEE Transactions on Industrial Electronics 1998; 45: 385–394.
[24]Altas I H, Sharaf A M. A novel on line MPP search algorithm for PV arrays. IEEE Transactions on Energy Conversion 1996; 11: 748-754.
[25] Pachauri R K, Y K Chauhan. Mechanical control methods in wind turbine operations for power generation. Journal of Automation and Control Engineering 2012; 2: 214-220. [26]Shariatpanah H, R Fadaeinedjad, M Rashidinejad. A new
model for PMSG based wind turbine with yaw control. IEEE Transactions on Energy Conversion 2013; 28: 929-937
[27]Belghazi O, M Cherkaoui. Pitch angle control for variable speed wind turbines using genetic algorithm controller. Journal of Theoretical and Applied Information Technology 2012; 39: 6-10.
[28]Pachauri R K, Y K Chauhan. Study and performances analysis of fuel cell assisted vector control variable speed drive system used for electric vehicles. International Journal of Sustainable Energy 2015; 35: 1-25.
[29]Hajizadeh A, M A Golkar. Fuzzy control of fuel cell distributed generation systems. Iranian Journal of Electrical & Electronic Engineering 2007; 13: 31-41. [30]Guo A, W Chen, Q Li, Z Liu, H Que. Air flow control based
on optimal oxygen excess in fuel cells for vehicles. Journal of Modern Transportation 2013; 21: 79-85.