113 |
P a g e
IDENTIFYING LOCATION OF MAXIMUM INTERFACE
PRESSURE IN BEDRIDDEN PATIENT –A
COMPARATIVE STUDY
Sachin S. Shinde
1, Neela R. Rajhans
21
Assistant Professor, Department of Mechanical Engineering,
K.I.T.’s College of Engineering, Kolhapur-416234, (India)
2
Professor, Department of Production Engineering, College of Engineering, Pune-411005, (India)
ABSTRACT
Bedridden patients are more likely to develop Pressure Ulcers. Major contributing factor includes interface
pressure (IP) developed over bony prominences. To alleviate the IP, special purpose mattresses are used and to
check the efficacy of these mattresses maximum IP is best evaluation measure. The work is an attempt towards
identifying location of maximum IP first by hospital survey. Secondly by reaction board method and CONFORMat®
pressure mapping system. The significance between the location of center of mass and location of maximum IP were
tested by t-test. Total 40 subjects were considered for study. It is noted that location of center of mass by reaction
board and maximum IP on subjects were located approximately at same location. Center of mass and corresponding
IP for female subjects were at 53% of subject’s height where as for male subject it is at 57 % when subject is lying
on board in supine posture.
Keywords : Interface Pressure, Pressure Ulcer (Pus), Support Surface, Supine Posture.
I INTRODUCTION
Prolonged sleeping posture is one of the most fundamental activities of daily living for the disabled, aged and
paraplegic patients. For these people, who have limited mobility and impaired sensation, prolonged sleeping will be
highly risky and harmful. This will further create more critical problems like PUs, spasticity.
PUs are one of the most important medical problems in the western world, affecting millions of hospitalized
immobile patient, elderly patients in nursing homes and their families, suffering, in addition to increased work load
and requiring annual healthcare costs in order of billions dollar [1][2].
PUs occurs due to cell necrosis which is caused by unrelieved pressure and shearing forces on soft tissue overlying
bony prominence when patient lying on hospital bed. These two forces can interrupt the blood circulation to
underlying tissues. This results in oxygen deficiency in soft tissues and muscles. PU is difficult to cure, treat and is a
major cost factor in the health care system. Classical treatment of pressure ulcer prevention involves extended
periods of bed rest but which is believed to affect general condition of patient and further deterioration of the
114 |
P a g e
Since the discomfort of these pressure ulcers for the patients is enormous and the costs for treatment are high, theprevention of PUs is important. Prevention starts with using special materials for mattresses and sheets as well as
specially designed bed systems.
The primary cause of pressure ulcers is static IP applied to both the skin and underlying tissue. When this pressure is
greater than the blood pressure within the capillaries, blood flow is interrupted. Maintaining IPs below capillary
closing pressure (for example 32mmHg) is considered as standard for pressure relief [4].
IP is defined as the pressure distribution on the human tissue when it is compressed between bony prominences and
the supporting surface in sleeping posture. It has been extensively adopted to evaluate the occupant’s postural
behaviors and properties of the supporting surface.
Objective of this paper is to identify the location of maximum IP in bedridden patient and to check significance of
location of center of mass with the location of Maximum interface pressure.
II LITERATURE SURVEY
Prolonged sleeping behavior in bed due to surgery, injury to the spinal cord, or an illness cause’s immobility even
for less than a day, the pressure of the immobilized body on certain areas can break down the skin [5]. An early
study conducted by researcher examined nearly 20,000 residents of 51 nursing homes and found that 11.3 %
possessed a stage 2 or deeper pressure ulcer on admission and among those ulcer-free residents remaining in the
nursing home for 1 year, 13.2 % developed a new pressure ulcer [6].
PUs develops when patient skin is continuously exposed to a persisting external interface pressure of support surface
that is higher than capillary closing blood pressure. If this pressure is continued it can cause tissue necrosis [7].The
factors causing PU is complex phenomenon and according to various researchers, they mainly include the pressure
under bony prominences, shear forces, temperature, moisture, nutrition, seating position and daily life routine
[8-10]. Excessive pressure between human buttock and seating surface is generally recognized as the principal cause of
the occurrence of PUs [11]. IP involves mapping using sensors to quantify the pressure between two contacting
objects, such as a person and their support surface. It is commonly used by clinician and by researchers investigating
the surface, risk factors for ulceration and ulcer prevention protocol [12]. Frederick Shelton [13] compared different
surfaces for elderly people (65-70 years) mannequins with Tekscan 5315 system in his test. Inflated beds designed
to reduce pressure ulcers requires segmented air bags that alternately inflate and deflate to reduce IP [14]. To locate
these air bags we need to know the locations of PU developing areas. The sacrum, hips, spine, elbow, ears, shoulder
blades and heels are areas that can breakdown if point is kept in one position for long period of time as shown in
115 |
P a g e
Fig.1 Common Sites of Pressure Ulcers When Lying Down
III METHODOLOGY
3.1 Equipment Used
The reaction board used in this trial was wooden platform of 200 X 80 X 3 cm. electronic weighing scale and
CONFORMat® pressure mapping system a product by Tekscan Inc. The system includes hardware, software and
thin film pressure sensors (mats). The mats thinness enables the user to confidently incorporate the sensors in to the
application without altering the characteristics of the support. The combination of these factors enables precise
measurement of the location and magnitude of peak pressures and overall pressure distribution pattern.
3.2 Subjects
Forty subjects (20- Male and 20- Female) from healthy group were participated in the experiment. Initial data were
collected on admission to the trial.
3.3 Procedure
For this study static supine posture condition were being considered. Experiment is carried out firstly on the
116 |
P a g e
most vulnerable area of PU in bed bound patients. Secondly subjects were instructed to lie on reaction board to findthe location of center of mass and then location of maximum IP by using pressure mapping system.
Determination of the center of mass location of a body with respect to a reference axis of rotation involves four
steps:
1. A scale reading is taken when the reaction board is unloaded (R1).
2. Subject assumes the desired position on the reaction board.
3. A second scale reading is taken (R2) with the subject maintaining the desired position.
4. The Center of Mass location (x) with respect to the reference axis is calculated using equation 1.
(1)
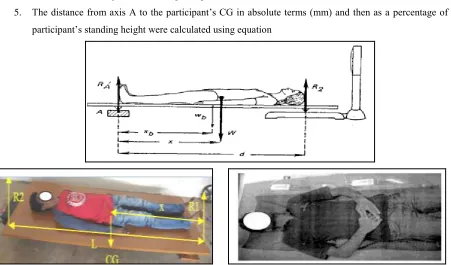
Procedural steps followed while collecting data are as follows
1. Accurate measure of height (h) and weight (W) using the same scale which will be used for the reaction
board for each subject.
2. Initial scale reading (R1) and the distance between the knife edges of the reaction board (d) were noted.
3. Participants were instructed to lie supine on the reaction board taking care to align the soles of the
participant’s feet with axis A (see Fig. 2).
4. Record scale reading, R2, while the participant lies on the board with arms at sides.
5. The distance from axis A to the participant’s CG in absolute terms (mm) and then as a percentage of the
participant’s standing height were calculated using equation
117 |
P a g e
Anthropometric data like Height, weight age and reactions on reaction boards for calculating center of mass weremeasured and collected through computer interface by using Ms Access form as shown in Fig. 3. Data collected
were tabulated as shown in TABLE NO.1 and TABLE NO.2
Fig.3: Data Collection Input Window.
Table1. Location of center of mass by using reaction board method
Male Subjects
Height in (cm)
Weight in (Kg.
Location of Center of Mass
(mm)
Female Subjects
Height in(cm)
Weight in (Kg.)
Location of Center of Mass (mm)
1 173 64.88 100.04 21 163 54.66 90.63
2 174 65.74 98.86 22 161 56.00 82.61
3 168 64.52 94.19 23 157 44.25 87.66
4 171 67.16 94.56 24 152 49.08 86.31
5 180 66.87 102.71 25 159 61.52 88.86
6 175 58.77 98.62 26 159 63.02 89.88
7 171 78.12 95.61 27 159 57.07 84.59
8 172 85.70 100.55 28 159 47.88 84.85
9 171 57.06 97.64 29 157 47.20 83.96
10 178 75.04 99.88 30 152 49.53 81.07
11 171 76.66 98.71 31 149 38.28 81.26
12 167 65.74 94.58 32 151 53.60 79.88
13 173 49.75 99.25 33 164 64.42 92.00
14 170 73.63 97.45 34 159 41.85 90.97
15 170 68.00 99.88 35 163 69.10 85.95
16 178 75.00 103.51 36 159 40.60 89.37
17 181 66.27 104.89 37 152 49.50 86.14
18 166 52.16 93.29 38 149 41.70 83.32
19 171 85.26 97.85 39 147 41.52 80.65
118 |
P a g e
Table2. Location of maximum interface pressure by using pressure mapping system
Male Subjects Height in (cm) Location of Max. IP (mm) Max. IP (mm of Hg)
Female Subjects Height in (cm) Location of Max. IP (mm) Max. IP (mm of Hg)
1 173 98.17 171 21 163 84.73 154
2 174 98.34 87 22 161 82.94 144
3 168 91.21 113 23 157 90.15 100
4 171 94.32 184 24 152 83.97 121
5 180 93.06 114 25 159 86.34 129
6 175 97.68 176 26 159 78.70 180
7 171 94.91 95 27 159 86.91 111
8 172 98.88 111 28 159 87.05 106
9 171 90.04 120 29 157 89.55 104
10 178 105.28 92 30 152 87.12 96
11 171 95.39 97 31 149 88.98 109
12 167 93.69 117 32 151 91.51 135
13 173 93.84 95 33 164 91.71 96
14 170 92.38 131 34 159 85.34 139
15 170 97.10 112 35 163 82.78 136
16 178 98.91 89 36 159 86.86 113
17 181 94.04 93 37 152 86.28 99
18 166 98.18 81 38 149 91.26 107
19 171 96.94 136 39 147 85.57 146
20 175 99.20 83 40 164 86.82 89
3.4 Statistical Analysis
After collecting the data for testing the significant relation between location of center of mass and location of
maximum IP hypothesis were formulated and significance were tested by using two tailed t-test with 0.05
significance level by using equation 2.
Null hypothesis Ho: µP = µR
Alternative hypothesis Ha: µP ≠ µR
Where µR = Average location of center of mass
µP = Average location of Maximum IP
SR = S.D. of locations of center of mass
119 |
P a g e
Results of t-test are shown in TABLE 3.Table3. Two tailed t- Test Results
t statistic = 0.478
µR = 92.20 SR = 7.26
µP = 91.49 SP = 5.74
t critical = –t 0.025, 39 is -2.0227 and t 0.025, 39 is 2.0227
d.f. = n-1 = 39
α = significance level = 0.05
For two tailed test from statistical table –t 0.025, 39 is -2.0227 and the critical value t0.025, 39 is 2.0227. Since
t-statistical is fall between these values we have accepted the null hypothesis H0: μP = μR in favor of the alternative
hypothesis HA: μP ≠ μR
Thus Average location of center of mass is equal to average location of maximum IP.
After determining the location of each person’s center of mass, the ratio of the center of mass to the height of each
person was calculated using formula x/h, and shown in Fig. 4 and Fig. 5. Where x is the location of the person’s
center of mass and h is the person’s height.
Fig. 4: Frequency of ratio of center of mass to Fig. 5: Frequency of ratio of center of mass to
height values obtained from the female subjects height values obtained from the male subjects
IV RESULTS AND DISCUSSION
4.1 Location of center of mass
1. Figure 2 and Table 1gives the actual location of center of mass measured by reaction board method. Average
120 |
P a g e
2. Figure 4 and 5 gives that ratio of center of mass to height values for female and male subjects. It was noted thatMales and females have different centers of mass females' centers of mass are lower than those of males. The
average ratio of center of mass to height in females is approximately 0.53 and the average ratio of center of mass
to height in males is approximately 0.57
4.2 Location of maximum IP
From Table 2 it was calculated that average location of maximum IP was (x = 91.49cm)
And from t –test it is tested that average location of maximum IP will locate at same location as that of average
location of center of mass i.e test is significant.
V CONCLUSION
From this study it is clear that maximum interface pressure due to person’s center of mass is slightly below his/her
belly button i.e. at sacrum. Maximum Interface pressures noted at sacrum in male subjects were in the range of 83 -
184 mmHg and in female subjects were in the range of 89- 180 mmHg.
It was also noted that Males and females have different centers of mass females' centers of mass are lower than those
of males. The average ratio of center of mass to height in females is approximately 0.53 and the average ratio of
center of mass to height in males is approximately 0.57.
Also it is understood that Pressure redistributing support surfaces, designed to prevent and treat pressure ulceration
are generally based on location and magnitude of IP. The outcomes of this study will help the researchers as well as
designers for designing personalized support surface and checking the efficacy of support surfaces to reduce PUs.
REFERENCES
[1] D. Bader, et al., Pressure ulcer research-current and, future perspectives, Berling: Springer, 2005, 382.
[2] European pressure Ulcer Advisory Panel (EPUAP). Updated staging system, 4(1), 2002. Available from:
http://www.epuap.org./pr2.htm; [accessed 5th Nov 2011]
[3] H. Brem and, C. Lyder, Protocol for the successful treatment of pressure ulcers, The American Journal of
Surgery, 188(1S1),2004, 9-17,.
[4] Krasner, Rodeheaver, Sibbald , Chronic Wound Care Third Edition 2001, 620.
[5] J. Franks, Bedsores and Personal Care Services, Article Updated April 2013. Available from:
http://www.aplaceformom.com/senior-care-resources/articles/bedsores;, [accessed 10th Nov 2014]
[6] G.Brandeis, J. Morris, D. Nash, L. Lipsitz , The epidemiology and natural history of pressure ulcers in elderly
nursing home residents, JAMA ;264, 1990, 2905–9.
[7] D. Brienza, et al., The relationship between pressure ulcer incidence and buttock-seat cushion interface
pressure in at-risk elderly wheelchair users, Arch Phys Med Rehabil, 82(4), 2001,529-33.
[8] E. Guimaraes, and W. Mann, Evaluation of pressure and durability of a low-cost wheelchair cushion
designed for developing countries, Int J Rehabil Res, 26(2), 2003, 141-3.
[9] A. Gefen, Risk factors for a pressure-related deep tissue injury: a theoretical model, Med Biol Eng Comput,
121 |
P a g e
[10] Baldwin,et. al., Damage control: Preventing and treating pressure ulcers, Nursing Made Incredibly Easy!,4(1), 2006, 12-26.
[11] M. Inhyuk, Control of air-cell mattress for preventing pressure ulcer based on approximate anthropometric
model, In Procedding of the 2005 IEEE, 9th International Conference on Rehabilation Robotics, USA.
[12] G.Webster , A pressure mat for preventing pressure sores, In IEEE Engineering in Medicine and Biology
Society 11th International Conference 1989, 1479.
[13] F. Shelton, Full – body interface pressure testing as a method for performance evaluation of clinical support
surface, In Applied Ergonomics, 29 (6),1998, 491 – 497.