Polarization measurements through a standard single mode fiber for
imaging and remote characterization
J. Desroches, D. Pagnoux, A. Barthélémy, F. Louradour
Université de Limoges, Centre National de la RechercheScientifique, Xlim/Photonics Dpt, 123 av. Albert Thomas, 87060 Limoges cedex, France
Abstract. We report on a polarization imaging device which probes a remote sample through a flexible standard single-mode fiber. Both polarized laser source and polarization analysis system are set on one side of the fiber, the object of interest being probed by the beam exiting at the opposite end. Phase retardation and polarization rotation angle due to either pure linear or pure circular birefringent targets can be measured. In addition, the degree of polarization of partially depolarizing targets is evaluated. The measurement method is based on two key points: (i) the compensation of the fiber birefringence effects over a round trip of the light by means of a miniaturized Faraday rotator set between the output fiber end and the target, (ii) the recording of a set of data operated when the polarization states of the light at the fiber input are varied, followed by a specific processing of these data. An experimental setup based on this process has been implemented. The method was assessed using calibrated birefringent targets, and polarization images of a large variety of targets were obtained.
1 Introduction
In general, polarimetry consists in the measurement of the changes in the optical field vector after transmission, reflection or backscattering by a scene or an object of interest (target). Based on polarimetry, polarization imaging techniques have been demonstrated to be powerful tools for indirect non destructive characterization of materials, as they provide informations on their surface and subsurface texture at the submicronic scale [1]. Among the existing techniques, more or less sophisticated,, measurement of the birefringence of the target and measurement of the degree of polarization (DOP) of the reflected light have attracted a lot of interest, in particular in biology where they were used for the characterisation of fibrillar tissues such as type I collagen [2-4].
So far, all the polarization imaging techniques reported in the literature, even the simplest ones, require a precise knowledge of the polarization states of the beam which probes the target and of the light which is reflected by this target. Therefore, the insertion of a standard optical fiber between the source/detection system assembly and the target is not possible because the polarization state of the guided light is modified in an unknown manner all along the propagation in the fiber, on both the forward and backward way, due to the unavoidable intrinsic and extrinsic birefringence of the guide. Furthermore, the extrinsic birefringence may
experience changes when manipulating the fiber. Thus, the overall birefringence of the fiber is likely to be time dependent in actual operating conditions, inducing uncontrolled variations of the polarization state at the output, even if the polarization state at the input remains unchanged. It is worth noticing that a polarization maintaining fiber can preserve the polarization state of a beam, only if it is linearly polarized in a direction parallel to one of the fiber neutral axis. In other words, even a polarization maintaining fiber does not allow determining the polarization state of an input field from measurements of the output radiation, in the more general situation.
The result of the above considerations is that targets to be characterized by polarization techniques must be directly accessible by the probe beam in free space. This constitutes a major drawback for many applications. In particular, in the bio-medical domain, in-vivo and in-situ
polarization imaging of internal tissues is most of the time not possible, making biopsies necessary.
In this paper, we present a novel scheme allowing to perform polarization imaging through a flexible optical fiber. We first present the principle of the method imagined to reach this goal, and some results of numerical simulations achieved to validate this principle are reported. Then we describe the setup that we have implemented. Finally, we show and discuss some polarization images of targets which have been obtained with this device.
© Owned by the authors, published by EDP Sciences, 2010
2 Principle of the method and numerical
validation
Optical fiber
Faraday rotator Target
Polarization analysis device
Input
beam (Ei) Beam to beanalyzed (E
s)
Probe beam (with unknown and varied polarizations states)
Linearly polarized source
Optical fiber
Faraday rotator Faraday
rotator Target
Target
Polarization analysis device
Polarization analysis device
Input
beam (Ei) Beam to beanalyzed (E
s)
Probe beam (with unknown and varied polarizations states)
Linearly polarized source
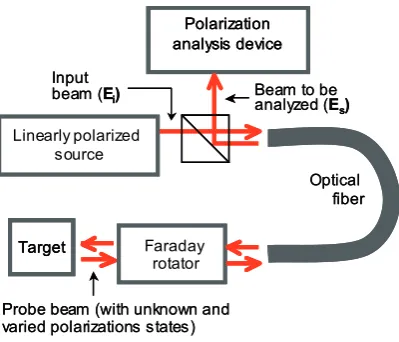
Fig. 1. Schematics of the principle of the method
Let us consider a remote polarization imaging system involving a standard single mode fiber. Both light source and detection-analysis system are set on one side of the fiber (called "proximal side"), the target to be characterized facing the opposite side of the fiber (called the "distal side"), as shown in the schematic of Figure 1. The target is assumed to be free of diattenuation, as it is generally the case for fibrillar tissues.
The principle of the method is based on (i) the cancellation of the effects of the fiber birefringence over a round trip of the light, (ii) and on a specific polarization analysis of the back guided beam, the target being probed by various polarization states. This method is depicted below.
The beam from a laser source which is launched into the fiber is linearly polarized (electric field Ei). In order
to fulfill the condition (i), light from the distal fiber output passes, on both its back and forth path, through a Faraday rotator inserted between the endface and the target. This non reciprocal component rotates the polarization state of the light from the fiber by a first 45° angle, and rotates the polarization state of the light from the target by another 45° angle, in the same direction in the laboratory system. Thus, it performs a passive self-compensation of the fiber birefringence on a round trip, like in Faraday mirror configuration which is encountered for instance in fiber lasers or quantum cryptography [5,6]. Finally, the beam is guided back to the input end (electric field ES) and is analysed by a polarization analysis device
(PAD) which will be further described. The aim of this device is to deduce the effect of the target on the probing beam (i.e. phase retardation due to linear birefringence, polarization rotation due to circular birefringence and/or partial depolarization) from the polarization state of the analysed beam.
A very simple case is that of a non birefringent non depolarizing target. Such a target preserves the
polarization state of the incoming light, as a mirror does, and the polarization state analysed by the PAD is linearly polarized in the direction perpendicular to that of the input field Ei, whatever the fiber birefringence. In other
words, the detection of an unvariable polarization state perpendicular to that of the input field is the signature of a non birefringent target. However, in the most general case of a birefringent target, the polarization state of the light is modified between its two paths through the Faraday rotator. In that case, the polarization state which is analysed by the PAD depends not only on the searched target response, but also on the unknown polarisation state incoming on this target.
The Jones formalism was used in order to establish a connection between the analysed polarization states and the target effects. As developed in [7], the Jones vector
S
EJJG describing the output field after a round trip in the complete de ice is given by [8]: v
i
s D
E
JJG
J .E
JJG
(1)where Ei
JJG
describes the linearly polarized electric field at
the input (
E
JJG
iE .i
iJG
// andJJG
E
sE .i
s //JG
//E .i
sA AJG
). JD isthe Jones matrix that represents the overall contribution of the different elements along the light path. It is calculated as the product of the matrices describing the various elements: JD=J’F.JR.JT.JR.JF, where JF stands for
the fiber piece, JR for the Faraday rotator, and JT for the
target response. The fiber is a non ideal waveguide likely to be affected by both intrinsic and extrinsic birefringence.
For a fixed wavelength, the fiber can be considered as a series of linearly birefringent elements with phase retardations Micombined with circularly birefringent
elements giving rotations of angles Ni of the polarisation
states. Thus JF can be expressed by
F i i
i 1,n
J
J .J
M N where JMi and JNi are Jones matriceswhich represent such a linearly birefringent element and a circularly birefringent element, respectively. On the way back, the matrix of these elements becomes J'F expressed
by F i i
i n,1
J '
J
N.J
M . Both parameters Mi and Ni areunknown parameters, likeky to vary in time. The behaviour of the Faraday rotator is represented by JR, a
Jones matrix of +45° rotation.
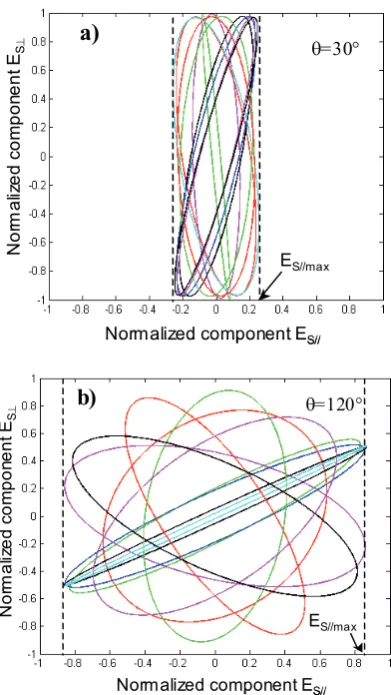
The target is first assumed to be a purely linearly birefringent element inducing a phase retardation T between its birefringence main axes, T being the parameter to be determined. We show in Figure 2 some examples of polarization states at the output, computed for two given values of T (T= 30° and T= 120°), and for various random selections of Mi and Ni. As expected, the
polarisation state at the output depends on the fiber birefringence but it can be noticed that the amplitude of the normalised component ES// always falls between 0 and
a maximum value ES//max=sin(T/2) for 0<T<2S. Thus, the
Fig. 2. Polarization states after one round trip in the device, for a fiber with varied birefringence (randomly selected retardations and rotations) and a linearly birefringent target introducing a phase retardation T. a) T=30° ;b) T=120°
practical conditions, we can only measure the intensities of the components respectively parallel and perpendicular to the input polarization (I//vES//2 and
2 S
IAvE A).
Kl-max, which is the maximum reachable value of the
parameter //
//
I K
IAI is given by Kl-max =sin
2
(T), and
T can be deduced from its measurement.
Figure 3 is a histogram showing the distribution of the values of K computed for given phase retardations of the target and for 1000 random selections of the parameters
Mi and Ni (i.e. random birefringence of the fiber). In this
example, phase retardations T1 = 78.5° and T 134° have
been chosen, corresponding to expected values of Kl-max
=0.4 and 0.85 respectively. First of all, these calculations confirm that no value of K are found greater than sin2(T). In addition, more than 20% of the values are within the range [sin2(T)-0.05 , sin2(T)], i.e. very close
to Kl-max. This assertion is confirmed by further
calculations which show that the discrepancy between K and sin2(T) is lower than 5% for more than 35% of the
350
250 300
200 150
100
50
0
0 0.1 0.2 0.3 0.4 0.5 0.6 0.7 0.8 0.9 1.
number of acquisitions
ki
sin2(T
) = sin2(T) = 0.85
T= 78.5°
T= 134°
Phase retardation
350
250 300
200 150
100
50
0 350
250 300
200 150
100
50
0
0 0.1 0.2 0.3 0.4 0.5 0.6 0.7 0.8 0.9 1. 0 0.1 0.2 0.3 0.4 0.5 0.6 0.7 0.8 0.9 1.
number of acquisitions
ki
sin2(T
) = sin2(T) = 0.85
T= 78.5°
T= 134°
Phase retardation
Normalized component ES//
No
rm
al
iz
e
d
c
o
m
p
on
e
n
t
ES
A
ES//max
T=30°
a)
Normalized component ES//
No
rm
al
iz
e
d
c
o
m
p
on
e
n
t
ES
A
ES//max
T=30°
a)
Fig. 3. Histograms showing the distribution of 1000 K values computed for phase retardations equal to 78.5° and 134°. For each calculation the birefringence of the fiber is randomly selected through random parameters Mi and Ni .
N
o
rm
a
liz
e
d
c
o
m
p
on
ent
E
S
A
Normalized component ES// ES//max
T=120°
b)
N
o
rm
a
liz
e
d
c
o
m
p
on
ent
E
S
A
Normalized component ES// ES//max
T=120°
b)
calculated K values, whatever the considered phaseretardation within [0, 2S]. We have also verified that, for each T, max(K) obtained with only 20 selections of the random parameters is found to be equal to sin2(T) with an accuracy better than 1%. In practice, this allows a quick and accurate experimental determination of T through the measurement of max(K) over no more than 20 acquisitions.
The same calculations have been carried out considering a circularly birefringent target inducing a rotation of the incoming polarization state by an angle U. In this case the component ES// of the analysed field is
found to be comprised between 0 and a maximum value equal to sin(U). Thus Kc-max which is the maximum
reachable value of the parameter K is Kc-max=sin2(U). We
also verified that, as for the linearly birefringent target, max(K) reaches Kc-max with an accuracy better than 1%
with only 20 selections of the random parameters. A linearly birefringent target with a phase retardation
T and a circularly birefringent target with a rotation angle U T are then characterized by the same value of Kmax. Figure 4 is a comparison of histograms showing the
distribution of the K values in such a case. Two pairs of birefringences are considered : (T =78° ; U= 39°) and (T =134° ; U= 67°). The two corresponding histograms
show that the distributions of the K values are significantly different for the linearly birefringent target and the circularly birefringent target. In particular, the fraction of the K values having a discrepancy with Kmax
400 350
250
150 300
50 200
100
0
(xKm ax)
phase retardation T=78° rotation U=39°
a)
0.1 0.2 0.3 0.4 0.5 0.6 0.7 0.8 0.9 0
Kmax= 0.4
number of acquisitions
400 350
250
150 300
50 200
100
0 400 350
250
150 300
50 200
100
0
(xKm ax)
(xKm ax)
phase retardation T=78° rotation U=39° phase retardation T=78° rotation U=39° phase retardation T=78° rotation U=39°
a)
0.1 0.2 0.3 0.4 0.5 0.6 0.7 0.8 0.9 0 0.1 0.2 0.3 0.4 0.5 0.6 0.7 0.8 0.9 0
Kmax= 0.4
number of acquisitions
(xKmax)
0.1 0.2 0.3 0.4 0.5 0.6 0.7 0.8 0.9 0
350
250
150 300
50 200
100
0
Kmax= 0.85
phase retardation T=134° rotation U=67°
b)
number of acquisitions
(xKmax)
0.1 0.2 0.3 0.4 0.5 0.6 0.7 0.8 0.9 0 0.1 0.2 0.3 0.4 0.5 0.6 0.7 0.8 0.9 0
350
250
150 300
50 200
100
0 350
250
150 300
50 200
100
0
Kmax= 0.85
phase retardation T=134° rotation U=67°
phase retardation T=134° rotation U=67°
phase retardation T=134° rotation U=67°
b)
number of acquisitions
Fig. 4. Histograms showing the distribution of 1000 K values for linearly birefringent targets (phase retardation T and circularly birefringent targets (rotation U) associated to the same value of Kmax. a) T=78° and U=39° (Kmax=0.4) ; b) T=134° and U=67° (Kmax=0.85)
In the case of a partially depolarizing birefringent target, the intensity I of the back guided light is the sum of the contributions of the polarized part Ipol and of the
depolarized part Idepol. Each quantity can be expanded
into its linearly polarized components: and
pol pol pol I I
I // A Idepol I//depolIAdepol, with
2
//depol I depol Idepol
I A . In that case, the minimum
attainable value of K, noted Kmin, is reached when
, leading to 0
//pol
I min 2 z0
depol pol depol
I I I
K .
The DOP of the analysed beam is thus equal to D=1-2Kmin. The effect of the target birefringence (i.e. phase
retardance or rotation) must be calculated by considering only the polarized part of the light in the expression of the parameter K which becomes
AA
I I K I
K K I K
// min min
min //
min 1 1 2 . T or
U are now given by sin2(T)=K'max or sin2(U)=K'max,
depending on the considered target, where K'max is the
maximum attainable value of K'.
3 Experimental setup
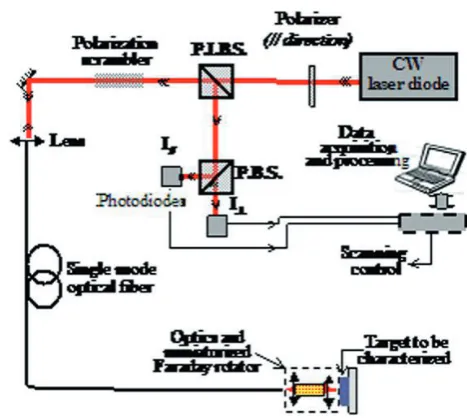
Fig. 5. Experimental setup (PIBS = polarization insensitive beam splitter ; PBS = Polarization beam splitter)
The experimental set-up is described in Figure 5. A linearly polarized beam from a CW laser diode (O= 830nm) crosses a polarization insensitive beam splitter (PIBS) and then a polarization scrambler before being launched in a 2 meters long standard single mode fiber (Oc=750nm) The beam exiting at the distal fiber end is
first collimated before passing through the miniaturized Faraday rotator, and is then focused onto the target under study. Part of the light that is backscattered by the target is collected by the focusing lens and coupled back into the fiber, after a second pass through the Faraday rotator. The backscattered radiation is guided up to the proximal face of the fiber where the exiting beam is sent to a polarization analysing device (PAD) by means of the PIBS. The PAD consists in a polarization beam splitter (PBS) and two detectors measuring the optical intensities I// and IA.
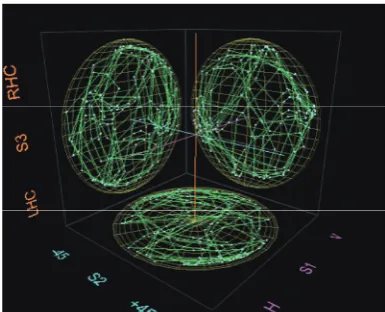
In order to implement the method, a set of parameter K should be measured and recorded when randomly changing the polarization state of the beam probing the target. This can be done by varying the birefringence of the fiber, for example by means of variable stress. A more convenient alternative consists in changing the polarization state of the light at the input end of the unperturbed fiber during the measurements. This can be achieved by means of an electrically driven polarization scrambler. In a very first implementation of the method, we simply used an assembly of two desynchronized rotating phase plates (O/2 and O/4 respectively).
Fig. 6. Polarization states of the probing beam represented on the Poincaré sphere, showing their evolution in time during one period of the polarization scrambler. Each figure is a projection of the path on the sphere, in a plane defined by the Stokes vectors Si and Sj (i,j = 1,3 and izj)
0 0.2 0.4 0.6 0.8 1
0 60 120 180 240 300 360
Phase retardation T(degree)
m
ax(
K
)
measurements (50 acquisitions) sin2(T/2)
0 0.2 0.4 0.6 0.8 1
0 0.2 0.4 0.6 0.8 1
0 60 120 180 240 300 360
0 60 120 180 240 300 360
Phase retardation T(degree)
m
ax(
K
)
measurements (50 acquisitions) sin2(T/2)
Fig. 7. Maximum value of K extracted with the PAD from a set of 50 successive acquisitions when varying the polarization state of the probing beam by means of the polarization scrambler, versus the phase delay T chosen on a Babinet-Soleil compensator (circles) ; Kmax = sin2(T) (solid line)
The path covers the sphere quite uniformly, indicating that the target is probed by a large variety of polarization states, as expected.
For assessing the method, we used a calibrated birefringent target consisting in a Babinet-Soleil compensator (BSC) followed by a mirror. The analyzed beam is not depolarized by this target. In accordance, min(K) was found to be 0 (i.e. DOP=1), whatever the position of the BSC, and K'=K. Then, we have plotted in Figure 7 the curve of max(K) versus T, each max(K) being determined from a set of 50 acquisitions of K. For each T in the range [0, 2S], max (K) is in very good agreement with the expected value Kmax = sin2(T).
Finally we performed images of different birefringent targets, with the proposed imaging setup. In this very first implementation we used a single optical fiber and moved the target in the focal plane of the probe beam. For each pixel of the image, the polarization states of the probe beam were rapidly varied by means of the polarization scrambler and the minimum and maximum values of K' among 20 acquisitions were recorded. Obviously, in a more advanced and operational version, the target must be fixed and must be scanned by appropriate existing
devices, located on the distal side: piezoelectric driven resonant oscillation of a fiber cantilever [9] or MEMS scanning mirrors [10], for example. A fiber bundle made of thousands of optical cores associated to standard proximal scanning could also be used [11].
4 Description of some polarization
images performed with the setup
A first target was made of two layers of transparent non depolarising linearly birefringent films which were partially superimposed on a metallic support, with their fast axis either parallel (Figures 8a and 8b) or perpendicular (Figures 8c and 7d). Figures 8a and 8b are classical intensity images of the targets where the film layers are not easily discernible and where no information on the relative orientation of the neutral axis can be obtained. On the contrary, the film layers appear with a strong contrast in the polarization images performed with our experimental setup (Figures 8c and 8d). In these images, the background metallic plate which behaves like a mirror neutral towards polarization. As predicted, it is associated to measured max(K'), denoted K'max_mes, = 0
(external black zones). On the one hand, when the fast axes of the superimposed layers are parallel, the phase retardation is twice that of a unique layer, resulting in a corresponding increase of K'max_mes (blue region of
Figure 8c). On the other hand, the superposition of two layers with their perpendicular fast axes leads to the cancellation of the overall phase retardation and the value of K'max_mes is zero (black central region of Figure 8d). Fig. 8. Images of transparent birefringent films on a metallic plate (5mm X 3mm, résolution = 20μm). Stack of two superimposed films with their fast axes parallel (left column), perpendicular (right column) ; intensity images (upper row) ; polarization images (lower row)
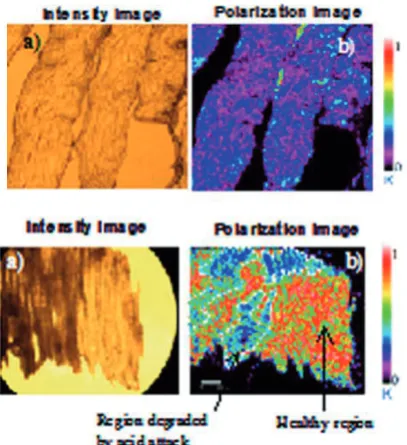
Fig. 10. Intensity (a) and polarization (b) image of a pig tendon sample degraded by chemical attack (5mm X 3mm, resolution : 20μm)
Then we realized images of biological tissues samples. Figure 9 displays images of a rat tendon sample prepared with a microtome in order to obtain a constant thickness. Figure 9a is an intensity image where one can distinguish the fibrillar structure of the tissue, essentially constituted of birefringent type I collagen fibrils. The corresponding polarization image of Figure 9b, confirms that the sample is birefringent and that it introduces a quite uniform phase retardation, measured through a quasi constant K'max_mes value ((K'max-mesa 0.2). Let us
note that min(K') is found to be a0 over the whole sample, denoting that the sample introduced no depolarisation of the probe beam, probably because of its very small thickness.
We also performed images of a pig tendon sample, parts of which being degraded by means of preliminary chemical attack with sulfuric acid drops. In the polarization image depicted Figure 10b, one can clearly see two types of zones which have been delimited by dotted lines on the figure. Red regions corresponding to high K'max_mes are regions with higher birefringence,
signature of an organized fibrillar structure. Regions with lower K'max_mes (blue zones) exhibit lower birefringence,
which indicates that the collagen fibrillar structure has been degraded. On the contrary, in the corresponding intensity image (Figure 10a) the healthy zones and the degraded zones cannot be easily discriminated.
5 Conclusion
In this paper, we describe and analyse a novel technique making polarization imaging compatible with endoscopy. That is of interest in particular for in-vivo in-situ
polarization imaging of internal body tissues and for early diagnosis of diseases. In this new scheme, linear or circular birefringence of materials and degree of
polarization of reflected light can be separately measured through a flexible optical fiber. The uncontrolled birefringence of the optical waveguide is compensated thanks to a small-size Faraday rotator and the polarization effect of the target is recovered by means of specific data processing. The method was validated using a calibrated birefringent target. Then polarization images of transparent birefringent films were performed and discussed. Preliminary images of biological tissues (rat tail tendon and pig tail tendon) were also successfully carried out.
The authors are very grateful to Mireille Verdier and Julien Brevier for providing and preparing the biological samples, and for helpful discussions on their structure. Jérôme Desroches acknowledges the Région Limousin for his PhD scholarship.
References
1. J. Scott Tyo, D.L. Goldstein, D.B. Chenault, J.A. Shaw, App. Opt., 45, 5453-5469, (2006)
2. S.L. Jacques, J.C. Ramella-Roman, K. Lee, J Biomed Optic, 7, 329-340, (2002)
3. D. Chan, B. Schultz, K. Gloystein, H.H. Müller, M. Rübhausen, J. Biomed. Opt., 12, 1, 014023 (2007) 4. M. Anastasiadou, A. De Martino, D. Clément, F.
Liège, B. Laude-Boulesteix, N. Quang, J. Dreyfuss, B. Huynh, A. Nazac, L. Schwartz, H. Cohen, Phys. Stat. Sol., 5, 1423-1426, (2008)
5. M.E. Fermann, L.M. Yang, M.L. Stock, M.J. Andrejco, Opt. Lett., 19, 43-46 (1994)
6. A. Muller, T. Herzog, B. Huttner, W. Tittel, H. Zbinden, N. Gisin, Appl. Phys. Lett., 70, 793-795 (1997)
7.
J. Desroches, D. Pagnoux, F. Louradour, A. Barthélémy, Opt. Let., 34, 3409-3411, (2009)8.
E. Hecht, Optics4th edition, (Addison-Wesley 2003) 9. M.T. Myaing, D.J. MacDonald, X. Li, Opt. Lett., 31,1076-1078, (2006)
10. W. Piyawattanametha, R.P.J.Barretto, T.H. Ko, B.A. Flusberg, E.D. Cocker, H. Ra, D. Lee, O. Solgaard, M.J. Schnitzer, Opt. Lett., 31, 2018-2020, (2006) 11. M. Davenne, C.Custody, P. Charneau, P.M. Lledo,