© 2017 IJSRST | Volume 3 | Issue 7 | Print ISSN: 2395-6011 | Online ISSN: 2395-602X Themed Section: Science and Technology
A Complementary Review of Data-based Clustering Model
and Data Analysis for Gene Expressions
K L V G K Murthy#1, Dr. R. J. Rama Sree*2
#1
CSE Department, St. Marys Group of Institutions, Guntur, Research Scholar of Rayalaseema University, Kurnool, India
*2Professor&Head, Department of Computer Science, Rashtriya Sanskrit Vidya Peeth, Tirupathi,
Research supervisor for Rayalaseema University,Kurnool, India
ABSTRACT
Current microarray technology provides ways in which to get time-series expression knowledge for learning a large vary of biological systems. However, the expression knowledge tends to contain respectable noise that as a result might deteriorate the clustering quality. We tend to propose a knowledge-based clustering technique to include the information of gene-gene relations into the clustering procedure. Our technique first obtains the biological roles of every gene through a web mining process, next to teams genes supported their biological roles and also the gene ontology, and last applies a semi-supervised clustering model wherever the oversight is provided by the detected gene groups. Under the steerage of the information, the clustering procedure is able to address knowledge noise. We tend to evaluate our technique on an in public offered data set of human fibroblast response to serum. The experimental results demonstrate improved quality of clustering compared to the clustering strategies without any previous knowledge.
Keywords : Microarray Technology; Clustering; Data Analysis Gene Expression.
I.
INTRODUCTION
Clustering genes into groups with similar behaviour is one of the key processes for time series gene expression data analysis, which provides a way to examine the deferent patterns of gene modules and study unknown genes based on known genes of the same group. A number of existing approaches are available to cluster time series gene expression data such as HAC [5, 13, 9], k-means [12], SVD and HMM [10]. However, these approaches construct models merely from the gene expression data, in which considerable data noise might be present due to the experiment design and may deteriorate the clustering quality.
Gene Expression
Gene expression is the process by which information from a gene is used in the synthesis of a functional gene product. These products are often proteins, but in non-protein coding genes such as transfer RNA (tRNA) or small nuclear RNA (snRNA) genes, the product is a functional RNA.
The process of gene expression is used by all known life—eukaryotes (including multicellular organisms), prokaryotes (bacteria and archaea), and utilized by viruses—to generate the macromolecular machinery for life.
Several steps in the gene expression process may be modulated, including the transcription, RNA splicing, translation, and post-translational modification of a protein. Gene regulation gives the cell control over structure and function, and is the basis for cellular differentiation, morphogenesis and the versatility and adaptability of any organism. Also it depends on the state of activator RNA. Gene regulation may also serve as a substrate for evolutionary change, since control of the timing, location, and amount of gene expression can have a profound effect on the functions (actions) of the gene in a cell or in a multicellular organism.
Such phenotypes are often expressed by the synthesis of proteins that control the organism's shape, or that act as enzymes catalysing specific metabolic pathways characterizing the organism. Regulation of gene expression is thus critical to an organism's development [1]
DNA Microarrays and Protein to Protein Interaction (PPI). A gene is a stretch of DNA that encodes information. Genomic DNA consists of two anti parallel and reverse complementary strands, each having 5' and 3' ends. With respect to a gene, the two strands may be labeled the "template strand," which serves as a blueprint for the production of an RNA transcript, and the "coding strand," which includes the DNA version of the transcript sequence. Several steps in the gene expression process may be modulated, including the transcription, RNA splicing, translation, and post-translational modification of a protein. Gene regulation gives the cell control over structure and function, and is the basis for cellular differentiation, morphogenesis and the versatility and adaptability of any organism.
Gene expression is the process by which information from a gene is used in the synthesis of a functional gene product. These products are often proteins. The process of gene expression is used by all known life eukaryotes
(including multicellular organisms), prokaryotes
(bacteria and archaea), and utilized by viruses to generate the macromolecular machinery for life.
1.1 DNA Microarray Technique
A DNA microarray (also commonly known as DNA chip or biochip) is a collection of microscopic DNA spots attached to a solid surface. Scientists use DNA microarrays to measure the expression levels of large numbers of genes simultaneously or to genotype multiple regions of a genome. Each DNA spot contains picomoles (10−12 moles) of a specific DNA sequence, known as probes (or reporters or oligos). These can be a short section of a gene or other DNA element that are used to hybridize a cDNA or cRNA (also called
anti-sense RNA) sample (called target) under high-stringency conditions. Probe-target hybridization is usually detected and quantified by detection of fluorophore-, silver-, or chemilumine science-labeled targets to determine relative abundance of nucleic acid sequences in the target. The original nucleic acid arrays were macro arrays approximately 9 cm × 12 cm and the first computerized image based analysis was published in 1981. [2]
An array is an orderly arrangement of samples where matching of known and unknown DNA samples is done based on base pairing rules. An array experiment makes use of common assay systems such as micro plates or standard blotting membranes. The sample spot sizes are typically less than 200 microns in diameter usually contain thousands of spots.
Thousands of spotted samples known as probes (with known identity) are immobilized on a solid support (a microscope glass slides or silicon chips or nylon membrane). The spots can be DNA, cDNA, or
oligonucleotides. These are used to determine
complementary binding of the unknown sequences thus allowing parallel analysis for gene expression and gene discovery. An experiment with a single DNA chip can
provide information on thousands of genes
simultaneously. An orderly arrangement of the probes on the support is important as the location of each spot on the array is used for the identification of a gene. The DNA Micro array structure is as follows.
networks greatly increase the challenges of comprehending and interpreting the resulting mass of data, which often consists of millions of measurements.
Gene Ontology (GO, http://www.geneontology.org/) provides standard terminology for biological processes and constructs a hierarchical structure of these biological processes. Figure 1 shows a fragment of the ontology structure defined by GO. If the biological processes of some genes can be determined, the relation-ship among these genes can be detected based on the relationship among their biological processes defined by GO. For
example, if both gene A and gene B are involved in the
\regulation of cell proliferation", they are likely to be in one group. And, these gene-gene relationships can be further incorporated into clustering models. Thus we design a web-knowledge-based clustering model to retrieve the biological processes of genes from the web and further help clustering. Current DNA microarray technology provides ways to conduct large-scale experiments in a wide range of biological systems. Many problems such as biological interpretation, disease development and drug discovery can thus be further studied by analyzing the data generated from the
experiments. The microarray data consists of expression
levels of many genes over a set of consecutive time points, also referred as time series (or time course) gene expression data. The expression data allow scientists to examine the gene expression changes over time and obtain more discoveries regarding to the time course.
Many believe that genes in the same cluster have similar biological roles [5, 13]. Here, a biological role is formally described as the biological process associated with a gene. Their results [5, 13] also illustrated that this knowledge about genes can be inferred from the clustering results. For example, gene KITLG is involved in the “cell proliferation" process. If another gene is in the same cluster as KITLG, then that gene is also likely to be involved in “cell proliferation". Inspired from this fact, we and other [3, 6, 1] believe that if one can find the biological processes associated with the genes and the relations among the processes, then this type of prior knowledge can be used to guide the clustering process in order to generate more meaningful clusters.
Figure 3. Cell Proliferation
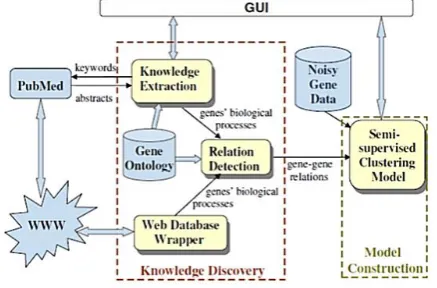
Our model (shown in Figure 3) starts with a web knowledge discovery process mining genes' biological processes from web gene databases and specialized web search engines. The gene-gene relationships are then detected by examining relationships among genes' biological processes based on GO. Finally, it applies a semi-supervised clustering model where the supervision is provided by the detected gene-gene relationships. We evaluate our approach on a time series data set of human fbroblast response to serum provided by [7]. The results show that our knowledge-based clustering model generates clusters of better quality compared to the original clustering model without any prior knowledge.
Some papers such as [8] aim at predicting biological processes for unknown genes, and thus classify time series gene expression data based on GO annotations. Our work aims to analyze any type of gene expression data, and the biological processes are only used as the supplementary knowledge to improve clustering for
further research. Some other knowledge-guided
clustering methods [3, 6, and 1] are available. Our approach is deferent at the following two aspects 1) we acquire knowledge from PubMed articles instead of solely relying on the knowledge from the gene information databases. Compared to the latter, the former.
Figure 4. Implementation architecture of web-knowledge-based clustering model for gene expression
Serves as a complementary source and may contain more up-to-date information about genes; 2) in our framework, the supervision on clustering combines both constraints and distance learning.
II.
Web-knowledge-based Clustering Model
Our web-knowledge-based clustering model, involves two processes: a web knowledge discovery process and a semi-supervised clustering process. The gene-gene relations are obtained from the extracted knowledge through the first process, and further serve as an input for the clustering process.
2.1 Web Knowledge Discovery of Gene-gene
relations
Two types of web sources are available to extract the biological process of known genes: web gene databases and web biological documents.
Extract Biological Processes from Web Gene Databases Many web gene databases provide GO annotations for known genes, i.e., they list the biological processes and other properties of known genes in GO terms. One can query on gene names or gene symbols to obtain their biological processes. In addition, such gene information is usually given in a format, which eases the automatic biological process extraction. An example of such a web database is Entrez Gene1, which is used as the source for finding GO annotations. A web page wrapper is built to extract biological process information from Entrez Gene. For simplicity, hand-crafted rules are used for the wrapper of Entrez Gene via observation. Applying a well-developed information extraction system such as WHISK [11] with a number of training examples to build the wrapper is another option, which can make our approach more general for any web gene information databases.
Extract Biological Process from Web Biological Documents Besides the web gene databases, we extract the biological processes of genes through specialized search engines. PubMed2, an Entrez search engine on biomedical documents, is used here. Gene symbols serve as keywords for searching, and the abstracts of the search results are analyzed for biological process extraction.
We select the sentence co-occurrence method as our extraction method; because it achieves balanced precision and recall compared to the other two methods, namely, sentence classfication and abstract co-occurrence [4]. Sentence classification gives the highest precision but the lowest recall and abstract co-occurrence gives the highest recall but the lowest precision. We also seek ways to improve the precision of the sentence co-occurrence method. For example, stemming and word distance are used to obtain higher extraction accuracy.
We analyze each sentence of the text documents. For each biological process p in GO, we determine if the sentence s contains p for a gene g in GO as follows:
If s contains g, got 2); otherwise, return FALSE; 2) A stop list of words such as "of", "to", "the", which does not indicate any meaning, are removed from s as well as p; 3) When p contains more than one terms, stemming (a method to convert a term into its root) is applied to both s and p. 4) If s contains all the terms in p and any two consecutive terms in p appear in s with less than three other terms in between, return TRUE; otherwise, return FALSE.
If an extraction of a biological process p for gene g is confirmed in a sentence s, both g and the terms appearing in p are highlighted in s for further analysis. An example of an extraction is shown as follows: DDB2, while participating in DNA repair, functions as a negative regulator of apoptosis, and may there-fore have a pivotal role in regulating immune response and cancer-therapeutic ", we extract several biological processes including “DNA repair", “negative regulation of apoptosis" and “immune response" for gene DDB2. All these terms are highlighted. The highlighted area makes users easy to determine if an extraction is correct or not. The correct extractions are selected and combined with the biological processes obtained from Entrez Gene.
Detect Functional Groups from Web Knowledge Based on the biological processes extracted from the previous two steps (2.1.1 and 2.1.2), we detect functional gene groups according to their biological processes. Gene g strongly belongs to the group of biological process p if it is associated with p based on the extracted knowledge. Gene g weakly belongs to the
is a parent, child or sibling of p. For example, KITLG is a strong member of group “cell proliferation" because its biological processes contain “cell proliferation"; while CCND1 is a weak member of this group because its biological process “cytokines is" is a child of “cell proliferation" according to GO. The distinction between the strong members and the weak members for a group provides a way to calculate weighted cluster centers.
2.2 Knowledge-based Clustering
Suppose ng functional groups are detected from the
extracted knowledge, the challenge of utilizing these ng
groups for the clustering model remains. We choose the semi-supervised K-means method [2] to incorporate the knowledge with the clustering procedure, because it is a well-designed algorithm combining both constraint-based supervision and distance-constraint-based supervision provided by the given knowledge. The semi-supervised method improves the standard K-means clustering by incorporating this supervision into the initialization process and the distance measure based on a probabilistic framework, which is explained in detail below.
Initialization Instead of randomly initializing the clustering centroid, we estimate the initial cluster
centroid from the detected nf functional groups. Since
many specific biological processes are usually extracted from the web, the number of all existing functional
groups nf tends to be quite large. Thus, it is usually the
case that nf> K, where K is the number of desired
clusters. We use a weighted first-farthest traversal
algorithm to select K functional groups that are farthest
distributed and with considerable group size. Then the cluster centroid is initialized with the weighted means of
these K groups:
Where Fk-sand Fk-w are the sets of strong members and
weak members respectively in the kth selected functional
group Fk. The constants w1 and w2 satisfy w1> w2. The
symbols gi and gj refer to genes. The formula shows that
gi is a strong member of Fk while gj is a weak member.
The condition w1> w2makes the centroid of Fk biased
toward the strong members.
Constraint-sensitive distance measure the constraints induced by the extracted knowledge are enforced into the clustering procedure. The semi-supervised K-means modifies the distance measure so that the assignments convicting with the provided knowledge are penalized. In this paper, if genes in the same functional group are assigned to different clusters, the distance measure is modified to penalize this violation (so called violation of
must-link constraints). Suppose Dik is the distance of a
gene gi from the cluster centroid of Ck.
The standard K-means assigns gene gi to cluster Ck with the minimum Dik for any Ck. Instead, we assign each gene gi to Ck to minimize the distortion N EW Dik, which is defined as:
Where the penalty function is:
Here, Fk is the kth functional groups that we used for initialization and Ck is the cluster corresponding to Fk. The iterated conditional modes (ICM) applied in [2] is also used in this paper to 2nd the optimal assignment based on the distance measure.
In this paper we only penalize the violation for the must-link constrains but do not consider cannot-must-link constraints, while both are penalized in the document clustering application in [2]. This is because our gene functional groups might be overlapped to some extent, in which case genes might still have similar biological roles even if they are in deferent functional groups. Therefore, the cannot-link constraints are not applied in this gene application.
As a whole, combined with these three improvements, the gene expression data clustering via semi-supervised K-means is summarized in the chart
III.
Experimental Results
We evaluated our model on a time series gene expression data set (¯bobcats response to serum provided by [7]). This data set contains the expression changes of 517 genes corresponding to 497 unique genes during the ¯rest 24 h of the serum response in serum-starved human fibroblasts. The expression changes are given as the ratio of the expression level at the given time point to the expression level in serum-starved fibroblasts.
First, we obtained the standard gene symbols for the corresponding gene names in the data from Entrez Gene. For example, “SEPP1" is the gene symbol for the gene name “H.sapiens mRNA for selenoprotein P".
Second, we extracted the GO annotations of biological processes for the given genes via the method in Section 2.1.1. Then we extracted biological processes from biomedical articles via the process in Section 2.2.2. There were totally 1081
Clustering Gene Expression Data via Semi-supervised K-means
Input: Set of gene expressions{gi }iN 1 , functional groups {Fk }nk f 1 containing both strong and weak members, desired number of clusters K.
Output: Disjoint K-partitioning of {gi }iN 1
1.Select K farthest distributed groups from the n f functional groups via the weighted farthest-first traversal algorithm.
2. For each k • {1, K}, initialize the centroid of cluster Ck with
3.For each i •{1,...N } , calculate the parameterized distance from gene i to cluster Ck, i.e., New _ DikA . If
gene i is closest to its own cluster, do nothing; otherwise, move it into the closest cluster.
4.Reestimate each cluster centroid with update
parameter matrix
5.Repeat 3& 4 until no genes moving from one cluster
to another.
Extractions and 596 were correct, which gave a precision rate of 55.1%. Users were responsible to select the correct extractions. This task of selection was not difficult with the highlights of the gene symbols and biological processes. The functional groups were then detected from these two sources of web knowledge based on GO (Section 2.1.3). A total number of 188 groups were detected.
Third, we set the desired number of clusters K as 4, 5, 6 and 7 respectively. The weighted farthest first traversal algorithm selected K functional groups. Then we started the semi-supervised clustering. During the initialization of the clustering, the constants (w1, w2) were set to be (1, 0.5) in this study, which satisfied w1 > w2 so that strong members dominated the functional group that they belong to.
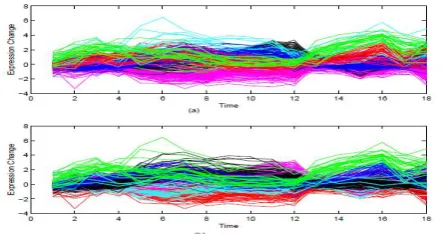
The parallel coordinate scheme was used to present the clustering results, where different lines stand for different genes and different colors for different clusters. Figure 3 shows the clustering results of the standard K-means and our method with the case K = 6. It indicates that although the main patterns of the up-regulated genes are discovered in both methods, the standard K-means fails to distinguish two different patterns of the down-regulated genes that the knowledge-based clustering succeeds to separate (the light-blue cluster and the red cluster in Figure 3 (b)).
Figure 5. Clustering results when K = 6: (a) K-means; (b) semi-supervised K-means
and the clusters assigned to them by using standard K-means are compared with those by using our method. Three clusters (say C1, C2 and C3) were identified with standard K-means and two clusters (C1 and C2) were identifying with our method for these sixty genes. While fifty-three of the genes were equally(identically) assigned to C1 and C2 by using these two methods, seven genes were assigned into C3 by using standard K-means and they were still in C1 and C2 by using our method. Among these seven different classified genes, they were unknown genes, which had no biological information.
The other two known genes are CPTI and LUM, members of C1 and C2 respectively with our method but members of C3 with standard K-means. We further examined the biological process of these two genes. LUM is involved in visual perception and the members in C2 (e.g. CYP1B1 and FBN1) are also involved in visual perception. This proves that LUM is likely to be a member of C2 as our method clustered instead of a member of C3 as standard K-means clustered. Similarly, CPTI is involved in amino acid metabolism, which belongs to cellular metabolism, while other members of C1 (e.g. SEPP1 and PIN1) also have the biological processes (response to oxidative stress for SEPP1 and protein folding) that also belong to cellular metabolism. Thus, CPTI is likely to be a member of C1 also as our method clustered.
To mathematically evaluate the clustering results, two metrics, namely homogeneity (H) and separation (S) are introduced:
The metric H is calculated as the average distance between each data point and the center of the cluster it belongs to. The metric S is calculated as the weighted average distance between cluster centers. The metric H reflects the compactness of the clusters while S reflects the overall distance between clusters
IV.
CONCLUSIONS
This paper given a general framework of web-knowledge-based clustering for gene expression information. The online was used because the supply for gathering helpful info to guide clustering. Biological processes were extracted from each the web gene databases and search engines on biomedical documents. Functional groups of genes were then detected from the extracted biological processes supported GO. Finally, the semi-supervised K-means was applied to include the information into the clustering model. The experimental results showed that our information-based clustering model outperformed the clustering model with none knowledge.
V.
REFERENCES
[1]. B. Adryan and R. Schuh. Gene-ontology-based
clustering of gene expression data. Bioinformatics, (2016).
[2]. S. Basu, M. Bilenko, and R. J. Mooney. A
probabilistic framework for semi-supervised clustering. In the Tenth ACM SIGKDD
International Conference on Knowledge
Discovery and Data Mining, pages 59{68, Seattle, WA, August 2004.
[3]. J. Cheng, J. Martin, M. Cline, T. Awad, and M. A.
Siani-Rose. Gene expression pro炉 ling analysis
augmented by mathematically transformed gene
ontology. In International Conference on
Intelligent Systems in Molecular Biology ISMB 2002, August 2002.
[4]. J.-H. Chiang and H.-C. Yu. Meke: discovering the
[5]. M. B. Eisen, P. T. Spellman, P. O. Brown, and D. Botstein. Cluster analysis and display of genome-wide expression patterns. Proceedings of Natural
Academy Science, 95(25):14863{14868,
December 1998.
[6]. D. Hanisch, A. Zien, R. Zimmer, and T. Lengauer.
[7]. Co-clustering of biological networks and gene
expression data. Bioinformatics, 18(Suppl 1).
[8]. R. Iyer, M. B. Eisen, D. T. Ross, G. Schuler, T.
Moore, J. C. F. Lee, J. M. Trent, L. M. Staudt, J. H. Jr., M. S. Boguski, and et al. The transcriptional program in the response of human fibroblasts to serum. Science, 283(1):83{87, January 1999.
[9]. Greed, T. R. Hvidsten, H. Midelfart, J.
Komorowski, and A. K. Sandvik. Predicting gene ontology biological process from temporal gene expression patterns. Genome Res, 13:965{979, 2003.
[10]. G. J. Nau, J. F. L. Richmond, A. Schlesinger, E.
G. Jennings, E. S. Lander, and R. A. Young. Human macrophage activation programs induced by bacterial pathogens. Proceedings of Natural Academy of Sciences of the U. S. A., 99(3):1503{ 1508, February 2002.
[11]. Schliep, A. Schonhuth, and C. Steinho. Using
hidden markov models to analyze gene expression time course data. Bioinformatics, 19:I264{I272, 2003.
[12]. S. Soderland. Learning information extraction
rules for semi-structured and free text. Machine Learning, 34(1-3):233{272, 1999.
[13]. S. Tavazoie, J. Hughes, M. Campbell, R. Cho, and
G. Church. Systematic deter-mination of genetic network architecture, 1999.
[14]. M. L. Whitefield, G. Sherlock, A. J. Saldanha, J. I.