High-resolution measurements of the exited states (n,p
n
),
(n,d
n
) C-12 cross sections
M. Pillon1,a, M. Angelone1, F. Belloni2, W. Geerts2, S. Loreti1, A. Milocco3, and A.J.M. Plompen2
1 ENEA UT-FUS, C.R. Frascati, via E. Fermi 45, 00044 Frascati (Rome) Italy
2 European Commission, Joint Research Centre, Institute for Reference Materials and Measurements, 2440 Geel, Belgium 3 CCFE, Culham Science Centre, Abingdon OX14 3DB, UK
Abstract. Measurements of C12 cross sections for the excited states (n,p0) up to (n,p4) and (n,d0), (n,d1) have been carried out. The Van de Graaff neutron generator of the EC-JRC-IRMM laboratory has been used for these measurements. A very thin tritiated target (263µg/cm2) was employed with deuteron beams energies impinging on the target in the range 2.5–4.0 MeV. Neutrons in the range 18.9–20.7 MeV were produced with an intrinsic energy spread of 0.2–0.25% FWHM. With such narrow neutron energy spread, using a high energy resolution device such as a single crystal diamond detector, several peaks from the outgoing charged particles produced by the (n,pn), (n,dn) and also (n,α0) reactions appear in the pulse height spectrum. The peaks can be identified using the reaction Q-values. The diamond detector used for these measurements has shown an intrinsic energy resolution lower than 0.9% FWHM. The analysis of the peaks has permitted to derive the partial carbon reaction cross sections for several excited states. The results are presented in this paper with the associated uncertainties and they are compared with different versions of TENDL compilation when these data are available (e.g. versions 2009, 2010, 2011 and 2015) and also with experimental results available in the EXFOR database.
1. Introduction
Artificial diamond detectors are used to detect neutron radiation thanks to their spectroscopic characteristics. Several nuclear reactions occur in carbon under neutron irradiation causing several types of outgoing charged particles. These reactions have been studied in several papers [1–6]. Neutron-carbon interactions release the energy of the reaction products in the diamond detector and produce an output signal proportional to the deposited energy. The output signal can be recorded as a pulse height spectrum (PHS) using a multichannel analyzer, performing the so-called Pulse Height Analyses (PHA). Sharp peaks are observed in the PHS in case of reactions where only charged particles are produced in the exit channel, which deposit all available energy (incident neutron energy plus Q-value) in the detector. In contrast wide distributions with characteristic edges are produced when one or more neutrons are present in the exit channels. The analysis of the parameters of the sharp peaks (net counts, width, centroid position), after normalizing to the total neutron fluence and the number of carbon atoms in the detector, allow the evaluation of individual reaction cross sections.
A paper was already published where the cross sections of n+12C reaction leading to both ground and excited
levels of the reaction products were measured using a diamond detector [7].
In the present work a very thin tritiated target (263µg/cm2) was employed at the Van de Graaff neutron
generator of EC-JRC-IRMM [8] in order to improve
the peaks separation and thus the analysis of the peaks
ae-mail:[email protected]
themselves. The accelerator deuteron beam energy was in the range 2.5–4.0 MeV and with the diamond detector
positioned at 0◦ with respect to the beam axis the
neutrons impinging into the detector were in the range 18.91–20.69 MeV with an intrinsic energy spread<0.25% FWHM. With such narrow neutron energy spread, since the used diamond detector had an intrinsic energy resolution lower than 0.9% FWHM in the range of the energy deposited by the charged products, several well separated peaks were observed. These reactions, ordered in descending peak energy, are: (n,α0); (n,p0); (n,p1); (n,d0);
(n,p2); (n,p3); (n,p4); (n,d1). Some of these cross sections
were never measured before.
2. Experimental set-up
The used Single Crystal Diamond detector (SCD) was fabricated by Istituto di Struttura della Materia (ISM), Consiglio Nazionale delle Ricerche (CNR), Rome, (Italy), while the electronics were standard CAEN catalogue
[9] components. ISM-CNR has produced the detector
using an “electronic grade” (with [N] <5 ppb and [B] <1 ppb) Chemical Vapour Deposition (CVD) single crystal diamond plate (4.5×4.5 mm2, thickness d=
500µm), provided by Element Six Ltd [10]. ISM-CNR deposited square 200 nm thick multilayer gold finished contacts, 4.2×4.2 mm2, on both plate faces and then
mounted the plate in an anodized aluminium casing using an alumina plate holder. A standard Sub Miniature version A (SMA) connector is used to pick-up the signal output. The detector active volume was calculated from an accurate measure of the contacts area and thickness.
This it is possible since it is has been experimentally demonstrated that the diamond sensitive region is limited to the volume under the contacts [11]. From the resulting active volume of 0.0088 cm3 and the density of diamond (3.52(1) g cm−3) the number of12C atoms was derived.
CAEN’s electronics consisted of a single channel charge sensitive preamplifier, up to 200 pF input capacitance, 45 mV/MeV (Si) sensitivity and a DT5780, a Dual Digital Multi Channel Analyzer (MCA) based on a 14-bits 100 MS/s flash ADC. DT5780 directly accepts pulses from the charge sensitive preamplifier performing a digital trapezoidal shaping on exponential decaying signals. Complete control of all the shaping parameters like trapezoid rise time, flat top, etc. is possible. The diamond detector was operated with 600 V negative bias during all the measurements. It was positioned at a distance of 54.45 mm from the VdG neutron target, at 0◦ with respect to the beam axis. The use of the digitizer has permitted to record bi-dimensional PHS (time-amplitude) and thus parts of the spectrum where some noise was present, for example produced by the VdG, were removed in order to improve the peaks separation.
A sandwich of two activation foils, Al+Zr, was used as neutron fluence monitor. The foils were at the same distance of the SCD but at an angle of 30◦. At half of the distance between the SCD and the target an aluminium disc, 1 mm thick, was positioned with the scope to shield the diamond detector from the energetic protons arising from the D(3He,4He)p reaction. This reaction occurs in
tritiated targets due to the decay of tritium and the
produced protons have an energy >14 MeV and can
produce a strong noise signal in open window SCD. An identical aluminium disc was positioned in front of the sandwich activation foils in order to compensate for the small neutron flux reduction caused by this aluminium shield.
After each run the activation foils were measured with two well calibrated HPGe detectors and the neutron fluence at the diamond detector position derived. The methodology used is well described in Ref. [12]. The uncertainty estimate for the fluence measurements was
±2.5% at one standard deviation.
3. Results
A total of eight runs were recorded with the produced neutron energies varying from 18.91 to 20.69 MeV. The gain of the electronic chain was the same for all the runs. The neutron energies were calculated from the deuteron beam energy using the D(t,n)4He relativistic
kinematics. A typical PHS recorded with the measurement set-up described above is show in Fig. 1. The energies of the peaks were obtained using the reaction Q values
as described in Ref. [13]. The peak energies-PHS
channel correlation (energy calibration) for almost all the investigated neutron energies is gathered in Fig. 2. A couple of them were not used because obtained with a different electronics set-up. It indicates a very good linear correlation between peak positions versus the deposited energy from the various reactions. The small standard deviation indicates the high quality determination of the impinging neutron energies.
From the fitting of the peaks in the PHS their energy, width and net area can be calculated. The neutron
Figure 1. Typical pulse height spectrum with the indicated peaks produced by the investigated reactions.
Figure 2. Energy calibration.
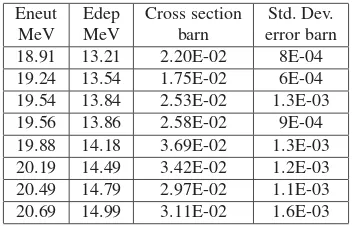
Table 1.12C(n,α0)9Be measured cross section values. Eneut Edep Cross section Std. Dev.
MeV MeV barn error barn
18.91 13.21 2.20E-02 8E-04 19.24 13.54 1.75E-02 6E-04 19.54 13.84 2.53E-02 1.3E-03 19.56 13.86 2.58E-02 9E-04 19.88 14.18 3.69E-02 1.3E-03 20.19 14.49 3.42E-02 1.2E-03 20.49 14.79 2.97E-02 1.1E-03 20.69 14.99 3.11E-02 1.6E-03
induced reaction cross sections are obtained as described in Ref. [14].
The peak fitting was performed using the peak analysis
software GAMMAVISIONTM8.0, commercialized by
ORTEC company, utilizing the analysis engine NAI32, designed specifically for some tens of keV resolution spectrum analysis. The statistical uncertainty in the reaction cross sections values (one standard deviation) was calculated as the quadrature sum of the peak analyses uncertainties and the fluence uncertainties. A maximum systematic uncertainty of ±5% can be attributed to the
determination of 12C number of atoms. Half of this
Table 2.12C(n,p
0)12B measured cross section values. Eneut Edep Cross section Std. Dev.
MeV MeV barn error barn
18.91 6.32 1.13E-02 4E-04 19.24 6.65 9.80E-03 4.0E-04 19.54 6.95 1.13E-02 8E-04 19.56 6.97 1.03E-02 4E-04 19.88 7.29 1.15E-02 4E-04 20.19 7.60 9.62E-03 3.9E-04 20.49 7.90 7.62E-03 3.2E-04 20.69 8.10 8.62E-03 6.3E-04
Table 3.12C(n,p1)12B measured cross-section values. Eneut Edep Cross section Std. Dev.
MeV MeV barn error barn
18.91 5.37 1.38E-02 5E-04 19.24 5.70 6.87E-03 2.9E-04 19.54 6.00 8.21E-03 5.5E-04 19.56 6.02 8.69E-03 3.2E-04 19.88 6.34 1.39E-02 5E-04 20.19 6.65 1.16E-02 4E-04 20.49 6.95 1.09E-02 4E-04 20.69 7.15 1.20E-02 8E-04
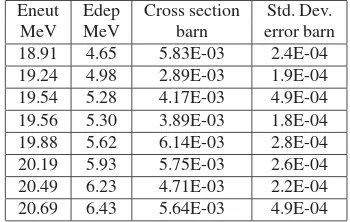
Table 4.12C(n,p2)12B measured cross section values. Eneut Edep Cross section Std. Dev.
MeV MeV barn error barn
18.91 4.65 5.83E-03 2.4E-04 19.24 4.98 2.89E-03 1.9E-04 19.54 5.28 4.17E-03 4.9E-04 19.56 5.30 3.89E-03 1.8E-04 19.88 5.62 6.14E-03 2.8E-04 20.19 5.93 5.75E-03 2.6E-04 20.49 6.23 4.71E-03 2.2E-04 20.69 6.43 5.64E-03 4.9E-04
3.1. Data analysis and discussion
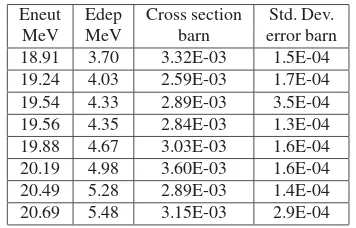
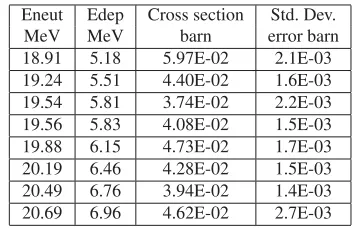
All the measured cross section values with the associated uncertainties are gathered in Tables 1 to 8. After each Table a Figure showing the plot of the measurements compared with the existing data in the EXFOR database [15] or available in TENDL compilations on the website [16] is reported and commented. Some caution would be required in the interpretation of the TENDL data. This library is produced by the evaluation code TALYS [17], which relies on physics models that are statistical in nature. Hence, with small number of nucleons (12 in our case) these models might be inappropriate and the partial cross sections might be questionable.
3.1.112C(n,α
0)9Be
A good agreement is found between our new experimental data of 12C(n,α
0)9Be reaction cross section with the
experimental data from Stevens in EXFOR (see insert).
3.1.212C(n,p0)12B
Only TENDL-2009 compilation reproduces our new experimental data which are higher than previous published data.
Figure 3. 12C(n,α0)9Be results compared with EAF 2010 and available experimental data in EXFOR database.
Figure 4. 12C(n,p0)12B results compared with TENDL compilations.
Figure 5. 12C(n,p
1)12B results compared with TENDL compilations.
3.1.312C(n,p
1)12B
Also in this case only TENDL-2009 compilation mimic the experimental data, but the large variation of the cross section around 19 MeV is not reproduced. It is important to note that similar variations are also present in the reaction
12C(n,α
0)9Be, see Fig.3.12C(n,p1)12B are very new data,
never measured before.
3.1.412C(n,p
2)12B
Figure 6. 12C(n,p2)12B results compared with TENDL compilations.
Figure 7. 12C(n,p3)12B results compared with TENDL compilations.
Table 5.12C(n,p3)12B measured cross section values. Eneut Edep Cross section Std. Dev.
MeV MeV barn error barn
18.91 3.70 3.32E-03 1.5E-04 19.24 4.03 2.59E-03 1.7E-04 19.54 4.33 2.89E-03 3.5E-04 19.56 4.35 2.84E-03 1.3E-04 19.88 4.67 3.03E-03 1.6E-04 20.19 4.98 3.60E-03 1.6E-04 20.49 5.28 2.89E-03 1.4E-04 20.69 5.48 3.15E-03 2.9E-04
experimental data are in agreement with the new. The cross sections variation around 19 MeV neutron energy is present also in these data.
3.1.512C(n,p
3)12B
TENDL-2009 compilation is higher than the experimental data and the others are lower. Some previous published experimental data are in agreement with the new.
3.1.612C(n,p
4)12B
In this case only TENDL-2009 compilation mimic the experimental data. 12C(n,p
4)12B are new data, never
measured before.
All the measured partial n,pncross sections have been
summed and they are compared in Fig. 9 with other
Table 6.12C(n,p
4)12B measured cross section values. Eneut Edep Cross section Std. Dev.
MeV MeV barn error barn
18.91 3.60 1.36E-03 9.7E-05 19.24 3.93 2.12E-03 1.7E-04 19.54 4.23 1.29E-03 2.9E-04 19.56 4.25 1.31E-03 1.0E-04 19.88 4.57 1.46E-03 1.2E-04 20.19 4.88 1.58E-03 1.1E-04 20.49 5.18 1.19E-03 1.1E-04 20.69 5.38 1.16E-03 2.4E-04
Figure 8. 12C(n,p4)12B results compared with TENDL compilations.
Figure 9. Comparison of the ipi (i=1,2. . . ) measured partial cross sections with the 12C(n,p)12B evaluated data and experimental data taken from EXFOR.
experimental data and evaluation of the total 12C(n,p)12B cross section available in EXFOR and in TENDL compilations. EAF-2010 derived only from TENDL 2015 data is very wrong. Our new measurements could be consistent with Kreger and Bobyr data. Published AIP2011 data which are consistent with Rimmer data do not have the n,p1 and n,p4 contributions. This work shows that
especially the n,p1contribution is important since it is of
the same order of magnitude of the n,p0contribution.
3.1.712C(n,d0)11B
Figure 10. 12C(n,d0)11B results compared with TENDL compilations.
Table 7.12C(n,d
0)11B measured cross section values. Eneut Edep Cross section Std. Dev.
MeV MeV barn error barn
18.91 5.18 5.97E-02 2.1E-03 19.24 5.51 4.40E-02 1.6E-03 19.54 5.81 3.74E-02 2.2E-03 19.56 5.83 4.08E-02 1.5E-03 19.88 6.15 4.73E-02 1.7E-03 20.19 6.46 4.28E-02 1.5E-03 20.49 6.76 3.94E-02 1.4E-03 20.69 6.96 4.62E-02 2.7E-03
Table 8.12C(n,d1)11B measured cross-section values. Eneut Edep Cross section Std. Dev.
MeV MeV barn error barn
18.91 3.05 4.18E-03 1.9E-04 19.24 3.38 5.06E-03 2.4E-04 19.54 3.68 6.68E-03 6.4E-04 19.56 3.70 6.22E-03 2.4E-04 19.88 4.02 7.32E-03 2.9E-04 20.19 4.33 7.20E-03 2.8E-04 20.49 4.63 6.70E-03 2.7E-04 20.69 4.83 5.92E-03 4.9E-04
3.1.812C(n,d
1)11B
TENDL-2015 has some agreement with the new exper-imental data. Only one previous published experexper-imental data is in agreement with the new.
All the measured partial n,dn cross sections have
been summed and they are compared in Fig. 12 with
other experimental data and evaluation of the total
12C(n,d)11B cross section available in EXFOR and in
TENDL compilations.
The experimental data consider only d0+d1. They
are higher than Dimbylow experimental data in EXFOR. TENDL compilations and EAF 2010 are in reasonable agreement with our experimental data.
4. Conclusions
Several partial cross sections to discrete levels of fast neutron interaction with carbon 12 have been measured, some of them for the first time. The results, compared with different evaluations from TENDL compilations show a behavior not unique. Most of the cases indicates TENDL
Figure 11. 12C(n,d1)11B results compared with TENDL compilations.
Figure 12. Comparison of the idi (i=1,2) measured partial cross sections with the 12C(n,d)11B evaluated data and experimental data taken from EXFOR.
2009 as the best compilation but in the case of12C(n,d1)11B
the latest compilation TENDL 2015 is better. The results of this work can be useful for the improvement of the knowledge of mechanism of the neutron carbon interaction and the validation of nuclear models.
This work was supported by the European Commission within the FP7 EUFRAT program. The authors thank the operators of the IRMM VdG accelerator for the providing the conditions necessary for these experiments.
References
[1] Dmitrievich Kovalchuk, V., Igorevich Trotsik, V., Nuclear Inst. and Methods in Physics Research, A 351(2-3), 590–591 (1994)
[2] Pillon, M., Angelone, M., Krasilnikov, A.V., Nuclear Inst. and Methods in Physics Research, B 101(4), 473–483 (1995)
[3] Pillon, M., Angelone, M., Kr´asa, A., Plompen, A.J.M., Schillebeeckx, P., Sergi, M.L., Nuclear Instruments and Methods in Physics Research, Section A: Accelerators, Spectrometers, Detectors and Associated Equipment, 640(1), 185–191 (2011) [4] Milocco, A., Pillon, M., Angelone, M., Plompen, A.,
[5] Zboril, M., Araque, J.E.G., Nolte, R., Zimbal, A. Proceedings of Science, Volume 2015-January, 2015, 1st EPS Conference on Plasma Diagnostics, ECPD 2015; Frascati; Italy; 14-17 April 2015 Code 118792
[6] Osipenko, M., Ripani, M., Ricco, G., Caiffi, B., Pom-pili, F., Pillon, M., Verona-Rinati, G., Cardarelli, R., Nuclear Instruments and Methods in Physics Research, Section A: Accelerators, Spectrometers, Detectors and Associated Equipment 817, 19–25 (2016)
[7] Pillon, M., Angelone, M., Kr´asa, A., Plompen, A.J.M., Schillebeeckx, P., Sergi, M.L., AIP Confer-ence Proceedings 1412, 121 (2011)
[8] C. Sage, V. Semkova, O. Bouland, P. Dessagne, A. Fernandez, F. Gunsing, C. N¨astren, G. Nogu`ere, H. Ottmar, A.J.M. Plompen, P. Romain, G. Rudolf, J. Somers, F. Wastin, Phys. Rev. C 81, 064604 (2010)
[9] CAEN S.p.A., seehttp//www.caen.it/
[10] Element Six Ltd., seehttp://www.e6cvd.com/
[11] C. Verona, G. Magrin, P. Solevi, V. Grilj, M. Jaksic, R. Mayer, Marco Marinelli and G. Verona-Rinati, Journal of Applied Physics 118, 184503 (2015) [12] S. Jakhar, C.V.S. Rao, A. Shyam and B. Das,
“Measurement of 14 MeV neutron flux from D-T neutron generator using activation analy-sis,” 2008 IEEE Nuclear Science Symposium
Conference Record, Dresden, Germany (2008),
pp. 2335–2338
[13] Pai´c, G., Kadija, K., Ilijaˇs, B., Kovaˇcevi´c, K., Nucl. Instrum. Meth. 188, 119 (1981)
[14] H.J. Brede, G. Dietze, H. Klein and H. Sch¨olermann, Nucl. Sci. Eng. 107, 22 (1991)
[15] EXFOR: Experimental Nuclear Reaction Data
-http://www-nds.iaea.org/exfor/
[16] TALYS-based evaluated nuclear data library:
http://www.talys.eu/home/