New Zealand Journal of Ecology (2005) 29(1): 117-128 ©New Zealand Ecological Society
Improving predator capture rates: analysis of river margin trap site
data in the Waitaki Basin, New Zealand
Bevan G. Cameron
1,3, Yolanda van Heezik
1*, Richard F. Maloney
2,
Philip J. Seddon
1,
and John A. Harraway
41 Department of Zoology, University of Otago, P.O. Box 56, Dunedin, New Zealand 2 Department of Conservation, Private Bag, Twizel, New Zealand
3 Current address: Kiwi and Birdlife Park, Brecon St., P.O. Box 643, Queenstown.
4 Department of Mathematics and Statistics, University of Otago, P.O. Box 56, Dunedin, New Zealand * Author for correspondence (E-mail: [email protected])
____________________________________________________________________________________________________________________________________
Abstract: We recorded trap site characteristics and captures during a trapping programme designed to protect breeding and released black stilts (kaki, Himantopus novaezelandiae) from predation, in order to learn about trap site features that might improve the efficacy of future predator trapping management. Captures were made at 1629 leg-hold traps opened over 71 333 trap nights between 1998 and 2000, at six locations in the Upper Waitaki Basin, New Zealand. Twelve trap site variables were recorded. The model describing the best combination of variables for four groups of predators (cats Felis catus, mustelids Mustela furo (ferrets) and M. erminea (stoats), harriers
Circus approximans and hedgehogs Erinaceus europaeus) was found using logistic regression and AIC values. For all predator groups both the way the trap was set and its placement within the landscape (with respect to habitat type and the distribution of landscape features that might be important to predators) influenced capture rates. Mustelids and harriers were more likely to be caught on stable riverbed habitats where rabbit densities are highest, while hedgehogs were mainly caught on river terraces and cats were equally likely to be caught anywhere. Individual trap characteristics in terms of set type, trap haze, trap backing, plate haze, visibility of bait, substrate and ground cover, associated with higher catch rates for each predator group are described.
____________________________________________________________________________________________________________________________________
Keywords: kaki; black stilts; Himantopus novaezelandiae; capture rates; predators; trapping efficacy
Introduction
Predation is considered to be the primary cause of decline and extinction for many species of birds worldwide (Ricklefs, 1969), and predator control is often employed, with apparent success, for the conservation of endangered or declining populations (Côté and Sutherland, 1997; Moorhouse et al., 2003; Pierce and Westbrooke, 2003). The kaki or black stilt (Himantopus novaezelandiae) is a critically endangered species that has been the focus of intensive conservation management for the past 20 years (Maloney and Murray, 2002). Once widespread around New Zealand, kaki are now confined to the wetlands and braided rivers of the Upper Waitaki Basin in the South Island. Predation is one of the principal factors limiting population growth, accounting for 64% of kaki nest failures (Pierce, 1986). Video-camera monitoring and direct observations of nesting kaki and other river birds (e.g., banded dotterels Charadrius bicinctus, and black-fronted terns Sterna albostriata) identified the following predators as being responsible for mortality of eggs and young chicks: ferrets (Mustela furo), hedgehogs
(Erinaceus europaeus), harriers (Circus approximans), black-backed gulls (Larus dominicanus), and Australian magpies (Gymnorhina tibicen). Cats (Felis catus) were observed taking adults as well as eggs and chicks (Sanders and Maloney, 2002). Predator trapping aimed at reducing the high rate of mortality of eggs and chicks of kaki was carried out during 14 years between 1981 and 2000, and increased fledging success in most years (Keedwell et al., 2002).
and maintenance of field techniques to be used in predator control operations, and the importance of keeping systematic records on what has been done. An analysis of a database on ferret control operations in Southland and Otago (Norbury et al., 2002) yielded some general recommendations on trap types, bait types and trap set locations to optimise ferret captures, but studies on other species, or in other regions, have not been undertaken.
Decisions on the best placement and configurations of traps are usually based on trappers’ opinion and experience. However, problems of retention of staff with expert trapping abilities exist, requiring repeated investment of time and money into adequate training of trappers (Cook et al., 2000a), and the opinions of trappers have not been formally investigated. The Kaki Recovery Team decided to make a quantitative assessment of the effectiveness of trap placement in
1999 (Maloney et al., 1999), with the result that trap and site variables were measured thenceforth. Trappers were instructed to set and haze traps in the traditional manner (Maloney et al., 1999), including experimentation with different trap sites, sets and hazes (material used to surround a trap and bait, to direct the animal over the trap), to maximise the number of features that might result in a predator capture. In this paper we investigate the relationship between trap site data and captures of four groups of predators; cats, harriers, mustelids (ferrets and stoats) and hedgehogs. Because the different predator groups vary in the way they hunt (e.g. harriers are aerial, diurnal predators, whereas hedgehogs are nocturnal and primarily insectivorous), it was expected that trap site characteristics associated with higher capture rates would also vary.
Methods
Trapping locations and schedule
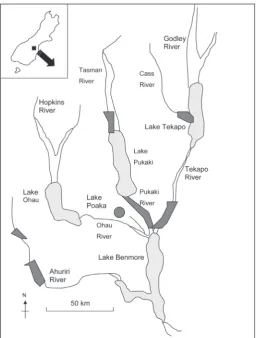
Predator trapping was conducted to protect breeding kaki in the Cass, Tasman, Tekapo and Ahuriri areas of the Waitaki Basin, New Zealand, between July 1998 and January 1999, and between September 1999 and December 1999 (excluding the Cass area in 1999; Fig. 1). Trapping to protect captive-reared and released sub-adult and juvenile kaki occurred between February 1999 and February 2000 in the Cass area. Trapping to trial lure baits (3.2% of total trap nights) occurred between March 1999 and March 2000 in the Pukaki, Tekapo and Lake Poaka areas (Cook and Maloney, 1999; Cook et al., 2000; Cook and Maloney, 2001). Most trapping occurred during spring and early summer (94% trap nights), with some (3.3%) in mid-summer and in autumn and winter (2.7%). Contract trappers maintained the trap lines in each area.
Trapping areas were situated on old and young river terraces, flood plains, and on wetlands and fans, derived mostly from Pleistocene and Holocene alluvium deposits and fluvio-glacial outwash (Selby, 1992; Webb, 1992). Except for peaty wetland sites, soils were mostly well-drained fine sandy or silt loams (Webb, 1992). Vegetation on these sites reflected time since formation, hydrology and degree of invasion by naturalised plants (Connor, 1964; Walker et al., 2003). Riverbed sites were dominated by low-growing native and introduced mat plants and grasses. Stable river terraces had modified short tussock Poa spp. and
Festuca spp. grasslands, with taller shrub patches (mainly matagouri Discaria toumatou, briar Rosa rubiginosa) particularly on younger terraces, slopes and fans. River margins and wetlands were mostly scattered exotic trees (mainly crack willow Salix fragilis), taller grasses and Carex species.
Trapping techniques
Almost all traps were Victor 1.5 soft-catch leg-hold traps (the lure trial used only Victor traps), with Fenn Mk6 kill traps used at a ratio of about one Fenn set to every 10 Victors. There were three main set types: single Victors, multiple Victors, and Fenns. Victor traps were set either on the ground, in a hole, on a post, in a ring (6–7 in a circle) or in a walk-through (see Table 1 for descriptions of traps). Fenn traps were always double-set in either plastic philproof or wooden tunnels (Cook and Maloney, 1999, Cook et al., 2000). Fenn traps were never set with a plate haze, while Victor traps were always hazed on the plate. Traps were mainly baited with either rabbit (Oryctolagus cuniculus) or hare (Lepus europaeus) (98% of baits). Rabbit-scented lure baits were used on 3.2% of total trap nights, as part of a trial to determine the effectiveness of visual and olfactory lures (Cook et al.,
2000b). Traps were spaced approximately 50–100 m apart along a line to encompass the areas designated for protection. Traps were placed in sites that were predicted by experienced trappers as more likely to catch predators. Traps were checked daily, and any predators caught were humanely killed. Traps were never moved out of an area, but may have been moved to other sites within 10–50 m of the line. In practice most traps were never shifted due to time constraints. Traps were re-baited every 2–3 days and reset as required. The number of traps used per line and the length and number per line varied considerably. In total there were 1629 traps, which were opened for 71 333 trap nights. The number of nights that traps were opened ranged from 1 to 136 nights (mean = 46.67, median = 36).
Trap site data collection
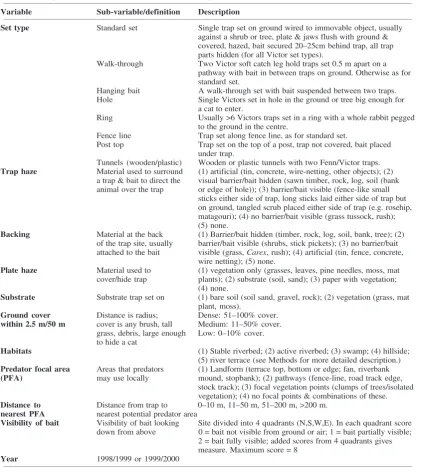
At each trap site the following variables were recorded, each of which was described by a number of sub-variables: set type (nine sub-variables), trap haze (five sub-variables), trap backing (five sub-variables), plate haze (four sub-variables), substrate (two sub-variables), ground cover within 2.5 m and 50 m (six sub-variables), habitat (five sub-variables), predator focal areas (eight sub-variables), distance to nearest predator focal area (four sub-variables), year (two sub-variables) and visibility of bait (four sub-variables). Each variable and sub-variable is described in Table 1. Combinations of sub-variables were also recorded for the variable “predator focal area”: this might comprise a landform (e.g., riverbank), as well as a pathway (e.g., stock track). These sub-variables were subjective, but selected on the basis of current knowledge about how predators may move through landscapes (e.g., Baker, 1989; Ragg and Moller, 2000; Clapperton, 2001; Norbury et al., 2001). For the purposes of the statistical analysis, each combination of sub-variables was treated as unique. In total, there were 54 sub-variables.
Not all set types included the same range of variables. Walk-through, tunnel, hole, ring and post-top sets did not have a trap haze. There was no backing in walk-throughs, rings and hole sets. Plate hazes were of three types: soil, which filled the gaps between the trap arms, giving it a more solid appearance; paper and vegetation, which also made the trap look more solid; and vegetation, consisting of ground-up grass mixed with a little soil, which tended to result in a slight hollow under the trap.
were set in habitats surrounding these habitats: active riverbeds, stable riverbeds, swamps, hillsides and river terraces. The “cover within 2.5 m and 50 m” variables were measured because it was thought predators may either approach areas with cover (e.g. a bush) because the bush may shelter prey, or predators may prefer to be hidden themselves.
Predator groupings
During this study 130 cats, 158 ferrets, 631 hedgehogs, 26 stoats (Mustela erminea), 839 harriers, 55 Norway rats (Rattus norvegicus) and 95 possums (Trichosurus vulpecula) were caught. Rats and possums were excluded from the analysis, as there is little direct evidence that they are significant predators of nesting Table 1. Description of the terms used to describe predator trap sets and locations.
____________________________________________________________________________________________________________________________________
Variable Sub-variable/definition Description
____________________________________________________________________________________________________________________________________
Set type Standard set Single trap set on ground wired to immovable object, usually against a shrub or tree, plate & jaws flush with ground & covered, hazed, bait secured 20–25cm behind trap, all trap parts hidden (for all Victor set types).
Walk-through Two Victor soft catch leg hold traps set 0.5 m apart on a pathway with bait in between traps on ground. Otherwise as for standard set.
Hanging bait A walk-through set with bait suspended between two traps. Hole Single Victors set in hole in the ground or tree big enough for
a cat to enter.
Ring Usually >6 Victors traps set in a ring with a whole rabbit pegged to the ground in the centre.
Fence line Trap set along fence line, as for standard set.
Post top Trap set on the top of a post, trap not covered, bait placed under trap.
Tunnels (wooden/plastic) Wooden or plastic tunnels with two Fenn/Victor traps. Trap haze Material used to surround (1) artificial (tin, concrete, wire-netting, other objects); (2)
a trap & bait to direct the visual barrier/bait hidden (sawn timber, rock, log, soil (bank animal over the trap or edge of hole)); (3) barrier/bait visible (fence-like small
sticks either side of trap, long sticks laid either side of trap but on ground, tangled scrub placed either side of trap (e.g. rosehip, matagouri); (4) no barrier/bait visible (grass tussock, rush); (5) none.
Backing Material at the back (1) Barrier/bait hidden (timber, rock, log, soil, bank, tree); (2) of the trap site, usually barrier/bait visible (shrubs, stick pickets); (3) no barrier/bait attached to the bait visible (grass, Carex, rush); (4) artificial (tin, fence, concrete,
wire netting); (5) none.
Plate haze Material used to (1) vegetation only (grasses, leaves, pine needles, moss, mat cover/hide trap plants); (2) substrate (soil, sand); (3) paper with vegetation;
(4) none.
Substrate Substrate trap set on (1) bare soil (soil sand, gravel, rock); (2) vegetation (grass, mat plant, moss).
Ground cover Distance is radius; Dense: 51–100% cover. within 2.5 m/50 m cover is any brush, tall Medium: 11–50% cover.
grass, debris, large enough Low: 0–10% cover. to hide a cat
Habitats (1) Stable riverbed; (2) active riverbed; (3) swamp; (4) hillside; (5) river terrace (see Methods for more detailed description.) Predator focal area Areas that predators (1) Landform (terrace top, bottom or edge; fan, riverbank (PFA) may use locally mound, stopbank); (2) pathways (fence-line, road track edge,
stock track); (3) focal vegetation points (clumps of trees/isolated vegetation); (4) no focal points & combinations of these. Distance to Distance from trap to 0–10 m, 11–50 m, 51–200 m, >200 m.
nearest PFA nearest potential predator area
Visibility of bait Visibility of bait looking Site divided into 4 quadrants (N,S,W,E). In each quadrant score down from above 0 = bait not visible from ground or air; 1 = bait partially visible;
2 = bait fully visible; added scores from 4 quadrants gives measure. Maximum score = 8
Year 1998/1999 or 1999/2000
braided river birds (Keedwell and Brown, 2001; Sanders and Maloney, 2002). Cats, mustelids (ferrets and stoats combined), hedgehogs, and harriers were analysed separately, as their capture may depend upon specific trap characteristics. Cats can be active at any time of the day (Pierce, 1987) and are significant predators of birds, taking adults as well as eggs and chicks (Gillies, 2001; Sanders and Maloney, 2002). Harriers are diurnal aerial predators. Ferrets are predators of birds and are nocturnal (Alterio and Moller, 1997; Clapperton, 2001), whereas stoats can be active at any time of the day (Alterio and Moller, 1997). Stoats were grouped with ferrets because they were caught in low numbers and are generally uncommon in the Mackenzie Basin except in the valleys of the Tasman and Godley Rivers (Keedwell and Brown, 2001). However, they are flexible and opportunistic in their diet and have been shown to be significant predators of birds in other habitats (King et al., 2001). Hedgehogs were caught in large numbers and are emerging as a significant nocturnal predator of native fauna (Berry, 1999; Moss and Sanders, 2001).
Data analysis
The data for the four groups of predators were analysed using the logistic regression procedure in SPSS 10 (Pallant, 2001). Variables or combinations of variables that might increase the probability of capturing target predator groups were identified. Logistic regression was chosen because the dependent variable, i.e. whether a predator was caught or not caught, is binary (Harraway, 1995). All variables were categorical except visibility of bait, which was continuous. Each trap was weighted by the number of times it caught a predator over the total number of nights it was set. If traps were moved more than 10 m they were considered as a separate trap site and coded accordingly.
Model development was carried out by entering groups of variables and using Akaike’s Information Criterion (AIC) as a guide to identifying the best model. Goodness of fit was assessed using the Hosmer and Lemeshow statistic: if the P value was greater than 0.05, there was no significant difference between the values predicted by the model and the observed values, suggesting the model fit the data well. Although the model with the lowest AIC included all the variables in all cases, the Hosmer and Lemeshow results also indicated that not all sub-variables were needed for a good fitting model when each level was compared with a reference category. We focus on those sub-variables that were significant.
When a variable was included into the model, the contribution of the sub-variables was identified by comparing each against a reference category (Harraway, 1995). For example, if “set type” was included in the model, comparisons indicated which set types were
more likely than others to catch predators. The effect of each sub-variable was examined by checking, for each comparison, the P value and 95% confidence interval (CI) for the odds ratio. If values within the 95% confidence interval were less than one then the sub-variable resulted in greater predator catch, whereas if values within the 95% confidence interval were greater than one then greater catch was associated with the reference category.
It was assumed that the probability of catching a predator did not change over the two years and at each trap site. The river valleys where predators are trapped are long linear features, and are surrounded by large areas from which new predators can quickly invade the vacated territories of trapped predators. Trap sites were also assumed to be independent. After a predator has been removed, new predators can move into the trapping zone from any point around the perimeter of the zone, i.e. a trap line on each side of the river. Therefore, whether a trap catches a predator is likely a reflection of where the predator enters the trapping zone, and over time all traps have equal opportunity to catch predators. Clapperton (2001) concluded that trapping of ferrets is ineffective as a long-term method due to immigration and compensatory survival and reproduction, and Moss (1999) suggested on the basis of a home range study, which found hedgehogs travelling large distances and entering trapped zones from surrounding areas, that in braided river habitat a buffer of more than 1500 m is needed to prevent re-invasion by adult male hedgehogs.
Results
Half (50.2%) of all trap sites failed to catch any predators; 28% caught only one, 9.4% caught two, and 11.8% caught between three and 21 predators.
Mustelids
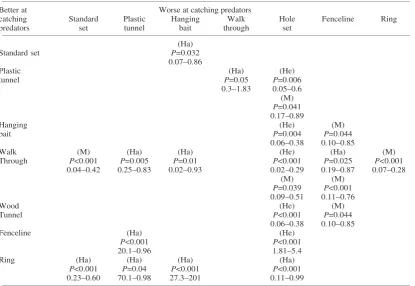
Table 2. Summary of significant comparisons between sub-variables and reference categories for set type, showing which of the pair were better/worse at catching each type of predator; for example, standard sets were better than hanging bait sets at catching harriers (P = 0.032). P values are given and 95% confidence intervals for the odds ratio. Ha = harrier; M = mustelid; He = hedgehog.
____________________________________________________________________________________________________________________________________
Better at Worse at catching predators
catching Standard Plastic Hanging Walk Hole Fenceline Ring
predators set tunnel bait through set
____________________________________________________________________________________________________________________________________
(Ha)
Standard set P=0.032
0.07–0.86
Plastic (Ha) (He)
tunnel P=0.05 P=0.006
0.3–1.83 0.05–0.6 (M) P=0.041 0.17–0.89
Hanging (He) (M)
bait P=0.004 P=0.044
0.06–0.38 0.10–0.85
Walk (M) (Ha) (Ha) (He) (Ha) (M)
Through P<0.001 P=0.005 P=0.01 P<0.001 P=0.025 P<0.001 0.04–0.42 0.25–0.83 0.02–0.93 0.02–0.29 0.19–0.87 0.07–0.28
(M) (M)
P=0.039 P<0.001 0.09–0.51 0.11–0.76
Wood (He) (M)
Tunnel P<0.001 P=0.044
0.06–0.38 0.10–0.85
Fenceline (Ha) (He)
P<0.001 P<0.001
20.1–0.96 1.81–5.4
Ring (Ha) (Ha) (Ha) (Ha)
P<0.001 P=0.04 P<0.001 P<0.001
0.23–0.60 70.1–0.98 27.3–201 0.11–0.99
____________________________________________________________________________________________________________________________________
predator focal area did better than those set far away (>200m; P = 0.026, CI range 0.016–0.89).
Hedgehogs
The model with the best fit for hedgehogs included all variables, with five contributing significantly: set type, backing, plate haze, habitat, predator focal area. Hedgehogs were caught in 35% of traps. Hole sets were least effective of all set types: the most effective were plastic and wooden tunnels, walk-throughs, fence-line and hanging bait sets (Table 2). Traps with a backing consisting of no barrier and a visible bait were least effective at catching hedgehogs (Table 4). Those more likely to make a capture had either no backing, or a barrier with either a hidden or visible bait. The plate haze of traps that caught hedgehogs consisted of vegetation rather than bare substrate (P = 0.016, CI range 0.44–0.92). Traps placed on river terraces caught more hedgehogs than those in stable riverbeds (P < 0.001, CI range 0.47–0.67), active riverbeds (P =
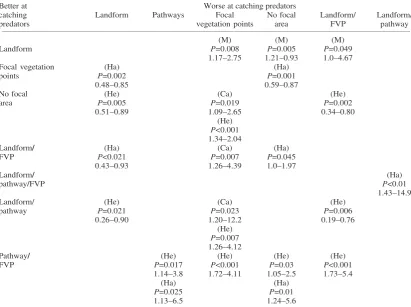
0.001, CI range 0.14–0.62) and swamps (P = 0.004, CI range 0.35–0.82). Traps placed in areas with no focal predator area, or on pathways associated with clumps of vegetation or along natural landforms caught more than those set in isolated clumps of vegetation on natural landforms or in combinations of these (Table 3).
Cats
focal vegetation points caught more cats than traps set in clumps of trees or shrubs (Table 3).
Harriers
The model with the best fit for harriers included all variables, with eight contributing in a statistically significant way: set type, trap haze, backing, plate haze, cover within 50 m, habitat, predator focal area and distance to the nearest predator focal area. Harriers were caught in 44% of all traps. Ring and walk-through sets were most effective at catching harriers, while hole sets and plastic tunnels were least effective (Table 2). Traps with a haze worked better than those with none (Table 4), and where hazes were present, those made of artificial materials were least effective. In contrast to hazes, traps with a backing made of artificial materials were more effective than natural
backings. Backings that left the bait visible caught more than those with a hidden bait (Table 4). The absence of a plate haze was better than a haze made of substrate (P = 0.048, CI range 1.01–2.79). Traps catching more harriers tended to be set in low cover within a 50-m radius (P = 0.004, CI range 0.38–0.84) and those set on stable river beds and river terraces caught more than those on active riverbeds (P = 0, CI range 1.66–6.12; P = 0.006, CI range 1.33–5.37, respectively) and swamps (P = 0, CI range 1.57–3.55;
P = 0.004, CI range 31.27–3.16, respectively). Traps placed close to clumps of vegetation, either on their own or associated with landforms and pathways, and some distance away (11–50 m; P = 0.005, CI range 0.62–0.92) from the nearest predator focal area were associated with more captures (Table 3).
Table 3. Summary of significant comparisons between sub-variables and reference categories for predator focal areas showing which of the pair were better/worse at catching each type of predator. For example, traps set on landforms were better at catching mustelids than traps set in focal vegetation points (P = 0.008). FVP = focal vegetation points. Ha = harrier; He – hedgehog; M = mustelid; Ca = cat
____________________________________________________________________________________________________________________________________
Better at Worse at catching predators
catching Landform Pathways Focal No focal Landform/ Landform/
predators vegetation points area FVP pathway
____________________________________________________________________________________________________________________________________
(M) (M) (M)
Landform P=0.008 P=0.005 P=0.049
1.17–2.75 1.21–0.93 1.0–4.67
Focal vegetation (Ha) (Ha)
points P=0.002 P=0.001
0.48–0.85 0.59–0.87
No focal (He) (Ca) (He)
area P=0.005 P=0.019 P=0.002
0.51–0.89 1.09–2.65 0.34–0.80
(He) P<0.001 1.34–2.04
Landform/ (Ha) (Ca) (Ha)
FVP P<0.021 P=0.007 P=0.045
0.43–0.93 1.26–4.39 1.0–1.97
Landform/ (Ha)
pathway/FVP P<0.01
1.43–14.9
Landform/ (He) (Ca) (He)
pathway P=0.021 P=0.023 P=0.006
0.26–0.90 1.20–12.2 0.19–0.76
(He) P=0.007 1.26–4.12
Pathway/ (He) (He) (He) (He)
FVP P=0.017 P<0.001 P=0.03 P<0.001
1.14–3.8 1.72–4.11 1.05–2.5 1.73–5.4
(Ha) (Ha)
P=0.025 P=0.01
1.13–6.5 1.24–5.6
Discussion
The number and type of trap site characteristics associated with higher rates of predator capture varied between the four predator groups. For all groups of animals, the way the trap was set and the trap’s placement in the landscape influenced its likelihood of capturing an animal. Plate haze and predator focal area characteristics influenced capture rates in all predator groups whereas set type, trap backing and habitat influenced capture rates in three groups. Studies on habitat use by predators and their prey can guide trappers as to where traps should be placed. The density and movements of cats, ferrets and harriers are likely to be largely dependent on the distribution and abundance of rabbits, which are most numerous in vegetated areas in the Mackenzie Basin, or in open riverbed sites adjacent to cover rather than distant from cover (Pascoe, 1995). In this study, most mustelids and harriers were caught in stable riverbeds. Pierce (1986) also trapped most predators along the side streams that form the stable riverbed, and fewest in swamps. Most captures of hedgehogs took place on the river terraces. A spool-and-line tracking study of hedgehogs in the Waitaki basin showed they preferred dense grassland,
characteristic of river terraces, which may support more invertebrate prey or provide more suitable nest sites (Parkes, 1975; Cassini & Foger, 1995; Shannahan, 2004). Captures of cats in all habitats suggests that cats may be least selective in their choice of habitat. In this study swamps were expected to have a low probability of capturing predators as one of the two sites has an enclosure around it.
Micro-scale features, such as pathways, ecotonal edges, fences, and clumps of vegetation within each habitat may also influence predator movements. Pierce (1996) suggested predators used dry vegetated banks of streams and ponds as natural pathways, which are also areas where kaki nest. Ferrets, which occur at a density of between two and five animals/km2 in the Mackenzie Basin (Moller et al., 1996), kept mainly to ecotonal edges and vegetation on the river flats, other than among willows, seldom moving onto the river gravel or on islands while foraging (A. Byrom, unpubl. data, cited in Clapperton, 2001). Shannahan (2004) found ferrets preferred high dense willow trees and medium to dense shrub areas to other habitat types.
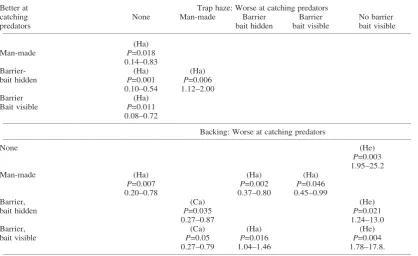
Norbury et al.’s (2002) analysis of a trapping data base from Otago and Southland suggested that linear features (e.g., fencelines, bush edges, waterways) were Table 4. Summary of significant comparisons between sub-variables and reference categories for trap haze and backing, showing which of the pair were better/worse at catching each type of predator. For example, traps with a man-made trap haze were better at catching harriers than traps with no trap haze (P = 0.018). Ha = harrier; He = hedgehog, Ca = cat.
____________________________________________________________________________________________________________________________________
Better at Trap haze: Worse at catching predators
catching None Man-made Barrier Barrier No barrier
predators bait hidden bait visible bait visible
____________________________________________________________________________________________________________________________________
(Ha)
Man-made P=0.018
0.14–0.83
Barrier- (Ha) (Ha)
bait hidden P=0.001 P=0.006
0.10–0.54 1.12–2.00
Barrier (Ha)
Bait visible P=0.011
0.08–0.72
____________________________________________________________________________________________________________________________________
Backing: Worse at catching predators
____________________________________________________________________________________________________________________________________
None (He)
P=0.003 1.95–25.2
Man-made (Ha) (Ha) (Ha)
P=0.007 P=0.002 P=0.046
0.20–0.78 0.37–0.80 0.45–0.99
Barrier, (Ca) (He)
bait hidden P=0.035 P=0.021
0.27–0.87 1.24–13.0
Barrier, (Ca) (Ha) (He)
bait visible P=0.05 P=0.016 P=0.004
0.27–0.79 1.04–1.46 1.78–17.8.
attractive to ferrets. This observation is supported in other studies. For example, in East Otago traps for ferrets placed along forest-pasture margins had higher encounter rates. If these ecotones were not present, ferrets were caught along areas of vegetation cover (Ragg and Moller, 2000). Baker (1989) reported a similar situation at Macraes Flat, where ferrets preferred to move along habitat features such as fence lines, stock tracks and boundaries between tussock grassland and pasture. Vegetation cover was the main determinant of ferret trapping success in North Canterbury farmland (Morley, 1999), and in coastal Otago, ferrets concentrated movements along tracks, avoiding areas of long rank grass (Moller et al., 1995). In her review, Clapperton (2001) concluded traps for ferrets should always be set under covers (tunnels) or in enclosed spaces to reduce bycatch, and beside linear features (fence lines, forest edges, waterways, roads and tracks), in isolated patches of cover, around farm buildings and offal pits or in areas of high prey abundance.
In contrast to studies indicating ferrets use fence-lines to travel, we found that traps set along fence fence-lines and in holes had relatively low capture rates of mustelids. Traps placed close to a predator focal area (0–10 m) did better than those placed further away (>200 m), and those set along a natural landform also appeared to be more effective than those placed within isolated clumps of vegetation or away from potential focal areas. This difference may reflect the relative paucity of tracks and fenceline type features in the Mackenzie Basin, compared to more intensely farmed sites in other locations. Two of the five variables that made a significant contribution to the model, set type and plate haze, were actual trap characteristics. Walk-through sets and tunnels were most effective at catching mustelids, reflecting their preference for hunting in holes, while fence-line, hole, standard and ring sets were least effective. More mustelids were caught in traps with no plate haze, and on stable river beds rather than swamps.
Hedgehogs have been trapped in many different vegetation types, both native and exotic (Pascoe, 1995; King et al., 1996; Berry, 1999; Moss, 1999, Jones et al. 2005). Although primarily insectivorous, eggshells, feathers and other bird remains were found in about 15% and 10% of hedgehog guts from the Mackenzie Basin (Moss, 1999; Jones et al., 2005). The potential impact of hedgehogs on individual species as well as ecosystems means they should be considered pest species (Berry, 1999; Moss, 1999; Jones et al., 2005). Observations from a video monitoring study indicated hedgehogs hunted during the night, using olfactory cues (Sanders and Maloney, 2002). Hedgehogs may also learn to link visual stimuli with food availability, and repeatedly return to a known food area (Cassini and Krebs, 1994). Although trapping in the Mackenzie
Basin was carried out in spring–summer to protect breeding birds, and hedgehogs were caught in large numbers, other studies suggest that hedgehogs are more likely to be captured in late summer–autumn when they are actively seeking food before hibernating (Parkes, 1975; Moss, 1999).
Most hedgehogs in this study were caught in traps set on the river terraces. Hedgehogs rely on invertebrate prey, which is more likely to be abundant on the grasslands of the river terraces. Hedgehogs tended to be caught more in traps set along pathways or in areas with no focal area, rather than along natural landforms and within focal vegetation points. Three of the five variables significantly influencing the likelihood of hedgehog capture were trap characteristics: set type, plate haze and backing. Least effective sets were hole sets, followed by standard, then post-top sets. Vegetation was a better plate haze than substrate, and the least effective trap backing consisted of a visible bait and no barrier.
Feral cats are notoriously difficult to trap and do not take baits readily (Risbey et al., 1997). In this study the overall capture rate of cats was the lowest (9%) of the predator groups. Molsher (2001) found that factors affecting trapping efficiency included cat density, trap type, trapper experience, season, prey abundance and proximity to human settlement. Cats at Macraes Flat travelled on pathways made by stock, along fence lines, four-wheel drive tracks, and linear perimeters, such as tussock-pasture interfaces (Baker 1989). However, in coastal Otago cats did not use the fringes of vegetation buffer zones any more than core areas (Alterio et al., 1998).
Capture rates suggested cats avoided focal vegetation points, and were more likely to be caught along natural landforms. Two of the three significant variables in the model were trap characteristics: plate haze and backing. Any kind of set appeared to catch cats, but the most effective backing included a barrier made out of natural material rather than artificial material, suggesting a wariness of artificial objects. This wariness may vary depending on whether cats are truly feral or are coming from nearby farms. Traps used at Macraes Flat to catch cats incorporated an artificial metal backing (YvH., personal observation) but may have been catching a greater proportion of feral cats from surrounding farms that are more tolerant of artificial objects in their environment. The most effective plate haze was vegetation.
stable river beds where rabbit densities are highest (Pascoe, 1996), within 50 m of low cover, and placed some distance away from the nearest predator focal area (11–50 m c.f. 0–10 m). Traps placed within isolated clumps of vegetation were most successful, whether these were on their own or associated with a natural landform or pathway.
Four significant variables in the harrier model related to the way the trap was set: set type, plate haze, trap haze, backing. The set types that were not successful at catching harriers were hole sets, tunnels and hanging baits. Harriers would be unlikely to enter a tunnel, although two captures were recorded in plastic tunnels. Ring sets, followed by standard sets, walk-through and fence-line sets were most effective. Ring sets were aimed specifically at aerial predators. While two of the most effective sets had no backing or trap haze (rings and walk-throughs) harriers were also caught in other set types that did have a backing and trap haze. For these set types some sort of trap haze was better than none, and a haze with the bait hidden was better than an artificial haze. Traps with an artificial backing caught more birds than those with no backing or with a barrier, and among those traps with a barrier in the backing, those with a visible bait caught more than those with a hidden bait. Traps with no plate haze caught more than those with substrate as a haze.
Adaptive management is management with a deliberate plan for learning about the managed system, so that management can be improved in the face of uncertainty (Shea et al., 2002). When dealing with endangered species, it is often difficult to convince managers of the value of controlled experiments, which have the potential to answer questions about management techniques most directly and unequivocally. When working in the field to specific management objectives it is also difficult to control for all variables and replicate adequately. The primary objective of the management in this study was to protect kaki from predation, and the secondary objective was to understand trapping efficacy. Hence this study was a compromise, involving the collection of comprehensive data and the setting of some standard protocols. Consequently, there are some difficulties in interpretation that relate to unbalanced sample sizes and sub-variable combinations. For example, the frequency with which different set types were used varied widely, with standard sets used on more than a thousand nights, while post-top sets were only used on five trap nights, rendering statistical comparisons less powerful. The variable “predator focal areas” is difficult to interpret, due to multiple combinations of sub-variables. When this information was collected a number of sub-variables were established that proved to be too numerous for statistical analysis. Consequently these were collapsed into fewer sub-variables, but this
rendered the interpretation of the results very difficult. Future studies should aim for a more balanced design (i.e., similar sample sizes across sub-variables), and fewer variables and sub-variables.
It is possible that trapper bias has influenced our results. Trappers were encouraged to move traps within trap lines but not out of the area. In fact most did not move traps at all due to time constraints. Only half the traps caught more than one predator and these traps were not associated with any one trapper. Weather conditions could influence trapping success if some set types performed better under certain conditions. Weather could affect the persistence of the bait, or the persistence of residual scents from animals captured previously. We did not record weather, as the time frame of the study was such that all traps were exposed to a wide variety of weather conditions, and subject to the same weather conditions at any one time. The possibility that residual scent of a captured animal could attract or repel predators is as yet untested, but deserves careful and rigorous study.
This systematic collection of trap site data has indicated that both trap characteristics and their placement within the landscape will influence the likelihood of making captures. It has also improved our understanding of which features of traps and landscapes are associated with more captures for each predator. Consideration of this information when trapping should result in less wasted effort. Predators may behave differently in different habitats, and further systematic studies of trapping efficacy are required to confirm whether this is the case. The importance of the variable “predator focal area” in influencing captures in all groups suggests a greater understanding of predator movements and home range use at a micro-scale could improve predator control operations.
Acknowledgements
We would like to thank Peter Cook who ran the trapping sessions and recorded all environmental data. Thanks to all the trappers: H. Addison, I. Andrews, J. Dodds, G. Freeman, A. Middlemiss, H. Osbourne, E. Rodgers, P. Stewart and J. Young; to landowners for permission to work on their properties; and to the University of Otago for providing funding the analysis and writing of this paper.
References
Zealand Journal of Ecology 21: 89-95.
Alterio, N.; Moller, H.; Ratz, H. 1998. Movements and habitat use of feral house cats Felis catus, stoats
Mustela erminea and ferrets Mustela furo, in grassland surrounding yellow-eyed penguin
Megadyptes antipodes breeding areas in spring.
Biological Conservation 8: 187-194.
Baker, G. 1989. (unpublished) Aspects of mammalian predator ecology co-inhabiting giant skink habitat. MSc thesis, University of Otago, Dunedin, N.Z. 97 pp.
Baker-Gabb, D.J. 1981. The diet of the Australasian harrier (Circus approximans) in the Manawatu-Rangitikei sand country, New Zealand. Notornis 28: 241-254.
Berry, C.J.J. 1999. (unpublished) European hedgehogs (Erinaceus europaeus L.)and their significance to the ecological restoration of Boundary Stream Mainland Island, Hawkes Bay. M. Con. Sci. thesis, Victoria University, Wellington, N.Z. 129 pp. Cameron, B. 2002. (unpublished) Analysis of
environmental data of predator traps for the kaki (black stilt) recovery programme, Twizel. Wildlife Management Report No. 142, University of Otago, Dunedin. 20 pp.
Cassini, M.H.; Krebs, J.R. 1994. Behavioural responses to food addition by hedgehogs. Ecography 17:
289-296.
Cassini, M.H.; Föger, B. 1995. The effect of food distribution on habitat use of foraging hedgehogs and the ideal non-territorial non-despotic distribution. Acta Oecologia 16: 657-669. Clapperton, B.K., 2001. Advances in New Zealand
mammalogy 1990–2000: Feral ferret. Journal of the Royal Society of New Zealand 31: 185-203. Connor, H.E. 1964. Tussock grassland communties in
the MacKenzie Country, South Canterbury, New Zealand. New Zealand Journal of Botany 2: 325-351.
Cook, P.; Maloney, R. 1999. (unpublished) Black stilt predator control report: 1998/99 breeding season. Black Stilt Project Internal Report Number 99/03, Department of Conservation, Twizel, N.Z. 15 pp. Cook, P.; Maloney, R.; Murray, D. 2000a. (unpublished) Kaki project predator control in the 1999/00 year. Kaki Project Internal Report Number 00/01, Department of Conservation, Twizel, N.Z. 17 pp.
Cook, P.; Maloney, R.; Murray, D.; Woolhouse, A.D. 2000b. (unpublished) Relative effectiveness of fresh rabbit meat, and visual and olfactory lures in catching predators of kaki (Himantopus novaezelandiae). Kaki Project Internal Report No. 00/09. Department of Conservation, Twizel, N.Z. 11 pp.
Cook, P.; Maloney, R. 2001. (unpublished) Kaki
predator control and research report: March 2000 to February 2001. Kaki Project Internal report 01/ 04, Department of Conservation, Twizel, N.Z. 11 pp.
Côté, I.M.; Sutherland, W.J. 1997. The effectiveness of removing predators to protect bird populations.
Conservation Biology 11: 395-405.
Fitzharris, B.B.; Mansergh, G.D.; Soons, J.M. 1992. Basins and lowlands of the South Island. In: Soons, J.M.; Selby, M.J. (Editors), Landforms of New Zealand, pp. 407-423. Longman Paul, Auckland, New Zealand. 531 pp.
Gillies, C. 2001. Advances in New Zealand mammalogy 1990-2000: House cat. Journal of the Royal Society of New Zealand 31: 205-218. Harraway, J. 1995. Regression methods applied.
University of Otago Press, Dunedin, N.Z. 334 pp. Jones, C.; Moss, K.; Sanders, M. 2005. Diet of hedgehogs (Erinaceus europaeus) in the upper Waitaki basin, New Zealand: implications for conservation. New Zealand Journal of Ecology 29: 29-35.
Keedwell, R.J.; Brown, K.P. 2001. Relative abundance of mammalian predators in the upper Waitaki Basin, South Island, New Zealand. New Zealand Journal of Zoology 28: 31-38.
Keedwell, R.;Maloney, R.; Murray, D. 2002. Predator control for protecting kaki (Himantopus novaezelandiae)—lessons from 20 years of management. Biological Conservation 105: 369-374.
King, C.M. 1994. Monitoring and control of mustelids on conservation lands. Part 1. Planning and assessing an operation. Technical Series No. 3, Department of Conservation, Wellington, N.Z. King, C.M.; Innes, J.G.; Flux, M.; Kimberley, M.O.;
Leathwick, J.R.; Williams, D.S. 1996. Distribution and abundance of small mammals in relation to habitat in Pureora Forest Park. New Zealand Journal of Ecology 20: 215-240.
Maloney, R.; Murray, D.; Cook, P. 1999. (unpublished)
Black stilt project predator strategy: 1999-2001. Black Stilt Project Internal Report 99/02, Department of Conservation, Twizel, N.Z. 10 pp. Maloney, R.; Murray, D. 2002. (unpublished) The Kaki Recovery Plan. Department of Conservation, Wellington, N.Z. 19 pp.
Moller, H.; Ratz, H.; Alterio, N. 1995. (unpublished)
Protection of yellow-eyed penguins from predators. WWF-NZ Final Report. Wildlife Management Report No. 65, University of Otago, Dunedin, N.Z. 56 pp.
Molsher, R.L. 2001. Trapping and demographics of feral cats (Felis catus) in central New South Wales. Wildlife Research 28: 631-636.
Moorhouse, R.; Greene, T.; Dilks, P.; Powlesland, R.; Moran, L.; Taylor, G.; Jones, A.; Knegtmans, J.; Wills, D.; Pryde, M.; Fraser, I.; August, A.; August, C. 2003. Control of introduced mammalian predators improves kaka Nestor meridionalis
breeding success: reversing the decline of a threatened New Zealand parrot. Biological Conservation 110: 33-44.
Morley, C.G. 1999. (unpublished) The ecology and behaviour of feral ferrets (Mustela furo) in farmland habitat in Canterbury, New Zealand. PhD thesis, University of Canterbury, Christchurch, N.Z.
Moss, K.A. 1999. (unpublished) Diet, nesting behaviour and home range of the European hedgehog (Erinaceus europaeus) in the braided riverbeds of the Mackenzie Basin, New Zealand. MSc thesis, University of Canterbury, Christchurch, N.Z. 78 pp.
Moss, K.; Sanders, M. 2001. Advances in New Zealand mammalogy 1990-2000: Hedgehog. Journal of the Royal Society of New Zealand 31: 31-42. Norbury, G.; Spencer, N.; Webster, R.; Bailey, J.;
Walker, R.; Wilson, R.; Hunter, M.; Reed, C. 2002. (unpublished) Best-practice trapping of ferret populations. Landcare Research Contract Report LC 0001/140, Landcare Research, Lincoln, N.Z. 20 pp.
Pallant, J. 2001. SPSS survival manual: a step by step guide to data analysis using SPSS (version 10). St Leonards, N.S.W., Australia. 286 pp.
Parkes, J. 1975. Some aspects of the biology of the hedgehog (Erinaceus europaeus L.) in the Manawatu, New Zealand. New Zealand Journal of Zoology 2: 463-472.
Pascoe, A. 1995. (unpublished) The effects of vegetation removal on rabbits (Oryctolagus cuniculus) and small mammalian predators in braided riverbeds of the Mackenzie Basin. M.Sc. Thesis, University of Otago, Dunedin, N.Z. 118 pp.
Pierce, R.J. 1986. Differences in susceptibility to predation during nesting between pied and black stilts (Himantopus spp.). Auk 103: 273-280. Pierce, R.J. 1987. (unpublished) Predators in the
Mackenzie Basin: their diet, population dynamics and impact on birds in relation to the abundance and availability of their main prey (rabbits).
Wildlife Service Report, Wellington, N.Z. 110 pp.
Pierce, R.J. 1996. Ecology and management of the black stilt Himantopus novaezelandiae. Bird Conservation International 6: 81-88.
Pierce, R.J.; Maloney, R.F. 1989. Responses of harriers in the Mackenzie Basin to the abundance of rabbits.
Notornis 36:1-12.
Pierce, R.J.; Westbrooke, I.M. 2003. Call count responses of North Island brown kiwi to different levels of predator control in Northland, New Zealand. Biological Conservation 109: 175-180. Ragg, J.R.; Moller, H. 2000. Microhabitat selection by feral ferrets (Mustelo furo) in a pastoral habitat, East Otago, New Zealand. New Zealand Journal of Ecology. 24: 39-46.
Ricklefs, R.E. 1969. An analysis of nesting mortality in birds. Smithsonian Contributions to Zoology9:
1-48.
Risbey, D.A.; Calver, M.; Short, J. 1997. Control of feral cats for nature conservation. I. Field tests of four baiting methods. Wildlife Research 24: 319-326.
Sakomoto, Y.; Ishiguro, M.; Kitagawa. G. 1987. Akaike information criterion statistics. Kluwer Academic Publishers, Dordrecht, The Netherlands. Sanders, M.D.; Maloney, R.F. 2002. Causes of mortality
at nests of ground-nesting birds in the upper Waitaki Basin, South Island, New Zealand: a five-year video study. Biological Conservation 106:
225-236.
Shea, K.; Possingham, H.P.; Murdoch, W.W.; Roush, R. 2002. Active adaptive management in insect pest and weed control: intervention with a plan for learning. Ecological Applications 12: 927-936. Shannahan, D. 2004. (unpublished) Quantifying
fine-scale habitat use by ferrets and hedgehogs in New Zealand using very-high-resolution satellite imagery and GPS data. MSc thesis, University of Otago, Dunedin, N.Z. 104 pp.
Walker, S., Lee, W.G., Rogers, G.M. 2003. Post-pastoral succession in intermontane valleys and basins of eastern South Island, New Zealand. Science for Conservation 227. Department of Conservation, Wellington, N.Z. 74 pp.
Webb, T.H. 1992. Soils of the Upper Waitaki Basin, South Island, New Zealand. DSIR Land Resources Scientific Report Number 3, DSIR Land Resources, Lower Hutt, N.Z. 99 pp.