www.nat-hazards-earth-syst-sci.net/11/1609/2011/ doi:10.5194/nhess-11-1609-2011
© Author(s) 2011. CC Attribution 3.0 License.
and Earth
System Sciences
Kinematics of a mass movement constrained by sparse and
inhomogeneous data
M. Karbon1, E. Br ¨uckl1, E. Heged ¨us2, and A. Preh3
1Institute of Geodesy and Geophysics, Vienna University of Technology, Vienna, Austria 2E¨otv¨os Lor´and Geophysical Institute, Budapest, Hungary
3Institute of Geotechnics, Vienna University of Technology, Vienna, Austria
Received: 20 November 2009 – Revised: 9 November 2010 – Accepted: 28 April 2011 – Published: 6 June 2011
Abstract. On 12 February 2008, a landslide occurred along a 50 m high bank of the Danube river near Dunaszekcs¨o, Hungary. The initial state is only incompletely documented and the geodetic data acquired after the mass movement are sparse. A generalized 3-D topographic model of the land-slide and its surrounding area was assembled and a repre-sentative longitudinal profile extracted. The reconstruction of the original surface is based on an orthophoto as well as on morphological considerations. Recorded observations in-clude the locations of the outcrops of basal sliding surfaces, displacements at the main scarp and in the lower part of the slide, and a value to describe the total mass transport. Such sparse and inhomogeneous data were insufficient to derive a comprehensive documentation of the landslide or obtain ad-equate constraints for an accurate numerical analysis. There-fore, slider block models were fitted to the field data, which have only a small number of free parameters. A general view on the morphology of the mass movement justifies its classi-fication as a rotational slide. A double slider block model fits all observational parameters within their error margin and supplies valuable information on the geometry of the slide. Estimates of the residual friction angles were derived and the question of reactivation was addressed. Finite Dif-ference (FD) modelling and the application of conventional stability analysis support the geometry of the slider blocks and the computed average residual friction angles. Generally, the results are assumed to represent preliminary information, which could only be attained by the combination of the thinly distributed geodetic data with qualitative morphological ob-servations and the implementation of a model. This type of
Correspondence to: E. Br¨uckl ([email protected])
information can be gained quickly and may be valuable for preliminary hazard mitigation measures or the planning of a comprehensive exploration and monitoring program.
1 Introduction
When analysing the kinematics of mass movements, experts are frequently confronted with the situation that only sparse, incomplete, and inhomogeneous field data are available. At first glance, predicting the development of mass movements, estimating the actual hazard, and planning proper mitigation measures appears very difficult or even impossible. This sit-uation may be typical for remote areas or developing coun-tries. But even in highly developed regions, basic data may not be available for a comprehensive geologic-geotechnical study. In particular, there may be a lack of accurate docu-mentation of the topography before the initiation of the mass movement in the form of topographic maps and aerial photos, geological maps and borehole profiles, geophysical investi-gations, geotechnical tests or samples, and – last but not least – a documentation of the movements over time by geode-tic measurements. However, even under such unfavourable circumstances, consultants and authorities are forced to take measures for the safety of inhabitants and infrastructure and to plan sound and effective monitoring and further explo-ration.
exploited if either good field data are available to constrain the model, or there is time and financial support to carry out multi-dimensional parameter studies. In case of incomplete field data and suitable geological conditions, the application of simple mechanical models with only very few degrees of freedom may be an alternative or first step to achieve a better understanding of the mass movement and to support hazard estimation and mitigation. The slider block model belongs to this family of mechanical models. Slider block models consist of a rigid moving mass and the entire shear deforma-tion concentrates at a plane or circular basal sliding surface (Turcotte and Schubert, 2002). It can be applied to rotational rock or earth slides according to the definition by Cruden and Varnes (1996). Studies based on these models have con-tributed considerably to the understanding of the mechani-cal processes taking place during an earthquake at an active tectonic fault (Turcotte and Schubert, 2002, and references therein). Slider block models were also successfully applied to mass movements to analyse the development of friction at the basal sliding surface and slope failure (Helmstetter et al., 2004; Br¨uckl and Parotidis, 2005; Van Asch and Malet, 2009).
This study concerns a mass movement at the right river bank of the Danube at Dunaszekcs¨o, where field data were acquired by the lead author (Maria Karbon) in the context of a diploma thesis in cooperation with ELGI (E¨otvos Lor´and Geofizikai Int´ezet). The time and financial scope for the data acquisition were very limited, hence the kinematics of the mass movement could only be constrained by sparse and in-homogeneous data. The goal of this study is to explore if the application of a simple mechanical model to this data can result in reliable information on the depth and extent of the mass movement and support mitigation measures, guide fur-ther exploration and supply a starting model for detailed nu-merical studies.
2 Study area and observational data
At Dunaszekcs¨o, Hungary, 20 km north of the border to Ser-bia and Croatia, on the right bank of the Danube river is formed by an approx. 50 m high steep cliff of loess layers with brown to red fossil soils accumulated during the Pleis-tocene (Fig. 1). These strata rest on clayey and sandy lay-ers formed during the Pannon epoch of the Upper Miocene – Pliocene (Kraft, 2005; G´abor et al., 2009). On 12 Febru-ary 2008, a slope collapse occurred in this area over a dis-tance of 220 m along the river bank, destroying one farm house and endangering several others nearby. An approx. 10 m high scarp was generated on top of the slope. The river bed in front of the collapsing slope rose above water level, thus forming a visible bulge protruding nearly 40 m from the original bank into the river. Deep cracks visible on the plain behind the main scarp indicate a continuing hazard for the nearby buildings and infrastructure due to a retrogressive
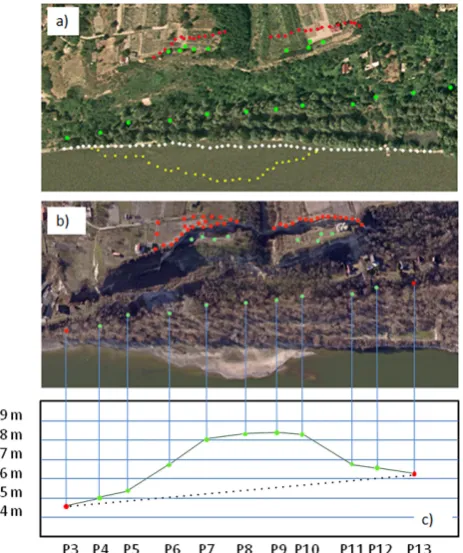
Fig. 1. Location of the landslide at the Danube river, near Dunaszekcs¨o, Hungary.
landslide. Furthermore, the newly generated bulge on the bed of the Danube represents an obstacle for shipping traffic.
The pre- and post-landslide morphologies are documented by an orthophoto and an oblique aerial photo (Fig. 2a and b), respectively. In this latest document, the recently gener-ated bulge in the Danube river is clearly visible. The river bank shows no significant deformation, thus indicating that the bulge in the river was generated by an upward movement of the river bed.
By means of orthorectification, the bulge and embankment limits were transferred from the oblique photo, bearing in mind the inevitable approximations (Fig. 2a).
Geodetic measurements were carried out from 1– 6 April 2008, using a total station with integrated GNSS (Global Navigation Satellite System). At the time of this field survey, the displacement rate of the landslide decreased to levels not perceptible by the human eye without instruments (most probably below 1 mm day−1). The geodetic data de-fine the main scarp and the general topography of the ter-rain behind it not affected by the landslide. The location of the measurement points is shown in Fig. 2a and b. By means of these data and the post-landslide aerial photos, the main scarp was mapped to the orthophoto of the initial state (Fig. 2a). Two major sliding and rotating blocks can be iden-tified on the photo of the landslide (Fig. 2b). The surface of these blocks, which apparently behaved as rigid bodies, was mapped by reflectorless geodetic methods.
Fig. 2. The landslide on the right river bank of the Danube river,
near Dunaszekcs¨o; red dots are geodetic measuring points outside the slide, green dots are geodetic measuring points on the slide;
(a) Orthophoto of the initial state before the slide; yellow dots mark
the extent of the bulge in the Danube river generated by the mass movement; (b) on oblique aerial photo of the situation after the slide; (c) elevations along a geodetic profile at the originally flat river bank.
correlates with the bulge in the Danube river. As it is as-sumed that the original surface of the embankment should be approximately flat, the observed deviation from a straight line connecting the endpoints of the profile is considered as a consequent uplifting due to the landslide movement.
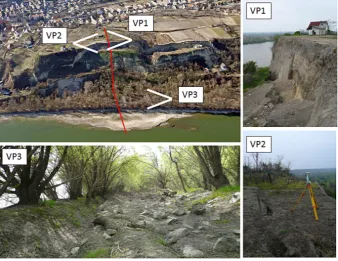
Several terrestrial photos show significant geomorpho-logic features (Fig. 3). Viewpoint 1 shows the approximately vertical main scarp. Behind the main scarp, there are ten-sional cracks with up to 0.2 m width (viewpoint 2). The depth of these cracks may exceed 5 m. Most probably the actual basal sliding surface developed from such a near vertical ten-sional crack. This observation may also be an indication for a further retrogressive development of the landslide. A small but visible vertical misalignment along the crack shown by viewpoint 2 and other tensional cracks observed behind the main scarp supports this assumption.
A second deformation zone at the river bank, situated about 20 m from the main uplift, was located by means of terrestrial photos (Fig. 3; viewpoint 3). These bulges cor-respond to the uplift zone derived from the geodetic mea-surements (Fig. 2c). The morphological pattern indicates
compressional deformation and uplift. The inclination of several trees may be a sign for back rotation. The front of this zone is interpreted as the outcrop of a possible secondary sliding plane.
High uncertainty is inherent in the mapping of the frontal bulge in the Danube river. The surface of the bulge was not accessible to geodetic measurements, but was roughly esti-mated from the aerial photos and its elevation above water level was approximated during a visual inspection.
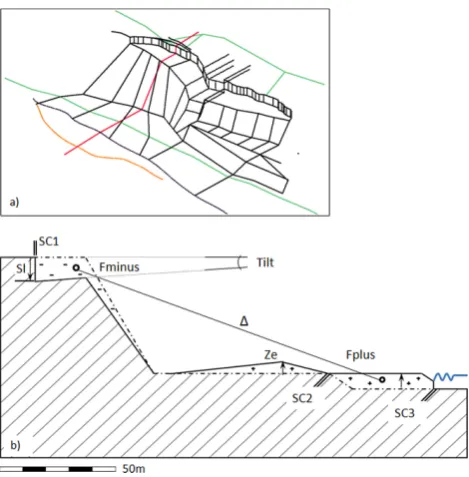
Based on geodetic data and aerial photos, a 3-D model of the landslide was constructed (Fig. 4a). A significant longitu-dinal profile, starting from the area behind the main scarp and stretching up to the furthest point of the bulge in the Danube river was derived from this 3-D model (Fig. 4b). The pre-landslide topography was reconstructed by back-rotation of the uppermost blocks and fitting them to the plain behind the main scarp. In the lower part of the landslide, a plain river bank as shown in Fig. 2c is assumed. A flat zone ex-tends at the landslide toe as shown in the Fig. 2c. Concern-ing the original river bed, there is considerable uncertainty. There was no possibility to carry out direct measurements of the undisturbed river bed close to the landslide. Therefore a normal cross section of the Danube river bed is assumed. These data are supplied by navigation authorities (Viadonau – ¨Osterreichische Wasserstraßen Gesellschaft, personal com-munication, 2008). At the time of the collapse of the cliff, February 2008, the water level of the Danube river was high, most probably at the level shown in Fig. 4b.
In order to constrain a mechanical model of the land-slide, the following morphological features and observa-tional quantities were extracted from the longitudinal profile (Fig. 4b):
– Location of the main scarp (SC1) representing the out-crop of the basal sliding surface on top of the landslide. – Location of the edge of the bulge in the Danube river (SC3) representing the distal outcrop of the basal sliding surface.
– Location of the front of the deformation zone at the river bank (SC2) representing the distal outcrop of a sec-ondary sliding surface.
– Angle of rotation of the uppermost sliding block (Tilt). – Total displacement (Lagrangian displacement) at the
main scarp (Sl).
– Vertical displacement (Eulerian displacement) at the river bank (Ze).
– Ablation (removal of landslide material) in the upper part of the landslide (Fminus).
Fig. 3. Morphological features documented by terrestrial photos; viewpoint 1: the main scarp; viewpoint 2: tension cracks behind the main
scarp; viewpoint 3: deformation zone at the river bank, indicating a second sliding plane; Red line in overview marks the profile used for 2-D interpretation.
– Distance between the centres of gravity for Fminus and Fplus (1).
Assuming the displacement vectors of the landslide body are confined to the aforementioned cross section (Fig. 4b) and the density is constant, the condition Fminus = Fplus can be regarded as valid. In fact, this condition is well met by our data. The average of Fminus and Fplus times1defines the dipole moment (M), which represents the overall mass trans-port caused by the landslide. The landslide observational data are shown in Table 1. The uncertainties regarding the observational data were estimated not only considering the observational errors (e.g. the accuracy of the geodetic mea-surement), but also the degree to which the 2-D profile rep-resents the real 3-D situation in the central part of the mass movement.
In order to study the evolution of the embankment fail-ure along the river Danube at Dunaszekcs¨o, GPS and tilt-meter monitoring data (from September 2007 to end of March 2008), were obtained by Gabor et al. (2009). This data became available after completion of the data acquisition and evaluation described in this study. Information about the de-formations during the main slide is mainly redundant in the scarp area. However, no further constraints on the kinematics of the mass movement in its distal part at the river bank are given.
3 Modelling kinematic observations by rotational slider blocks
The stability analysis of soil or rock masses sliding over pla-nar or circular surfaces has a long tradition (Duncan, 1996). Bishop (1955) divided the moving mass into slices separated by vertical boundaries and developed the equation of equi-librium between driving gravitational and resisting frictional forces. The individual slices are assumed to be rigid and shear strain concentrates on the basal sliding surface. The cohesion and friction angles are the main shear strength pa-rameters controlling stability. The effect of basal pore pres-sure on basal friction is also considered.
A rotational slider block model which was applied, for ex-ample, by Br¨uckl and Parotidis (2005) to analyse the tempo-ral development and possible transition to the tertiary creep of deep seated gravitational creep at high mountain slopes, represents a further simplification or generalization. It can be seen as a single slice in the sense of Bishop (1955). This simple model may be useful for the description of kinemat-ics and dynamkinemat-ics of a landslide which fits a type of rotational slide, either in rock or soil (Cruden and Varnes, 1996).
Table 1. Observations (Data-obs.), observational errors, and calculated data for single and double slider block models.
Data-obs. Error Data-calc. Data-calc. (stdev) Single block Double block
Displacement at scarp (Sl) 9.3 m 1 m 9.5 m 9.0 m
Rotation below scarp (Tilt) 6◦ 1◦ 6◦ 7◦
Uplift at river bank (Ze) 2.6 m 0.5 m 0.3 m 2.1 m
Ablation area (Fminus) 279 m2 – – –
Accumulation area (Fplus) 264 m2 – – –
Distance between ablation and accumulation areas (1) 111 m – – –
Moment (M) 30 140 m3 4000 m3 30 620 m3 30 350 m3
Fig. 4. Geometric models; (a) generalized 3-D model, main
geode-tic profiles (green), front of the bulge in Danube river (yellow);
(b) representative longitudinal profile, the location is shown as a
red line in Fig. 4a; SC1, SC2; SC3 are scarps and outcrops of slid-ing planes, Fminus and Fplus are ablation and accumulation areas, Sl is a Lagrangian movement at the main scarp, Tilt is the angle of rotation of the uppermost sliding block, Ze is a Eulerian uplift at the river bank, the water level of Danube river is the blue wiggly line.
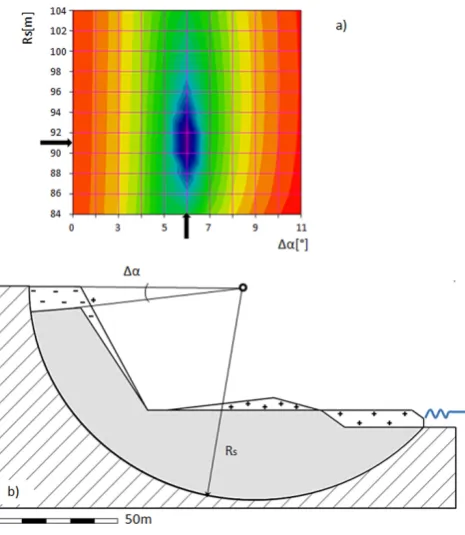
The determination of the centre of gravity is based on the as-sumption of constant density. The coordinates of the centre of rotation (Xr, Zr) cannot be chosen arbitrarily. A circular sliding surface is constrained by the main scarp on top (SC1 in Fig. 4b) and its outcrop at the distal front of the sliding mass (SC3 in Fig. 4b). The centre of rotation must be located on the symmetry axis of the straight line connecting the main scarp and the distal outcrop of the sliding surface. The centre of rotation (Xr, Zr) is therefore given by Rs (Fig. 5a). Given the topography and the circular sliding surface, the centre of
gravity of the sliding mass can be calculated and Rg deter-mined. Density variations are neglected for this calculation. The cross-sectional areas and the coordinates of the centres of gravity were calculated for each radius Rs by a formula given for a sector of a circle and polygons (e.g. B¨oge, 2007). The initial position of the slider block is given by the angle
α0, the rotation or movement during the slide is termed 1α. The angles α0 and 1αdescribe the initial orientation and rotation of a pendulum with length Rg pointing from (Xr, Zr) to the centre of gravity (Fig. 5a).
The observational quantities described in the previous chapter can be modelled by a rotational slider block in the following way:
Tilt=1α (1)
Sl=Rs·1α (2)
Ze=Rp·1α·(sin(α(p)− cos(αp)·tan(γp)) (3)
M=Fminus+Fplus
2 ·1=F·Rg·1α (4)
Equation (3) for the Eulerian vertical displacement is ex-plained in Fig. 5b. Rp andαpare the radius and its angle to the point of Eulerian vertical displacement. γpis the slope at this point. Equations (2), (3), and (4) are approximations for small angles of rotation (1α). The length of a chord is replaced by the length of the circular arc.
The front of the deformation zone at the river bank is in-terpreted as the distal outcrop of a secondary sliding sur-face (SC2). This secondary sliding sursur-face is further strained by the location of the main scarp SC1 and the con-dition that the secondary sliding surface is tangent to the pri-mary one at SC1. Given the pripri-mary sliding surface, the secondary sliding surface is completely determined by these constraints. The remaining free parameters are the angle of rotation of the initial slide (1α1) and the additional rotation of the secondary slide (1α2). For the double slider block model, the observational data are described by the following equations:
Fig. 5. (a) Main parameters of rotational slider block model: centre of gravity (S), radius to centre of gravity (Rg), radius to sliding surface (Rs), initial sliding angle (α0), rotation during slide (1α); (b) sketch visualizing the calculation of the Eulerian vertical movement at point P: radius (Rp) and angle (αp) to P, surface slope (γp), uplift at P (Ze).
Sl=Rs·1α1+Rs2·1α2 (6)
Ze=Rp·1α1·(sin(αp)−cos(αp)·tan(γp))... (7) +Rp2·1α2·(sin(αp2)−cos(αp2)·tan(γp))
M=A·Rg·1α1+A2·Rg2·1α2 (8)
4 Inversion
In order to fit a single (primary) rotational slider block model to the observational quantities Tilt, Sl,Z, andM, two free parameters, Rs and1α, must be chosen accordingly. An L2-norm describing the fit of observed and calculated parameters is defined by Eq. (9):
L2=
Tilt−TiltC ErrorTilt
2 +
Sl−SlC ErrorSl
2 +
Ze−ZeC ErrorZ
+
M−MC ErrorM
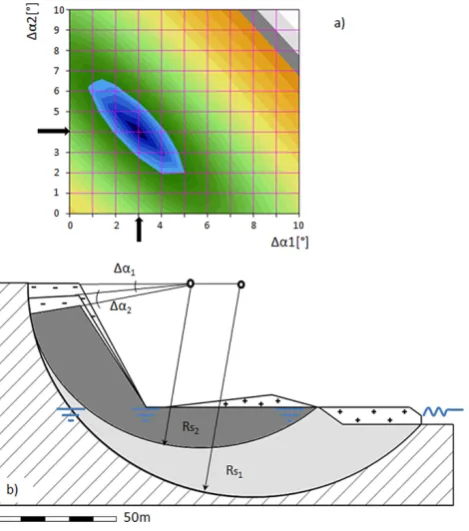
(9) Calculated values (Eqs. 1–4) are characterized by the suf-fix “c”. The residuals are weighted by the corresponding in-verse of the error (column 3 in Table 1). A 2-D grid search was carried out varying Rs and1αin the ranges of (84 m, 104 m) and (1◦, 11◦), respectively, to find the minimum of the L2-norm. Initial tests showed that the single slider block model cannot explain the uplift (Ze) at the Danube river bank within reasonable ranges of Rs and1α, because the center of rotation is located approximately above. Therefore the observation Ze was not used to constrain the single block model further and the third term on right side of Eq. (9) was removed. The remaining L2-norm over the selected ranges of Rs and 1α is plotted in Fig. 6a. The colour coding is logarithmic. Absolute values of the L2-norm are not essen-tial, because only the minimum is required. A significant and unique minimum can be found at Rs = 91 m and1α= 6◦. The rotational slider block model defined by these parame-ters is shown in Fig. 6b. The calculated observational quan-tities are compiled in Table 1, column 4.
Fig. 6. Single slider block model. (a) Grid search for optimum
parameters: L2-norm for different radii to sliding plane (Rs) and rotation angle (1α), the minimum is marked by arrows; (b) the optimum single slider block model.
Fig. 7. Double slider block model. (a) Grid search for optimum
parameters: the L2-norm for different rotation angles (α1,α2)of the primary and secondary slider blocks plotted, the minimum is marked by arrows; (b) the optimized double slider block model, blue lines mark the water table.
and the additional rotation of the secondary slide (1α2). The angles1α1 and1α2 are related to the observational quan-tities Tilt, Sl,Z, andMby Eqs. (5–8). A grid search in the range (0◦, 10◦) for 1α1 and1α2 was carried out for the complete L2-norm (Eq. 9), including also the term for Ze. A unique and significant optimum was found at1α1 = 3◦and 1α2 = 4◦(Fig. 7a). The optimum double slider block model is shown in Fig. 7b. The calculated observational quantities are compiled in Table 1, column 5. The double slider block model explains the uplift at the river bank much better. The fit of the other observational parameters is similar to the fit by the single slider block model.
5 Information derived from slider block models
The following considerations are restricted to the double slider block model, as this model explains all observational data within their estimated errors. It is obvious that prelim-inary information about the geometry and kinematics of the mass movement can be extracted from the model shown in Fig. 7b. For example, the maximum depth of the sliding planes could be used as a lower bound for the depth of fu-ture exploration boreholes. Therefore, boreholes located at the flood plain should be drilled to a depth of about 50 m in order to reach the basal sliding surface. The mass movement
extends about 220 m along the Danube river and the cross-sectional area of the primary slider block is 4540 m2. A vol-ume of about 0.75 million m3 follows from the assumption that the lateral extent of the primary slider block with the same volume as the actual mass movement is about3/4times
220 m.
The dynamic information which can be estimated from the rotational slider block model is the average residual angle of friction at the sliding planes. We must be aware that this value will be overestimated, because the slider block model does not consider lateral retaining forces due to the concave shape of the landslide (e.g. Zettler et al., 1999) The geomet-ric information derived in the preceding paragraph is not af-fected by the restriction to 2-D. The position of the primary and secondary slider blocks after the mass movement is de-termined by the average residual friction angles at the sliding surfaces under drained conditions (80,820). Residual cohe-sion is neglected. During the spring season, the groundwater level is usually high. A constant height as shown in Fig. 7 is assumed and seepage forces are neglected. The buoyant unit weight of soil (BW) of the slider block is used to consider the effect of pore pressure and effective stress at the sliding surface (e.g. Duncan, 1996). In order to keep the estimates of the average residual friction angles simple, an assump-tion is made whereby the centre of gravity for the buoyant weight coincides with the centre of gravity already calcu-lated for constant density (see Table 2). A constant density of 2000 kg m−3was assumed for the landslide mass. A more detailed density model will be used for numerical modelling (Sect. 6). The driving force (Fd) and the effective normal force (Fn) for the primary slider block are given by Eqs. (10) and (11). The driving force exerts the moment Rg Fn to the rotational slider block. The effective normal force mobilizes frictional forces at the sliding surface and generates the mo-ment tan(80) Rs Fn. The average residual friction angle (80)
follows from the equilibrium of moments at the final state of the landslide and is given by Eq. (12).
Fd=BW·sin(α0−1α1) (10)
Fn=BW·cos(α0−1α1) (11)
φ0=arctan
Rg·Fd
Rs·Fn
(12)
=arctan
Rg
Rs·tan(α0−1α1)
=13.6◦
The average residual friction angle of the secondary slider block follows analogously from Eq. (13).
φ20=arctan
Rg2
Rs2·tan(α0−1α1−1α2)
Table 2. Geometric parameters of the double slider block model.
Primary slide Secondary slide
Cross sectional area (F/F2) 4540 m2 2100 m2
Cross sectional area below high water level 3226 m2 933 m2
Radius to sliding plane (Rs/Rs2) 91 m 69 m
Radius to centre of gravity (Rg/Rg2) 64 m 47 m
Initial sliding angle (α0/α2) 22◦ 35◦
Final sliding angle (α0–1α1/α0–1α1–1α2) 19◦ 28◦
of loess. Investigations in other loess areas suggest resid-ual friction angles in the range of 25◦–35◦(Dijkstra et al., 2000a, b). The Pannonian substratum contains more clay and is known to be highly susceptible to mass movement where it forms river banks (Kraft, 2005; Gabor et al., 2009).
The bulge in the Danube is an obstacle for navigation and its removal would be an advantage. However, the question is if this measure could reactivate the mass movement along its primary sliding plane. Equation (11) can be used to es-timate the sensitivity of the mass movement towards such a measure. The removal of the bulge would result in a new lo-cation of the centre of gravity at Rg = 65.4 m andα= 21.3◦ (originally Rg = 64.4 m, α= 19◦). To keep the slider block in its new position, the average residual friction angle of the primary slider block would have to be increased by about 2◦. Therefore, one should be aware that the removal of the bulge could reactivate the mass movement.
6 Numerical modelling
Gabor et al. (2009) estimate the total volume of the Dunaszekcs¨o landslide mass to be 0.30 million m3. This value is significantly lower than the volume derived from the fit of the rotational slider block (0.75 million m3). The rea-son for this discrepancy is that Gabor et al. (2009) assume a listric sliding surface, which does not considerably pene-trate into the basal Pannonian layers. This failure model was previously proposed by Kraft (2005). The major argument against this model is that a shallow sliding surface requires large horizontal displacements at the river bank to produce the bulge in the river. However, large (>10 m) horizontal displacements can be excluded by comparing aerial photos (Fig. 2). On the other hand, the development of a sliding sur-face on top of clayey Pannonian sediments may appear me-chanically more reasonable than a circular and deeply pene-trating sliding surface. In the following, numerical modelling is carried out to gain a better understanding of the bank fail-ure mechanism and to judge if the rotational slider blocks (Figs. 6 and 7) supply reliable first information on the kine-matics of the volume.
The numerical modelling was performed using the con-tinuum mechanics code FLAC2D from Itasca Consulting
Group, which is based on the finite difference method (Itasca, 2009). The FLAC-Model uses a Strain-Softening material model which is based on the Mohr-Coulomb model. The dif-ference, however, lies in the possibility that cohesion, fric-tion, dilafric-tion, and tensile strength may soften after the onset of plastic yield. Due to the time-step algorithm routine, an FD-model using a Mohr-Coulomb failure criterion assigns a behaviour like that of a Bingham material (Langer, 1979). Table 3 shows a set of material properties near the state of limit equilibrium which were used for the analyses of the failure mechanism. Density of loess (e.g. Dijkstra, 2000b) and fluvial deposits near the river bank may vary over a wide range. An average value of 1800 kg m−3was chosen. A satu-rated density of 2150 kg m−3for the deeper Pannonian strata is in agreement with representative density values for the near-surface Neogene sediments in the Pannonian basin com-piled by Makarenko et al. (2002). The estimates of residual friction angles by the rotational slider block models (Eqs. 12 and 13) suggest relatively high values for loess and signif-icantly lower values for deeper Pannonian strata. Residual friction angles around 30◦were also observed in other loess areas (Dijkstra et al., 2000a). The boundary conditions were established by limitation of the degrees of freedom for the grid-points at the model boundaries. Velocities in the x-direction were fixed at the collateral boundaries of the model; velocities in the x- and y-direction were fixed at the base. These boundary conditions have proven to be highly useful when analyzing slopes and valley flanks (Preh and Poisel, 2004). The in situ stresses were calculated based on pure elastic material behaviour. Plastic deformations were pre-vented by the high strength of the loess and Pannonian strata. After calculating the in situ stresses, the failure was triggered by reducing the strength parameters to their residual values (Table 3).
Table 3. Material properties used for FD-modelling: density (d), modulus of elasticity (E), Poisson ratio (ν), cohesion (C0), friction angle (8’); subscript “r” denotes residual values.
d E ν C0 80 Cr0 80r
(kg m−3) (MPa) (kPa) (◦) (kPa) (◦)
Loess and fluvial deposits 1800 250 0.3 50 30 0 28
Pannonian strata 2150 50 0.25 20 20 0 10
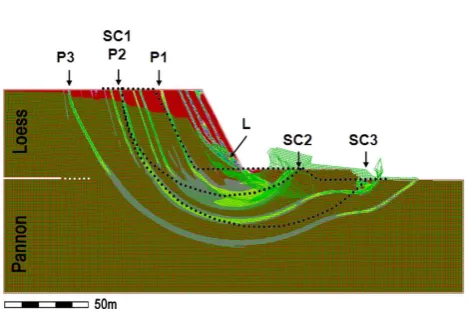
26 Figure 8. FD-modelling of the slope failure. Shear strain is superimposed on deformed grid. Sliding surfaces near the sliding plane face are denoted by L, successively developing sliding surfaces penetrating into the deeper Pannonian strata are denoted by P1, P2, and P3. The best fit of the primary and secondary slider blocks (Fig. 7) to the numerical model can be achieved under the assumption that failures of the loess wall occurred already in the past, the collapsed material has been removed by river erosion during floods, and P1 formed the loess face before the slope instability in 2008. The geometry of the slider block models shifted retrogressively is shown by dotted lines, SC1, SC2, and SC3 mark the scarps (see also Fig. 4).
Fig. 8. FD-modelling of slope failure. Shear strain is superimposed
on deformed grid. Sliding surfaces near the sliding plane face are denoted by L, successively developing sliding surfaces penetrating into the deeper Pannonian strata are denoted by P1, P2, and P3. The best fit of the primary and secondary slider blocks (Fig. 7) to the numerical model can be achieved under the assumption that failures of the loess wall occurred already in the past. The collapsed material has been removed by river erosion during floods and P1 formed the loess face before the slope instability in 2008. The geometry of the slider block models shifted retrogressively and is shown by dotted lines; SC1, SC2, and SC3 mark the scarps (see also Fig. 4).
about 20 m and agrees with the width of the actual rotated rigid blocks below the main scarp. The two deeper sliding surfaces (P2 and P3) can be well approximated by circular sliding surfaces, and radius and penetration depth are in the range derived by slider block modelling. The best fit to the slider blocks (primary and secondary) seems to be achieved under the assumption that failures of the loess wall already occurred in the past, that the collapsed material has been re-moved by river erosion during floods and P1 formed the loess face before the slope instability in 2008. Gabor et al. (2009) describe about 10–20 m high slopes below the nearly vertical loess wall that consist of reworked loess from past landslides. This observation supports the idea of a retrogressive develop-ment of the Dunaszekcs¨o landslide.
The geometry of the slider block models shifted retrogres-sively and is shown by dotted lines in Fig. 8. As stated be-fore, the numerical results indicate that the failure surfaces developed consecutively in time, L first and P3 last. As a consequence, the larger primary slider block in Fig. 7 would
actually be the secondary slide. However, it is not known how far potential deep sliding surfaces like P2 and P3 devel-oped before the slope failure in 2008 and due to the lack of geodetic monitoring in the lower part of the mass movement one cannot decide which block actually moved first during the 2008 slide. Therefore, the labels “primary slider block” and “secondary slider block” are kept.
Average residual friction angles of 80= 13.6◦ and
820= 19.9◦ were derived for the primary and secondary slider block by Eqs. (12) and (13). These average values are in good qualitative agreement with the residual values used in the numerical model (see Table 3). As an additional test of the significance of geometry and friction angles derived by the slider block model, the Bishop method (CLARA-W – Slope stability analysis in two or three dimensions for micro-computers, O. Hungr Geotechnical Research Inc. May, 2001) was applied to the primary slider block. Using the residual friction angles derived by the FE analysis (loess 80= 28◦; Pannon80= 10◦) and the densities given in Table 3, a fac-tor of safety η= 1.03 was determined for the final state of the mass movement. An average residual friction angle of
80= 13.0◦valid for the whole sliding surface of the primary slider block yields a factor of safetyη= 1.
7 Conclusions
This study of a landslide had to deal with an incomplete doc-umentation of the initial state, sparse geodetic data acquired after the mass movement, very few qualitative geomorpho-logic observations, and a lack of geotechnical parameters. A generalized 3-D topographic model was constructed and a representative longitudinal profile extracted. The recon-struction of the initial surface is based on an orthophoto and morphological considerations. Observational quantities are the locations of outcrops of basal sliding surfaces, displace-ments (Lagrangian and Eulerian) at the main scarp and in the lower part of the slide, rotations of blocks, and the quantity
M, which describes the total mass transport. Before starting with an accurate numerical analysis, it would be desirable to establish a general kinematic model of the landslide and to check the consistency of the different observations.
view on the morphology of the slide justifies its classification as a rotational slide. A double slider block model fits all ob-servational quantities within their error margins. This model supplies valuable information on the geometry of the slide. Estimates of the residual friction angles were derived and the question of reactivation was addressed. The volume of the whole landslide mass derived from the slider block model exceeds estimates of other authors by a factor of 2.5 (Kraft, 2005; Gabor et al., 2009). However, numerical modelling us-ing the FLAC2D code (Itasca, 2009) supports the kinematics, which were determined by fitting slider block models to the heterogeneous field data. Furthermore, the application of the Bishop method to the whole mass movement confirms the estimates of friction angles on the basis of the slider block models.
Generally, the results are assessed as preliminary informa-tion, which could only be achieved by the combination of the little, exact, geodetic data with qualitative morphological ob-servations and the implementation of a model. This type of information can be gained quickly and may be valuable for instantaneous hazard mitigation measures or the planning of a comprehensive exploration and monitoring program. Ex-perts on hazard mitigation may be frequently confronted with this situation.
Acknowledgements. The authors thank A. Eichhorn and B. Sz´ekely
for advice and discussions concerning geodetic and geomorpho-logic topics. The authors are also very grateful to E. Szegy and Istv´an L´aszl´o for their great support during the field campaign.
Edited by: P. Allasia
Reviewed by: P. Budetta, G. Sciarra, and another anonymous referee
References
Bishop, A. W.: The use of the slip circle in the stability analysis of slopes, Geotechnique, 5(1), 7–17, 1955.
B¨oge, A.: Formeln und Tabellen im Maschinenbau – F¨ur Studium und Praxis, Vieweg Verlag, Wiesbaden, 2007.
Br¨uckl, E. and Parotidis, M.: Prediction of slope instabilities due to deep-seated gravitational creep, Nat. Hazards Earth Syst. Sci., 5, 155–172, doi:10.5194/nhess-5-155-2005, 2005.
CLARA-W: Slope stability analysis in two or three dimensions for microcomputers, O. Hungr Geotechnical Research Inc. May, 2001.
Cruden, D. M. and Varnes, D. J.: Landslide Types and Processes, , in: Landslides: Investigation and Mitigation, edited by: Turner, A. K. and Schuster, R. L., Washington, 36–75, 1996.
Duncan, J. M.: Soil Slope Stability Analysis, in: Landslides: Inves-tigation and MiInves-tigation, edited by: Turner, A. K. and Schuster, R. L., Washington, 337–371, 1996.
Dijkstra, T., Rappange, F. E., Van Asch, T. W. J., Li, Y. J., and Li, B. X.: Laboratory and in situ shear strength parameters of Lanzhou loess, in: Landslides in the Thick Loess Terrain of North-West China, edited by: Derbyshire, E., JohnWiley & Sons Ltd, Chich-ester, England, 131–172, 2000a.
Dijkstra, T., Van Asch, T. W. J., Rappange, F. E., and Meng X.: Modelling landslide hazards in loess terrain, in: Landslides in the Thick Loess Terrain of North-West China, edited by: Der-byshire, E., JohnWiley & Sons Ltd, Chichester, England, 131– 172, 2000b.
Eberhardt, E., Stead, D., and Coggan, J. S.: Numerical analysis and progressive failure in natural rock slopes – the 1991 Randa rockslide, Int. J. Rock Mech. Min., 41, 69–87, 2004.
FLAC2D: Fast Lagrangian Analysis of Continua in 2 Dimensions, version 6.0, User’s guide, Minneapolis, ItascaConsulting Group, 2009.
G´abor, ´U., Mentes, G., B´anyai, L., Kraft, J., Gyim´othy, A., and Kov´acs, J.: Evolution of a bank failure along the Danube river at Dunaszekcs¨o, Hungary, Goemorphology, 109, 197–209, 2009. Helmstetter, A., Sornette, D., Grasso, J. R., Andersen, J. V.,
Gluz-man, S., and Pisarenko, V.: Slider block friction model for land-slides: Application to Vaiont and La Clapi`ere landslides, J. Geo-phys. Res., 109, 1–15, 2004.
Jing, L. and Hudson, J. A.: Numerical methods in rock mechanics, Int. J. Rock Mech. Min., 39, 409–427, 2002.
Kraft, J.: A dunaszekcs¨oi T¨or¨oklyuk kialkul´as´a ´es fennmarad´asa (Evolution and survival of the T¨or¨oklyuk cave at Dunaszekcs¨o), Mecsek Egyes¨ulet ´Evk¨onyve a 2004-es egyes¨uleti ´evr¨ol, ´Uj
´
Evfolyam, 8, 133–153, 2005.
Langer, M.: Rheological behaviour of rock masses [general report), Proc. 4th ISRM Congr., Montreux, 3, 29–62, 1979.
Lin, Z. G., Xu, Z. J., and Zhang, M. S.: Loess in China and land-slides in loess slopes, in: Landland-slides and Engineered Slopes, edited by: Chen. Z., Zhang, J. M., Ho, K., Wu, F. Q., and Li, Z. K., Taylor & Francis Group, London, 2008.
Makarenko, I., Legostaeva, O., Bielik, M., Starostenko, V., Dererova, J., and Sefara, J.: 3-D gravity effects of the sedimen-tary complexes in the Carpathian-Pannonian region, Geologica Carpathia, 53, special issue, 2002.
Poisel, R. and Preh, A.: Rock Slope Initial Failure Mechanisms and their Mechanical Models, Felsbau 22, 4, 40–45, 2004.
Preh, A. and Poisel, R.: A UDEC model for “Kink Band Slump-ing” type failures of rock slopes, in: Numerical Modeling of De-screte Materials in Geotechnical Engineering, edited by: Koni-etzky, H., Civil Engineering and Earth Sciences, Proceedings of the 1st UDEC/3DEC Symposium, Bochum, Germany, Balkema, ISBN:9058096351, 243–247, 2004.
Turcotte, D. and Schubert, G.: Geodynamics, 2nd Edn., Cambridge University Press, Cambridge, 456, 2002.
van Asch, T. W. J. and Malet, J.-P.: Flow-type failures in fine-grained soils: an important aspect in landslide hazard analysis, Nat. Hazards Earth Syst. Sci., 9, 1703–1711, doi:10.5194/nhess-9-1703-2009, 2009.