IJSRST1845416 | Received : 05 April 2018 | Accepted : 23 April 2018 | March-April-2018 [ (4) 5 : 1641-1645]
Iraq Earthquake Contour Maps
Bashair A.R. Mohammed*1, Israa H. Mohammed2, Tariq N. Ataiwe2, Hisham M.J. Al Sharaa2, Hameed S. Ismael2
*1Department of Physics, University of Baghdad, Baghdad, Iraq
2Building and Construction Engineering Department, University of Technology, Baghdad, Iraq
ABSTRACT
A magnitude 7.3 earthquake struck the northern Iranian- Iraq border region, it was 350 km north of Baghdad at a depth of 33.9 km. The earthquake was felt as far away as Turkey and Kuwait. Until that moment the Iraqi researchers did not focus on the hazardous of Earthquakes. This research provides national seismic contour maps of Iraq. The use of values on the maps as design coefficients, replacing site-specific studies, is not generally considered best practice. The values are intended to give a general indication of the expected hazard level. Three maps are provided, with return periods of 20 years, 10 years and ne year, whole showing the depth and magnitude. Values were computed over an area bounded by 29 o - 39o N and 39o W - 49o E. The computations were made for points distributed on a grid at approximately 15 km intervals in both directions, and this defines the spatial resolution of the maps.
Keywords: Baghdad, Iraq, Earthquake, Contour Maps
I.
INTRODUCTIONEarthquakes typically occur large-scale vibrational ground movements, caused by a number of phenomena including tectonic earth movements, volcanoes, landslides, rock deposits and human explosions. From these various causes, tectonic-related earthquakes are the largest and most important. The reason for this is to break the rocks and slide them along the faults inside the earth's crust. Error is the area of the earth's crust that the sides have moved - errors may be hundreds of miles long, from 1 to more than 100 miles deep, not easily visible on the Earth's surface. Earthquakes trigger a number of phenomena or factors called seismic hazards that can cause significant damage to the built environment. These include rupture, rupture, vibrational ground motion (immersion), immersion (eg tsunamis, cych, damfilor) (Such as liquefaction), fire or hazardous materials. For an earthquake, any particular hazards can be
controlled, each of which has historically caused serious damage and significant loss of life in specific earthquakes. The expected damage that is given a specific value for the risk parameter is called "vulnerability" and the resulting risk and vulnerability (ie, expected damage) is called seismic hazard [1].
II.
EARTHQUAKESsides of the error. This sudden slide releases large amounts of energy, which constitutes the earthquake. The initial radiation site of the seismic waves (ie, the first location of the dynamic rupture) is called the hypocenter center, whereas the projection on the surface directly above the epicenter of the epicenter [1].
III.
MEASUREMENT OF EARTHQUAKESThe Seismic waves are the vibrations of earthquakes that travel across the Earth. Earthquakes are complex multidimensional phenomena, scientific analysis that requires measurement, and are recorded on instruments called seismographs. The measurement of earthquakes qualitatively in terms of impact or severity, which vary from point to point. The time, location and size of the earthquake can be determined by data recorded by seismic stations. These measures remain the most widely used earthquake measures, and a number of different measures have been developed for each, which is sometimes confused. However, engineering design requires measuring earthquakes in units such as force or displacement.
IV.
THE RICHTER SCALENumerical measurement is used to describe the power of earthquakes. It was invented by Charles Francis Richter in 1935. Measured Earthquakes between 4.5 or more on a scale can be measured by instruments all over the world table I.
TABLE I THE RICHTER SCALE
Richter scale
Description The impact of the earthquake Average frequency of occurrence Less than 2.0
Micro earthquakes can only be felt by animals
About 8,000 a day
2.0-2.9 Minor I&II is too small to feel by
About 1,000 a day
human but instruments observe it 3.0-3.9 Minor
III&IV Felt by human beings, but rarely cause harm. About 49,000 per year
4.0-4.9 Light Humans feel a jolt with things moving and the sound of an
earthquake. But it does not cause harm
About 6,200 per year
5.0-5.9 Moderate Poor buildings may be severely damaged but strong buildings are not severely damaged About 800 per year
6.0-6.9 Strong Can cause great damage up to 160 km from the point of occurrence.
120 per year
7.0-7.9 Large can cause significant damage to a large area.
18 per year
8.0-8.9 Major can cause great damage even hundreds of miles from the point of occurrence.
1 per year
9.0.9.9 Great can cause significant
damage up to thousands of miles from the point of occurrence 10.0+ Supernatural has not
happened yet.
Rare (Unknown)
V.
MAGNITUDEAn individual earthquake is a unique release of strain energy. Quantification of this energy has formed the basis for measuring the earthquake event.
Richter's original magnitude scale was extended to observations of earthquakes of any distance and of focal depths ranging between 0 and 700 km. Because earthquakes excite both body waves, which travel into and through the Earth, and surface waves, which are constrained to follow the natural wave guide of the Earth's uppermost layers [2].
VI.
INTENSITYIn general, seismic intensity is a measure of the effect, or the strength, of an earthquake hazard at a specific location. While the termcan be applied generically to engineering measures such as peak ground acceleration, it is usually reserved for qualitative measures of location-specific earthquake effects, based on observed human behavior and structural damage [3].
VII.
DETERMINING THE DEPTH OF AN EARTHQUAKEEarthquakes can occur anywhere between the Earth's surface and about 700 kilometers below the surface. For scientific purposes, this earthquake depth range of 0 - 700 km is divided into three zones: shallow, intermediate, and deep.
Shallow earthquakes are between 0 and 70 km deep; intermediate earthquakes, 70 - 300 km deep; and deep
earthquakes, 300 - 700 km deep. In general, the term "deep-focus earthquakes" is applied to earthquakes deeper than 70 km. All earthquakes deeper than 70 km are localized within great slabs of shallow lithosphere that are sinking into the Earth's mantle [2].
VIII.
TECTONICS OF THE IRAQIraq is located in the north-western sector of the Arabian plate, attached with two plate boundaries. The two closest boundaries are the Africa and Eurasia. It is an intraplate area and as such, levels of seismicity are characteristically low (see Figure 1).
Figure 1: World tectonic plates [3].
IX.
PURPOSE AND OBJECTIVESOver the past few decades, a substantial body of new data on the location and activity rates of faults in Iraq region has become available. The present maps are a direct reflection of these new data but also reflect a somewhat different approach to how seismic hazards are defined and how data are incorporated into the evaluation.
X.
SCOPE OF WORKAlthough most of the information available was collected early in the investigation, data collection, refinement, and analysis are ongoing throughout the entire project. Trusted investigators evaluated of most of the data collected and the most reliable data were used throughout the project. Some of the collected data were sufficient as they existed but more data is needed for several aspects.
XI.
DATA COLLECTIONThe main type of information required for this study was the data on faults and earthquakes. A literature base containing the need the information was great and varied. To track a large amount of data, the information was collected in two forms: 1) data sheets and 2) maps.
XII.
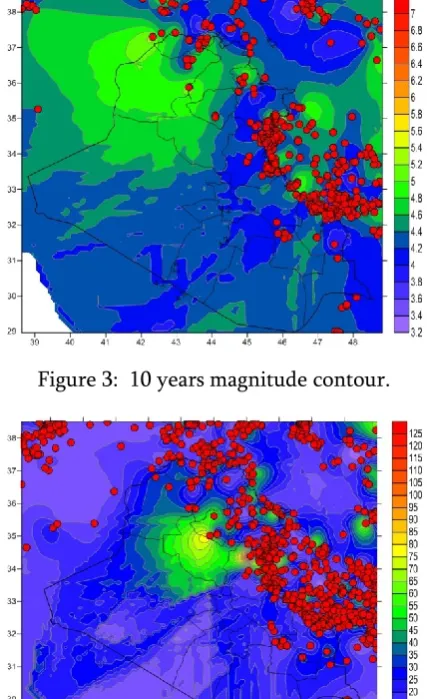
EARTHQUAKE CONTOUR MAP IRAQThe seismic contour maps shows the latest earthquake sites 924 with size (M)> 5 in the surrounding area of the Arabian Peninsula - Eurasian.
The M7.3 earthquake is located within a wide area of earthquakes along the Zagros Mountains and the Betelis stitch which forms the border plate. Note that the depths of the earthquake are often less than 70 km, indicating that most of these events are on the shell faults (see Figures II-7) [5].
Figure 2: 10 years depth contours.
Figure 3: 10 years magnitude contour.
Figure 4: 20 years depth contours.
Figure 6: one year magnitude contour map.
Figure 7: one year depth contour.
XIII.
ACCURACY OF DEVELOPED MAPSSince a lot of information on the basic map and others project data (including accelerometers) were moved by or that are created as computer files, the resulting maps must be accurate to degree allowed by hardware equipment or more susceptible, limited by the accuracy of the original sources used to create the data. The errors that may arise in the process may come from the following sources:
o Incompatibility of map projection schemes o Distortion of original map reproduction o Reduction of electronic scanning device.
XIV.
CONCLUSIONSIn contrast to previous studies that are largely based on relatively historical earthquake data incomplete, we have worked tremendously depends on both
earthquakes and geological data in the region. Specialty difference between the map of the magnitude contour and the map depth.
XV.
RECOMMENDATIONSGiven the ongoing developments by the Iraqi Government for the maps, several areas for future development for the seismic maps will be studed, this study may be useful in the future work.
XVI.
REFERENCES[1] Charles S., Earthquake Engineering Structural Engineering Handbook, Boca Raton: CRC Press LLC, 1999
[2]
https://earthquake.usgs.gov/learn/topics/measure.p hp
[3] https://en.wikipedia.org/wiki/Plate_tectonics#/me dia/File:Plates_tect2_en.svg
[4] Israa H. Mohammed, "Land Use and Land Cover Change Detection Using Remote Sensing Techniques", Imperial Journal of Interdisciplinary Research IJIR 3, 7, 2017, p 185-188.
![Figure 1: World tectonic plates [3].](https://thumb-us.123doks.com/thumbv2/123dok_us/9137769.1449785/3.595.305.556.285.461/figure-world-tectonic-plates.webp)