Identification and classification of brain tumor MRI images
with feature extraction using DWT and probabilistic neural network
N. Varuna Shree1 •T. N. R. Kumar1
Received: 2 September 2017 / Accepted: 22 December 2017 / Published online: 8 January 2018
The Author(s) 2018. This article is an open access publication
Abstract
The identification, segmentation and detection of infecting area in brain tumor MRI images are a tedious and time-consuming task. The different anatomy structure of human body can be visualized by an image processing concepts. It is very difficult to have vision about the abnormal structures of human brain using simple imaging techniques. Magnetic resonance imaging technique distinguishes and clarifies the neural architecture of human brain. MRI technique contains many imaging modalities that scans and capture the internal structure of human brain. In this study, we have concentrated on noise removal technique, extraction of gray-level co-occurrence matrix (GLCM) features, DWT-based brain tumor region growing segmentation to reduce the complexity and improve the performance. This was followed by morphological filtering which removes the noise that can be formed after segmentation. The probabilistic neural network classifier was used to train and test the performance accuracy in the detection of tumor location in brain MRI images. The experimental results achieved nearly 100% accuracy in identifying normal and abnormal tissues from brain MR images demonstrating the effectiveness of the proposed technique.
Keywords Image segmentationMRIDWTMorphologyGLCM PNN
1 Introduction
In image processing, images convey the information where input image is processed to get output also an image. In today’s world, the images used are in digital format. In recent times, the introduction of information technology and e-healthcare system in medical field helps clinical experts to provide better health care for patients. This study reveals the problem segmentation of abnormal and normal tissues from MRI images using gray-level co-occurrence matrix (GLCM) feature extraction and probabilistic neural network (PNN) classifier. The brain tumor is an abnormal growth of uncontrolled cancerous tissues in the brain. A brain tumor can be benign and malignant. The benign tumor has uniformity structures and contains non-active cancer cells. The malignant tumor has non-uniformity
structures and contains active cancer cells that spread all over parts.
According to world health organization, the grading system scales are used from grade I to grade IV. These grades classify benign and malignant tumor types. The grade I and II are low-level grade tumors while grade III and IV are high-level grade tumors. Brain tumor can affect individuals at any age. The impact on every individual may not be same. Due to such a complex structure of human brain, a diagnosis of tumor area in brain is challenging task. The malignant-type grade III and IV of tumor is fast growing. Affects the healthy brain cells and may spread to other parts of the brain or spinal cord and is more harmful and may remain untreated. So detection of such brain tumor location, identification and classification in earlier stage is a serious issue in medical science. By enhancing the new imaging techniques, it helps the doctors to observe and track the occurrence and growth of tumor-affected regions at different stages so that they can take provide suitable diagnosis with these images scanning.
The key issue was detection of brain tumor in very early stages so that proper treatment can be adopted. Based on & N. Varuna Shree
T. N. R. Kumar [email protected]
1 Department of CS&E, MSRIT, Bangalore, India
this information, the most suitable therapy, radiation, sur-gery or chemotherapy can be decided. As a result, it is evident that the chances of survival of a tumor-infected patient can be increased significantly if the tumor is detected accurately in its early stage.
The segmentation was employed to determine the affected tumor part using imaging modalities. Segmenta-tion is process of dividing the image to its constituent parts sharing identical properties such as color, texture, contrast and boundaries.
The research paper is organized as follows: Sect.2 presents the related works literature survey, Sect.3 pre-sents the materials and methods with the steps used in the proposed technique, Sect.4 presents the results and dis-cussion, Sect.5 presents the performance analysis, and finally Sect.6 contains the conclusion and future scope.
2 Literature survey
Analyzing and processing of MRI brain tumor images are the most challenging and upcoming field. Magnetic reso-nance imaging (MRI) is an advanced medical imaging technique used to produce high-quality images of the parts contained in the human body and it is very important process for deciding the correct therapy at right stage for tumor-infected individual.
Many techniques have been proposed for classification of brain tumors in MR images such as fuzzy clustering means (FCM), support vector machine (SVM), artificial neural network (ANN), knowledge-based techniques, and expectation-maximization (EM) algorithm technique which are some of the popular techniques used for region-based segmentation and so to extract the important infor-mation from the medical imaging modalities.
Bahadure et al. proposed BWT and SVM techniques image analysis for MRI-based brain tumor detection and classification. In this method, accuracy of 95% was achieved using skull stripping which eliminated all non-brain tissues for the detection purpose [1]. Joseph et al. [2] proposed segmentation of MRI brain images using K -means clustering algorithm along with morphological fil-tering for the detection of tumor images. The automated brain tumor classification of MRI images using support vector machine was proposed by Alfonse and Salem [3]. The accuracy of a classifier was improved using fast Fourier transform for the extraction of features and mini-mal redundancy maximini-mal relevance technique was used for reduction of features. The accuracy obtained from this proposed work was 98%.
The brain MRI image contains two regions which are to be separated for the extraction of brain tumor regions. One part of region contains the tumor abnormal cells, whereas
the second region contains the normal brain cells [4]. For the brain tumor segmentation, Zanaty [5] proposed an approach based on hybrid type, with the combination of seed growing, FCM, and Jaccard similarity coefficient algorithm with the measure of gray and white segmented tissue matter from tumor images. An average score of S of 90% segmentation was achieved with noise level of 9–3%. To manage and to address protocols of different images and nonlinearity of real data an effective classification based on contrast of enhanced MRI images, Yao et al. [6] proposed an methodology which included extraction of textures features with wavelet transform and SVM with an accuracy of 83%. For the classification and brain tumor segmentation, Kumar and Vijayakumar [7] proposed methodology using principal component analysis (PCA) and radial basis function kernel with SVM. They obtained an accuracy of 94% with this method. An artificial neural network tool as both classifier and segmentation was used for the effective classification of brain tumor from MRI images was proposed by Sharma et al. [8] with the uti-lization of textural primitive features which achieved an accuracy of 100%.
For the medical image segmentation, a localized fuzzy clustering with the extraction of spatial information was proposed by Cui et al. [9]. The author used Jaccard simi-larity index as a measure of segmentation claiming an accuracy of 83–95% and differentiating in to white, gray and cerebrospinal fluid.
For the brain tumor image segmentation, active contour method was applied to solve the problem based on intensity homogeneities on MRI images was proposed by Wang et al. [10]. For the automatic extraction of features and tumor detection a with an enhanced feature using Gaussian mixture model applied on MRI images with wavelet fea-tures and principal component analysis was proposed by Chaddad [11] with an accuracy of T1- weighted 95% and T2- weighted 92% for FLAIR MRI weighted images.
probabilistic neural network as a classifier tool. The study deals with the extraction of features from the segmented region to detect and classify the normal and abnormal tumor cells of medical brain MRI images for a large database. Our outcome leads to conclusion that with this proposed method it makes clinical experts easy to take a decision regarding diagnosis and also scanning.
3 Proposed methodology
This describes the materials, the source from which the brain image data collected and the algorithms for brain MRI segmentation and feature extraction. The methodol-ogy proposed includes application on brain MRI images of 2569256, 5129512 pixel size on dataset. It is converted into gray scale for further enhancement. The following discussion deals with implementation of algorithm.
3.1 Preprocessing
The preprocessing step improves the standard of the brain tumor MR images and makes these images suited for future processing by clinical experts or imaging modalities. It also helps in improving parameters of MR images. The parameters includes improvement in signal-to-noise ratio, enhancement in visual appearance of MR images, the removal of irrelevant noise and background of undesired parts, smoothing regions of inner part, maintaining relevant edges [12].
3.1.1 Segmentation
The segmentation is a process where the image is parti-tioned into different regions. Let an entire region of image be represented by S. Segmentation process can be viewed as partition of S into p subregions like S1, S2, S3,…Sp. Certain conditions has to satisfied such as the segmentation must be intact; that is each and every pixel should be within the region, every points in the regions should be connected in some sense, regions should be disjoint, etc.
3.1.2 Region growing
Region growing is grouping of pixels or subregions into larger regions based on certain criteria. The main aim was to select a ‘seed’ points and attach each of these seed to those neighboring pixels having identical properties to grow region. A set of seeds was taken as input within the image and marked the objects to be segmented. The region grows iteratively by estimating all unallocated neighboring pixels of the region. The similarity was the measure of difference between pixel’s intensity value and the region’s
mean, d. The pixel with the smallest difference measured this way was allocated to the respective region. This was continued until all pixels were allocated to a region. Seeded region growing requires seeds as additional input. The results depend on the selection of seeds [13]. The mea-surement was based on mean value of the pixel intensity. The image gets segmented; this image was used to identify the desired tumor region.
3.2 Morphological operations
Morphology deals with study of shapes and boundary area extraction from brain tumor images. Morphological oper-ation is rearranging the order of pixel values. It operates on structuring element and input images. Structuring elements are attributes that probes a features of interest. The basic operations used here are dilation and erosion. Dilation operation adds the pixels to boundary region, while erosion removes the pixels from the boundary region of the objects. These operations were carried out based on the structuring elements. Dilation chooses highest value by comparing all pixel values in neighborhood of input image described by structuring element, whereas erosion chooses the lowest value by comparing all the pixel values in the neighbor-hood of the input image [14].
3.3 Feature extraction
Feature extraction is process of extracting quantitative information from an image such as color features, texture, shape and contrast. Here, we have used discrete wavelet transform (DWT) for extracting wavelet coefficients and gray-level co-occurrence matrix (GLCM) for statistical feature extraction.
3.3.1 Feature extraction using DWT
The wavelet was used to analyze different frequencies of an image using different scales. Here, we are using discrete wavelet transform (DWT) which is powerful tool for fea-ture extraction. It was used to extract coefficient of wavelets from brain MR images. The wavelet localizes frequency information of signal function which was important for classification.
low-frequency part of the images. The high-frequency part of the images are represented by LH1, HL1, HH1, LH2, HL2 and HH2 which gives the details of horizontal, ver-tical and diagonal directions at first and second level, respectively. We have used low-level image, where LL1 represents the approximation of original image and is fur-ther decomposed to second-level approximation and details of image. The process was repeated until we obtained the desired level of resolution.
By using 2D discrete wavelet transform, the images were decomposed into spatial frequency components were extracted from LL subbands and since HL subbands have higher performance when compared to LL, we have used both LL and HL for better analysis which describes image text features [16]. The different frequency components and each component were studied with resolution matched to its scale and expressed as:
DWTpðsÞ ¼ di;j¼ P
pðsÞhiðs2ijÞ
di;j¼PpðsÞgiðs2ijÞ
ð1Þ
The coefficientsdi,jrefers to the component attribute in signalp(s) corresponding to the wavelet function, whereas
bi,jrefer to the approximated components in the signal. The functions h(s) and g(s) in the equation represent high-pass and low-pass filters coefficients, respectively, while parameters i and j refer to wavelet scale and translation factors.
3.3.2 Feature extraction using GLCM
Texture analysis differentiates normal and abnormal tissues easily for human visual perception and machine learning. It also provides variation between malignant and normal tissues, which may not be visible to human eye. It improves the accuracy by choosing effective quantitative features for early diagnosis. In the first step, the first-order statistical textural analysis-features information from the histogram of image intensities was extracted and frequencies of gray level at a random image positions were measured. It does not consider correlation or co-occurrences, between pixels. In the second step, the second-order textural analysis-fea-tures were extracted based on probability of gray levels at random distances and over entire image orientations.
The statistical features were extracted using gray-level co-occurrence matrix (GLCM), also known gray-level spatial dependence matrix (GLSDM). GLCM was intro-duced by Haralick [17]. It is an approach that describes the spatial relation between pixels of various gray-level values [15]. Gray-level co-occurrence matrix (GLCM) is 2D his-togram in which (p,q)th elements is the frequency of event p occurs withq. It is a function of distanceS =1, angle (at 0 (horizontal), 45 (with the positive diagonal), 90 (ver-tical) and 135(negative diagonal) and gray scalespandq,
and calculates how often a pixel with intensityp, occurs in relation with another pixel q at a certain distance S and orientation. In this method, gray-level co-occurrence matrix was initiated and the textural features such as con-trast, correlation, energy, homogeneity, entropy and vari-ance were obtained from LL and HL subbands of first four levels of wavelet decomposition [18]. The textural features extracted are listed below:
Contrast (CONT) Measurement of pixel intensities and its neighbors above image and given by the equation:
CONT¼X m1
x¼0 Xn1
y¼0
ðxyÞ2fðx;yÞ ð2Þ
Energy (ENG) Energy defines the quantitative amount of repetitive pixel pairs. It is the measurement of affinity in an image, given by equation:
ENG¼
ffiffiffiffiffiffiffiffiffiffiffiffiffiffiffiffiffiffiffiffiffiffiffiffiffiffiffiffiffiffi Xi1
p¼0 Xj1
q¼0
f2ðp;qÞ v
u u
t ð3Þ
Correlation(COR) The measurement of spatial features dependencies between the pixels.
COR¼ Pi1
p¼0 Pj1
q¼0ðp;qÞfðp;qÞ MpMq
rprq ð4Þ
Homogeneity (HOM) Measurement of local uniformity in an image. It is also known as inverse difference moment and contains a single or more range of values to distinguish between textured and non-textured.
HOM¼X i1
p¼0 Xj1
q¼0 1
1þ ðpqÞ2fðp;qÞ ð5Þ
Entropy (ENT) It calculates the designated interference of the textural image. It is given as:
ENT¼ X i1
p¼0 Xj1
q¼0
fðp;qÞlog2fðp;qÞ ð6Þ
After the textural features extraction, the following features assessment parameter are also required to be obtained for better analysis on brain MRI images.
Peak signal-to-noise ratio(PSNR) Is a measure used to evaluate the characteristic features of reconstructed image from processed image. It is given as:
PSNR¼20 log102 m1
MSE ð7Þ
Mean Square Error(MSE) Measure of fidelity of signal or image. It was used to compare two images by giving quantitative or similarity scores.
MSE¼ 1
PQ
X X
fði;jÞ fRði;jÞ
2
ð8Þ
These extracted statistical features were fed into prob-abilistic neural network (PNN) classifier as an input for training and testing the performance of classifier in the classification of brain tumor images into normal and abnormal.
3.4 Probabilistic neural network (PNN)
In early 1990s, D.F Specht introduced feed-forward neural network named as probabilistic neural network (PNN). It is derived from Bayesian network and statistical algorithm called Kernel Fisher discriminant analysis. It is composed of four nodes or layers: input layer, hidden layer, pattern layer and output layer. PNN formulates the weighted neighbors in the form of neural network [19].
The input layer consists of ‘P’ no of neurons that is dependent on categorical variables of various features extracted using gray-level co-occurrence matrix (GLCM). The input node weights were kept 1, and these values were fed into hidden layer. In the pattern layer, Radial basis functions were calculated and were fed in to summation layer. The summation layer adds the weighted values of activation in each class present in hidden layer. The values of summation layer were fed to output layer. The output layer chooses the highest of the probabilities, 1 indicates positive for the target class type and 0 indicates negative for non-targeted class type [20].
4 Result and discussion
In this research, we have used two datasets, one was trained dataset collected from Web siteswww.diacom.comand the other was test dataset. These datasets were built by expe-rienced radiologists; this includes sample images of five patients with all modalities. The data were collected from digital imaging and communications in medicine dataset. We have considered 650 collected samples from the 25 images of DICOM dataset, of which 18 are infected tumor brain tissues and others normal for the analysis.
Form the survey, the directional features extracted from LL and HL subbands wavelet transform gives the detailed information of different directions with more systematic with characterization changes in biological tissues.
The MRI images were decomposed into five different levels from which the detailed coefficients from LL and HL subbands were selected. These subbands were obtained
from wavelet decomposed; the statistical textural features such as energy, correlation, entropy, and homogeneity were extracted using gray-level co-occurrence matrix (GLCM). The textural features obtained from different levels of wavelet decomposition were taken into consideration and were used as input from training and testing the perfor-mance of PNN classifier.
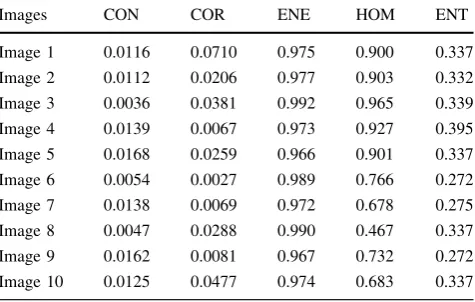
The image 1 to image 10 shows different levels of subbands up to 5th level of wavelet decomposition. These extracted features were used as input vectors for training and testing the performance of PNN classifier. Tables1 and 2 show the statistical textural features such as corre-lation, contrast, energy, homogeneity and entropy obtained from gray-level co-occurrences matrix formed from dif-ferent levels of LL and HL subbands of all five levels of trained and tested images (Figs.1and2).
The performance analysis of segmented images with the calculation of area is tabulated in Table3. A lower value of MSE and a higher value of PSNR indicate better signal-to-noise ratio in the extracted image.
From the observation, the contrast of trained MR images obtained was found to be more when compared to tested MR images, whereas the homogeneity of trained MR images was found to be less when compared to tested MR images. Similarly, the entropy and energy are found more in trained MR images when compared to tested MR ima-ges. With this proposed methodology and with the help of statistical textural features (contrast, correlation, energy, homogeneity and entropy) procured from LL and HL subbands classified the brain tumor images into normal and abnormal. The differences in statistical textural feature values of trained and tested brain tumors were found to be very useful in manipulating the performance of the PNN classifier in training and testing.
Table 1 The statistical features obtained from gray-level co-occur-rence matrix (GLCM) of LL and HL subbands of trained images
Images CON COR ENE HOM ENT
Image 1 0.0116 0.0710 0.975 0.900 0.337
Image 2 0.0112 0.0206 0.977 0.903 0.332
Image 3 0.0036 0.0381 0.992 0.965 0.339
Image 4 0.0139 0.0067 0.973 0.927 0.395
Image 5 0.0168 0.0259 0.966 0.901 0.337
Image 6 0.0054 0.0027 0.989 0.766 0.272
Image 7 0.0138 0.0069 0.972 0.678 0.275
Image 8 0.0047 0.0288 0.990 0.467 0.337
Image 9 0.0162 0.0081 0.967 0.732 0.272
The observation results are shown in Fig.3representing original images (a) column wise, (b) preprocessed images obtained by filtering of noise, (c) region-based
segmentation images, (d) extracted tumor-affected region from segmented images, area of the tumor-affected region.
5 Performance analysis
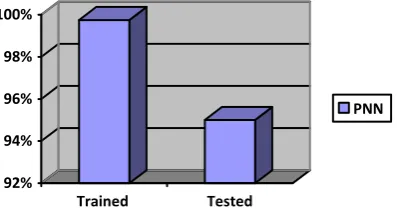
The trained dataset images for which the features extracted were trained using probabilistic neural network (PNN) classifier for the classification purpose, whereas the test dataset was not trained using PNN classifier, only the sta-tistical and textural features were extracted. The accuracy of trained and tested image was compared based on the classification of normal and abnormal tumor tissues. Fig-ure4shows the accuracy results in classification of normal and abnormal tumor tissues.
Accuracy or correct rate of classification is the effi-ciency of appropriate classification to the total number of classification tests [19]. This process of brain tumor clas-sification has been performed on various normal and abnormal MR images, and the accuracy of the PNN clas-sifier is manipulated, using the equation given below:
Accuracyð Þ ¼% Correct cases
Total number100 ð9Þ
6 Conclusion and future scope
In this research, we have used brain MR images, seg-mented into normal brain tissue (unaffected) and abnormal tumor tissue (infected). To remove a noise and smoothen the image, preprocessing is used which also results in the improvement of signal-to-noise ratio. Next, we have used discrete wavelet transform that decomposes the images and textural features were extracted from gray-level co-occur-rence matrix (GLCM) followed by morphological opera-tion. Probabilistic neural network (PNN) classifier is used for the classification of tumors from brain MRI images.
From the observation results, it can be clearly expressed that the detection of brain tumor is fast and accurate when compared to the manual detection carried out by clinical experts. The performance factors evaluated also shows that it gives better outcome by improving PSNR and MSE parameters.
The proposed methodology results in accurate and speedy detection of tumor in brain along with identification of precise location of the tumor.
In identification and classification into normal and abnormal tumors from brain MR images, accuracy of nearly 100% was achieved for trained dataset because the statistical textural features were extracted from LL and HL subbands wavelet decomposition and 95% was achieved for tested dataset. With the above results, we conclude that
Table 2 The statistical features obtained from gray-level co-occur-rence matrix (GLCM) of LL and HL subbands of tested images
Images CON COR ENE HOM ENT
Image 1 0.0098 0.0510 0.856 0.930 0.228
Image 2 0.0073 0.0198 0.899 0.870 0.389
Image 3 0.0110 0.0295 0.954 0.910 0.321
Image 4 0.0095 0.0054 0.774 0.882 0.350
Image 5 0.0120 0.0243 0.832 0.891 0.302
Image 6 0.0043 0.0034 0.820 0.745 0.253
Image 7 0.0100 0.0056 0.854 0.798 0.265
Image 8 0.0030 0.0266 0.860 0.950 0.330
Image 9 0.0130 0.0071 0.789 0.947 0.232
Image 10 0.0108 0.0450 0.893 0.864 0.330
Fig. 1 Diagram of probabilistic neural networks
our proposed method clearly distinguishes the tumor into normal and abnormal which helps in taking clear diagnosis decisions by clinical experts.
In the future work, different classifiers can be used to increase the accuracy combining more efficient segmen-tation and feature extraction techniques with real- and clinical-based cases by using large dataset covering dif-ferent scenarios.
Open Access This article is distributed under the terms of the Creative Commons Attribution 4.0 International License (http://creative commons.org/licenses/by/4.0/), which permits unrestricted use, dis-tribution, and reproduction in any medium, provided you give appropriate credit to the original author(s) and the source, provide a link to the Creative Commons license, and indicate if changes were made.
References
1. Bahadure NB, Ray AK, Thethi HP (2017) Image analysis for MRI based brain tumor detection and feature extraction using biologically inspired BWT and SVM. Int J Biomed Imaging 2017, Article ID 9749108, 12 pages
2. Joseph RP, Singh CS, Manikandan M (2014) Brain tumor MRI image segmentation and detection in image processing. Int J Res Eng Technol 3, eISSN: 2319-1163, pISSN: 2321-7308
3. Alfonse M, Salem M (2016) An automatic classification of brain tumors through MRI using support vector machine. Egypt Comput Sci J 40:11–21
4. Coatrieux G, Huang H, Shu H, Luo L, Roux C (2013) A water-marking-based medical image integrity control system and an image moment signature for tampering characterization. IEEE J Biomed Health Inform 17(6):1057–1067
5. Zanaty EA (2012) Determination of gray matter (GM) and white matter (WM) volume in brain magnetic resonance images(MRI). Int J Comput Appl 45:16–22
6. Yao J, Chen J, Chow C (2009) Breast tumor analysis in dynamic contrast enhanced MRI using texture features and wavelet transform. IEEE J Sel Top Signal Process 3(1):94–100 7. Kumar P, Vijayakumar B (2015) Brain tumor MR image
seg-mentation and classification using by PCA and RBF kernel based support vector machine. Middle East J Sci Res 23(9):2106–2116 8. Sharma N, Ray A, Sharma S, Shukla K, Pradhan S, Aggarwal L (2008) Segmentation and classification of medical images using texture-primitive features: application of BAM-type artificial neural network. J Med Phys 33(3):119–126
9. Cui W, Wang Y, Fan Y, Feng Y, Lei T (2013) Localized FCM clustering with spatial information for medical image segmenta-tion and bias field estimasegmenta-tion. Int J Biomed Imaging 2013, Article ID 930301,8 pages
10. Chaddad A (2015) Automated feature extraction in brain tumor by magnetic resonance imaging using Gaussian mixture models. Int J Biomed Imaging 2015, Article ID868031, 11 pages 11. Sachdeva J, Kumar V, Gupta I, Khandelwal N, Ahuja CK (2013)
Segmentation, feature extraction, and multi class brain tumor classification. J Digit Imaging 26(6):1141–1150
Table 3 The performance evaluation and area calculation of tumor extracted region of trained images
Images PSNR MSE Area of image in pixel Area of tumor region
Image 1 14.011 6.121 39,240 7698
Image 2 13.82 3.116 67,824 9874
Image 3 14.12 8.068 50,508 7423
Image 4 13.86 4.77 50,388 9056
Image 5 13.79 5.84 24,964 4564
Image 6 13.82 7.79 50,429 3698
Image 7 13.99 6.92 50,298 5879
Image 8 14.004 7.35 35,040 13,923
Image 9 14.066 6.215 50,544 6534
Image 10 14.03 6.172 16,384 4497
Fig. 3 Observational results of an imageaoriginal images,b prepro-cessed images,cregion segmentation tumor image,dextracted tumor images,earea of extracted tumor region
92% 94% 96% 98% 100%
Trained Tested
PNN
12. Demirhan A, Toru M, Guler I (2015) Segmentation of tumor and edema along with healthy tissues of brain using wavelets and neural networks. IEEE J Biomed Health Inform 19(4):1451–1458 13. Dubey RB, Hanmandlu M, Gupta K (2009) Region growing for MRI brain tumor volume analysis. Indian J Sci Technol 2(9), ISSN: 0974-6846
14. Sawakare S, Chaudhari D (2014) Classification of brain tumor using discrete wavelet transform, principal component analysis and probabilistic neural network. Int J Res Emerg Sci Technol 1(6), E-ISSN: 2349-7610
15. Haralick RM, Shanmugam K, Dinstein I (1973) Textural features for image classification. IEEE Trans Syst Man Cybern 3(6):610–621
16. Shinde MV et.al (2014) Brain tumor identification using MRI images. Int J Recent Innov Trends Comput Commun 2(10), ISSN: 2321-8169
17. Kharat KD, Kulkarni PP, et al. (2012) Brain tumor classification using neural network based methods. Int J Comput Sci Inform 1(4), ISSN (PRINT): 2231-5292
18. Jadhav C et al (2014) Study of different brain tumor MRI image segmentation techniques. Int J Comput Sci Eng Technol (IJC-SET) 4(4):133–136
19. Madhikar GV, Lokhande SS (2014) Detection and classification of brain tumour using modified region growing and neural net-work in MRI images. Int J Sci Res (IJSR) 3(12):5
20. Vaishali et al. (2015) Wavelet based feature extraction for brain tumor diagnosis—a survey. Int J Res Appl Sci Eng Technol (IJRASET) 3(V), ISSN: 2321-9653
N. Varuna Shreeworking as research scholar in the Department of
Computer Science and engineering, M.S Ramaiah college of Engi-neering, Bangalore. My area of research is Image Processing.
Dr. T. N. R. Kumar working as an Associate Professor in the