e
-ISSN: 2278-067X,
p
-ISSN : 2278-800X, www.ijerd.com
Volume 5, Issue 8 (January 2013), PP. 30-39
Analysis of Banded Texture of Friction Stir Weld Bead
Surface by Image Processing Technique
R.Rajashekar
1, B.M.Rajaprakash
21Assistant Professor, Department of Mechanical Engineering, UVCE, Bangalore 560 001, India
2Professor, Department of Mechanical Engineering, UVCE, Bangalore 560 001, India
Abstract:- The tool shoulder of friction stir welding is considered to be one of the prime element
which controls the material flow and heat input, generating required temperature and hydrostatic pressure along the weld line in producing a defect-free weld. The interaction of tool shoulder with base material in the formation of friction stir weld is studied by analyzing the banded texture of weld bead surface using image processing techniques, since the textures form an important clue for the recognition of surface. Experiments are carried out by capturing the images of weld bead surface of friction stir welded specimens produced using different process parameters. The images are digitally processed and analyzed by defining suitable region of interest along good and defect weld region based on X-Ray radiography results of friction stir welded specimens to determine first order and second order statistical textural parameters of weld bead surface using MATLAB. The variation in the textural parameters along good and defect weld regions are observed which enables to assess the quality of friction stir weld using image processing.
Keywords:- Friction stir welding, Image processing, Statistical textural parameters, X-Ray
radiography
I.
INTRODUCTION
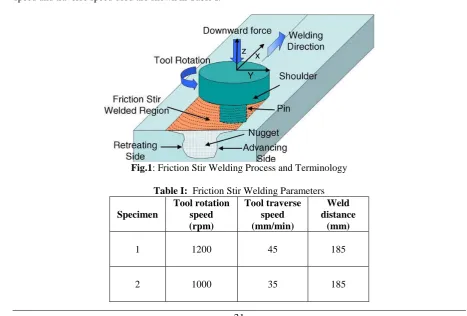
Friction Stir Welding (FSW) is an eco friendly solid-state welding technique primarily used for joining aluminium alloys of butt and lap joints with no consumables. This method is developed by The Welding Institute (TWI), UK in 1991 and being used in automobile, shipbuilding and aerospace industries. The FSW process and terminology are schematically shown in Fig.1. The process parameters are tool geometry, axial force, tool rotation speed, traverse speed and tool tilt angle which is the angle between the tool axis and the normal to the surface of the workpieces being welded. When the tool pin is plunged into the workpiece a cavity is created in the base material and the rotation of too pin stirs the materials to soften without reaching the melting point (plasticized) around the pin and below the shoulder. The plasticized material between tool shoulder at the top and backing plate at the bottom form plasticized tubular shaft of metal. When the tool is traversed along the weld line, the material from the leading edge is progressively plasticized and flows to the trailing edge through the retreating side by two modes: shoulder-and pin-driven flow. The shoulder driven material flows from the retreating side and forges against the advancing side base material. The pin-driven material flows layer wise around the pin and the layers are stacked in the weld line. The sufficient transferred material fills the weld cavity at the optimum temperature and pressure. The shoulder-driven material, pin-driven material and base material coalesces with each other forming the joint [1].
FSW tool is considered to be one of the prime parameter which controls the material flow and heat input, and in turn the quality of the weld. Kumar and Kailas [2][3][4] analyse the material flow during friction stir weld formation and found two different modes of material flow; “pin-driven material flow” and “shoulder-driven material flow” which merges together with adequate temperature and hydrostatic pressure generated from the shoulder contact with the base material. When shoulder contact is increased the axial load increases transferring the increased amount of flow of material from the leading edge into weld cavity and prevents the material from flowing out of the weld cavity producing sufficient amount of friction heat and hydrostatic pressure to form defect free weld.
S.Muthukumaran et al.[6] developed a methodology for online condition monitoring of FSW by studying the variation in quality of weld subjected to pin failure and variable pin depth using image processing techniques. With growing demand of industrial automation in manufacturing application of machine vision and image processing plays an important role in quality inspection and process monitoring of FSW.
One of the important applications of image processing analysis is texture analysis, as different surfaces
have different textures. The study of this textures form an important clue for the recognition of surface. Image texture can be quantitatively evaluated using the properties such as fineness, smoothness, coarseness, granulation, etc. by various statistical and structural methods. The statistical methods are preferred over structural methods as most of image textures do not follow a specific grammar or rule, which is essential for structural method [7] [8]. The statistical method involves calculation of properties based on the gray tones of the specimens and are of different orders based on the number of gray values considered for analysis and the type of relationship used. The first order statistics involves features such as Mean, Standard Deviation, Entropy, Skewness and Kurtosis.The higher order statistics uses gray level co-occurrence matrix for the calculation of various features based on the matrices.
Gray-Level Co-occurrence Matrix (GLCM), also known as the gray-level spatial dependence matrix considers the spatial relationship of pixels to examine the texture of image. The GLCM characterize the texture of an image by calculating how often pairs of pixel with specific values and in a specified spatial relationship occur in an image, the statistical features extracted from this matrix are Contrast, Correlation, Energy, Homogeneity, Sum of Squares, Sum Variance, Sum Entropy, Inverse Difference Moment..etc,.
In this paper an attempt has been made to study the weld bead surface texture of friction stir weld using machine vision and image processing techniques by quantifying image parameters from first order and second order statistical textural parameters determined for region of interest defined along good and defect weld region based on X-Ray radiography results of friction stir welded specimens using MATLAB to access the quality of the welds.
II.
EXPERIMENTAL
WORK
The base material used for specimens is aluminum 7020-T6, a medium strength precipitation hard enable Al-Zn-Mg alloy used in aerospace industry for structural applications. The base material dimension for production of weld is 300mm x 150mm x 5mm. The tool used is OHNS die steel material with 4.6mm long conical shaped pin of 6mm top diameter and 4mm bottom diameter with 25mm flat shoulder diameter. The specimens produced for variable tool rotation speed and tool traverse speed on modified milling machine with butt welded configuration and 20 rake angle are used for capturing images for further analysis. The tool rotation speed and traverse speed used are shown in Table I.
Fig.1: Friction Stir Welding Process and Terminology
Table I: Friction Stir Welding Parameters
Specimen Tool rotation speed (rpm) Tool traverse speed (mm/min) Weld distance (mm)
1 1200 45 185
III.
METHODOLOGY
FOR
IMAGE
PROCESSING
The digital images of the welded specimens are captured and processed to improve the image quality to extract the image parameters for analysis using image processing toolbox of MATLAB. In order to reduce the image data, the color image is converted to gray image, original image is cropped along weld bead and filters are applied on weld bead images to reduce the noise. Further, images are enhanced by contrast stretching to improve the clarity of weld bead by Contrast-Limited Adaptive Histogram Equalization operation.
The defect regions on the weld bead are indentified from X-Ray radiography of the FSW specimens. The region of interest (ROI) in the form of rectangular area is defined along defect weld region and good weld region on processed weld bead images. The gray level histogram of ROI is plotted to extract first order statistics. GLCM of ROI is created to extract second order statistics parameters. The variations of these statistical parameters extracted along the good weld region and defect weld region are studied. The image processing methodology flowchart is shown in Fig.2.
IV.
RESULTS
AND
DISCUSSIONS
The gray scale image of FSW specimen1 is shown in Fig.3. The weld bead image is processed by histogram equalization to improve the contrast (Fig.4). Based on the X-Ray radiography of FSW specimen1 (Fig.5) a suitable size of ROI is considered on weld bead to get the images of good weld region (Fig.8) and defect weld region(Fig.6). The textural parameters of weld bead surface images along good weld region and defect weld region determined are i) First-order statistical parameters: Mean, Standard Deviation and Entropy from the gray level histograms of defect weld region (Fig.7) and good weld region (Fig.9) and ii) Second- order statistical parameters: Contrast, Correlation, Energy and Homogeneity from GLCM of good and defect weld bead regions.
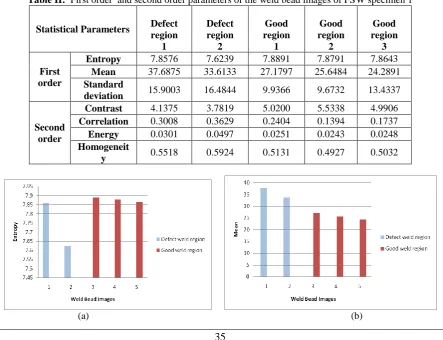
The first-order and second-order statistical parameters along good and defect region of weld of FSW specimen1 obtained are listed in Table II. From the plot of statistical parameters of weld bead images( Fig.10) it has been observed that there is a clear variation in the statistical parameters of defect weld region and good weld region. These variations are due to the fact that the reflectivity of light is directly dependent on the nature of surface; smooth and even surface reflects more light than rough and wavy surface and such surfaces are produced due to the prevailing shoulder interaction with base material during welding.
It has been observed that entropy of first-order statistics which measures randomness of gray value and contrast of second-order statistics which measure local variation in GLCM are higher for good weld region than defect weld region. This indicates the uniformity of the weld bead surface due to proper contact of shoulder with base material producing adequate heat and compactness reducing the defects in the weld. Correlation, Energy and Homogeneity of second-order statistics are lower for good weld region than defect weld region since, GLCM are found to be more sensitive to changes in surface finish. The defect weld regions of weld bead (Fig.6) shows abrupt changes in weld surface indicating improper interaction of shoulder with underneath base material during welding leading to defects.
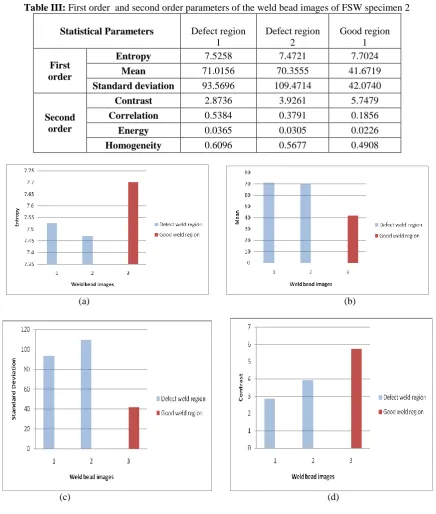
technique to improve the quality and cropped along weld bead (Fig.12). Based on the X-Ray radiography (Fig.13) the weld bead image is further cropped by defining ROI of suitable size along defect weld region (Fig.14) and good weld region(Fig.15). It has been observed that entropy of first-order statistics which measures randomness of gray value and contrast of second-order statistics which measure local variation in GLCM are higher for good weld region than defect weld region. This indicates the uniformity of the weld bead surface due to proper contact of shoulder with base material producing adequate heat and compactness reducing the defects in the weld. Correlation, Energy and Homogeneity of second-order statistics are lower for good weld region than defect weld region since, GLCM are found to be more sensitive to changes in surface finish. The defect weld regions of weld bead (Fig.14) shows abrupt changes in weld surface indicating improper interaction of shoulder with underneath base material during welding leading to defects. Hence it can be concluded that in both the FSW specimens, the statistical parameters behave in the similar manner in identifying good and defect weld region.
Fig.3: Gray Scale Image of FSW Specimen 1
Fig.4: Gray Scale, Processed Weld Bead Image FSW Specimen 1
Fig.5: X-Ray Radiography of FSW Specimen 1
(a) (b)
(a)
(b)
Fig.7: Gray level Histogram of Defect Weld Regions of FSW Specimen1
(a) (b) (c)
Fig.8: Gray Scale, Processed Images of Good Weld Regions of FSW Specimen 1
(b)
(c)
Fig.9: Gray Level Histogram of Good Weld Regions of FSW Specimen1
Table II: First order and second order parameters of the weld bead images of FSW specimen 1
Statistical Parameters Defect
region 1
Defect region
2
Good region
1
Good region
2
Good region
3
First order
Entropy 7.8576 7.6239 7.8891 7.8791 7.8643
Mean 37.6875 33.6133 27.1797 25.6484 24.2891
Standard
deviation 15.9003 16.4844 9.9366 9.6732 13.4337
Second order
Contrast 4.1375 3.7819 5.0200 5.5338 4.9906
Correlation 0.3008 0.3629 0.2404 0.1394 0.1737
Energy 0.0301 0.0497 0.0251 0.0243 0.0248
Homogeneit
y 0.5518 0.5924 0.5131 0.4927 0.5032
(c) (d)
(e) (f)
(g)
Fig.10: First-order and Second-order Statistical Parameters Plot of FSW Specimen1 (a) Entropy (b)Mean (c)
Standard deviation (d) Contrast (e) Correlation (f) Energy (g) Homogeneity
Fig.12: Gray Scale, Processed Weld Bead Image FSW Specimen2
Fig.13: X-Ray Radiography of FSW Specimen 2
(a) (b)
Fig.14: Gray Scale, Processed Images of Defect Weld Regions of FSW Specimen 2
Fig.15: Gray Scale, Processed Images of Good Weld Regions of FSW Specimen 2
(a)
(b)
Fig.17: Gray Level Histogram of Good Weld Regions of FSW Specimen2
Table III: First order and second order parameters of the weld bead images of FSW specimen 2
Statistical Parameters Defect region
1
Defect region 2
Good region 1
First order
Entropy 7.5258 7.4721 7.7024
Mean 71.0156 70.3555 41.6719
Standard deviation 93.5696 109.4714 42.0740
Second order
Contrast 2.8736 3.9261 5.7479
Correlation 0.5384 0.3791 0.1856
Energy 0.0365 0.0305 0.0226
Homogeneity 0.6096 0.5677 0.4908
(a) (b)
(e) (f)
(g)
Fig.18: First-order and Second-order Statistical Parameters Plot of FSW Specimen 2: (a) Entropy (b)Mean (c)
Standard deviation (d) Contrast (e) Correlation (f) Energy (g) Homogeneity
V.
CONCLUSION
In the present study, digital image processing technique is adopted for analysis of FSW bead surface which is produced by tool shoulder interaction with underneath base material during welding. The image parameters of weld bead surface is quantified from first-order and second-order statistics of weld bead images and they show clear variations in their intensities with respect to good and defect region of welded specimens. Further, the methodology used may be adopted for automation of the FSW processes by means of online monitoring system, which can improve the productivity and quality of the welds produced by FSW processes.
REFERENCES
[1]. Thomas W.M., International Patent Application No PCT/GB92/02203, 10 June, Gothenburg, Friction
Stir Welding at TWI, 1993
[2]. K. Kumar and Satish V.Kailas, “The role of friction stir welding tool on material flow and weld formation”, Materials Science and Engineering A, 485(2008), 367-374.
[3]. K.Kumar and Satish.V.Kailas,” On the role of axial load and the effect of interface position on the tensile strength of a friction stir welded aluminium alloy”, Materials and Design 29 (2008) 791-797. [4]. S.Muthukumaran and S.K.Mukherjee, “Multi-layered metal flow and formation of onion rings in
friction stir welds”, International Journal of Advanced Manufacturing Technology(2008), 36:68-73.
[5]. Shaowen XU and Xiaomin Deng, “A study of texture patterns in friction stir welds”, Acta Materialia
56 (2008) 1326-1341.
[6]. Preetish Sinha, S.Muthukumaran, R.Sivakumar and S.K.Mukherjee, “Condition monitoring of first mode of metal transfer in friction stir welding by image processing techniques”, International Journal of Advanced Manufacturing Technology(2008), volume 36, pages 484-489.
[7]. K.Venkatramana and B.Ramamoorthy, “Statistical methods to compare the texture features of
machined surfaces”, Pattern Recognition, vol29, No.9,pp1447-1459, 1996.