http://www.sciencepublishinggroup.com/j/iji doi: 10.11648/j.iji.20170502.11
ISSN: 2329-177X (Print); ISSN: 2329-1753 (Online)
Transcriptome Changes Associated with Protective
Immunity in T and B Cell-Deficient Rag1
-/-
Mutant Zebrafish
Aparna Krishnavajhala
1, Preeti J. Muire
2, Larry Hanson
2, Henry Wan
2, Fiona McCarthy
3, 4,
Alan Zhou
2, Lora Petrie-Hanson
2, *1
Department of Pediatrics, National School of Tropical Medicine, Baylor College of Medicine, Houston, Texas, USA
2Department of Basic Sciences, College of Veterinary Medicine, Mississippi State University, Mississippi State, USA 3School of Animal and Comparative Biomedical Sciences, University of Arizona, Tucson, USA
4
BIO5 Institute, University of Arizona, Tucson, USA
Email address:
[email protected] (L. Petrie-Hanson)
*Corresponding author
To cite this article:
Aparna Krishnavajhala, Preeti J. Muire, Larry Hanson, Henry Wan, Fiona McCarthy, Alan Zhou, Lora Petrie-Hanson. Transcriptome Changes Associated with Protective Immunity in T and B Cell-Deficient Rag1-/- Mutant Zebrafish. International Journal of Immunology. Vol. 5, No. 2, 2017, pp. 20-36. doi: 10.11648/j.iji.20170502.11
Received: January 22, 2017; Accepted: February 21, 2017; Published: March 25, 2017
Abstract:
To elucidate the basis of protective immunity in T and B cell deficient rag1-/- mutant zebrafish, we conducted microarray analysis of 15,617 genes from rag1-/- mutant zebrafish 48 hours after a primary response and 48 hours after a secondary response. Following primary exposure, the highest fold expression differences (3.8 to 4.95) were genes for serum amyloid A, chemokine CCL-C5a (CCL-19a), signal transducer and activator of transcription (STAT) 1b, interferon regulatory factor 11, and myxovirus resistance A. Strong induction of these genes demonstrated that primary immune responses and innate immune cells were not impaired in T and B cell deficient mutant zebrafish. Following bacterial re-exposure, the highest fold expression differences (2 to 3 fold) were in chemokine CCL-C5a (CCL-19a), myomegalin, bone morphogenetic protein 4, and relaxin 3a. These genes are involved in the immune response and cell proliferation. Genes for cell receptor activation and signal transduction, cell proliferation and cytotoxic functions were also up-regulated. These findings suggest receptor activation and expansion of a cell population. Increased ifnγ expression at 48 hpi was associated with both primary and secondary immune responses.Keywords:
Rag1-/- Mutant Zebrafish, Edwardsiella ictaluri, Protective Immunity, Transcriptome, Cell-Mediated Immunity1. Introduction
During early stages of life, fish do not have acquired immunity; there is an adaptive component of innate immunity that protects them during this period. Channel catfish do not orchestrate acquired immunity at 1 to 2 weeks post hatch [1, 2], yet fry are frequently vaccinated at that age with varying success. When channel catfish fry were vaccinated with RE-33®, an attenuated live strain of
Edwardsiella ictaluri, protection lasted from 14 days to 4 months post vaccination [3], or from one month to less than 6 months post vaccination in another study [4]. However, the basis of protective immunity in immunologically immature fish fry is not known.
Rag1-/-mutant zebrafish lack mature T and B cells, as do young fish, making them an excellent model to study the adaptive component of innate immunity in fish [5]. When
leucocytes from kidneys of RE-33® vaccinated rag1
-/-mutant zebrafish were adoptively transferred into naïve rag1
-
/-mutant zebrafish, the naïve fish demonstrated protective immunity following E. ictaluri challenge [6]. In the rag2
performed [11], but specific conclusions could not be reached.
The purpose of our study was to identify differentially expressed gene transcripts following a primary exposure
(vaccination) and secondary bacteria exposure of WT E.
ictaluri in rag1-/- mutant zebrafish. The results of this study will help us further elucidate mechanisms underlying non-T and B cell-based protective immunity in fish.
2. Materials and Methods
2.1. Animal Source
Rag1-/- mutant zebrafish were produced and reared in the specific pathogen free fish hatchery in the College of Veterinary Medicine following standard operating procedures [5]. The Institutional Animal Care and Use Committee at Mississippi State University approved all propagation, rearing and experimental animal protocols.
2.2. Fish Challenges
During experiments, fish were maintained in 15 L aerated flow-through tanks with charcoal filtered dechlorinated municipal water at 26°C with a water flow rate of 0.5 L/min. Fish were fed twice daily with Zeigler™ Adult Zebrafish Diet (Aquatic Habitats™, Apopka, FL). Adult (6 to 9 month old) rag1-/- mutant zebrafish were anesthetized in 110 mg/L buffered tricaine methanesulfonate (MS222). Each fish was administered an IC (intracoelomic) injection on the lateral line above the anal fin. Depending on the treatment schedule,
zebrafish were vaccinated with a primary exposure of 1x10⁴
CFU/fish RE-33® (AQUAVAC-ESC Intervet, Inc.), or challenged with 1x10⁴ CFU wild type [10] E. ictaluri. The secondary challenge injection tested if the primary vaccination provided protection. Sham treated groups received 10 µl of PBS inoculation per fish. Vaccinated or challenged groups received 10 µl of bacteria-PBS inoculation per fish. The time interval between primary and secondary inoculations was four weeks. Forty-eight hours following vaccination or challenge, hematopoietic tissues of random fish were swabbed with a sterile loop and streaked on BHI plates to confirm E. ictaluri presence (or absence for control treatments).
2.3. Preparation of Vaccination and Bacterial Cultures
All primary vaccinations were 104 CFU/fish of RE33®, a
commercial attenuated E. ictaluri, RE-33®
(AQUAVAC-ESC Intervet, Inc.), [3]. The WT E. ictaluri (#93146) was isolated from fish submitted to the Fish Diagnostic Lab at CVM-MSU. Culture identifications were confirmed by biochemical analysis using the BioMerieux api20E strip (BioMerieux, 69280 Marcy l’Etoile, France). Aliquots (0.5 ml) were stored in 20% glycerol at 28°C until needed for trials, at which time one aliquot was thawed and added into Brain Heart Infusion broth and incubated in a shaker incubator at 30°C overnight. Logarithmic phase cultures were obtained by dilution of the overnight culture 1:10 and
grown until the optical density was 0.4 at 540 nm which corresponds to 108 colony forming units (CFU) per ml. Culture purities were assessed and bacterial concentrations determined by plating serial dilutions on 5% sheep blood agar plates.
2.4. Experimental Design
The transcriptome study consisted of four treatments that received different combinations of primary exposure to
attenuated E. ictaluri RE-33® (AQUAVAC-ESC Intervet,
Inc.), as a vaccination (E1) and/or a secondary bacteria
exposure of WT E.ictaluri (#93146) (E2). The first treatment
was sham vaccinated at day 0 and was challenged with E. ictaluri (E2) four weeks later. This group was designated SE2
and represents the primary immune response. The second treatment received a primary vaccination at day 0 and a PBS injection at four weeks post-injection. This group was designated E1S, and represents a persistent primary response.
The third treatment was vaccinated at day 0 and challenged four weeks later with E.ictaluri. This group was designated E1E2 for vaccinated and challenged with bacteria and gene
expressions of this group represent the secondary (protective) response. The fourth treatment was the control group was not vaccinated and was not challenged with E. ictaluri. This group received PBS injections and was designated SS for sham primary and sham secondary. Fish were euthanized by immersion in 340 mg/L Tricaine Methane Sulfonate (MS-222) (Argent Chemical Laboratories, WA) 48 hours after the secondary inoculation. The kidneys from three fish were collected and pooled for each of three replicates per treatment in the microarray analysis.
2.5. Microarray Analysis
Total RNA was isolated from each of three replicates of pooled kidneys (n=3) from each experimental group by homogenizing the tissue in TRIZOL reagent extraction (Invitrogen) according to the manufacturer’s protocol. The quality of each RNA sample was assessed by measuring RNA integration number (RIN) with the Agilent 2100 Bioanalyzer [12]. The RNA samples used in this experiment had RIN values ranging from 7.3 to 9.4, with most being greater than 9.0. For the qPCR, RNA was extracted from individual kidney samples using RNA direct zol kit (Zymo research, USA). The quantity of RNA was determined by
NanoDrop ND-1000 and ND-8000 8-Sample
Spectrophotometer and stored at -80°C. 100ng cDNA was
prepared from RNA by using Super script III VILOTM cDNA
Synthesis Kit (Invitrogen).
using IVT Labeling kit and GeneChip clean up module respectively. NanoDrop spectrophotometric analysis was used to measure the final yield of the biotin-labeled cRNA and 20µg of biotin-labeled cRNA was fragmented and then hybridized to the chip and labeled with streptavidin-phycoerythrin using the Affymetrix Fluidic station. Chips were scanned using the Affymetrix scanner and image data for zebrafish. The Genome array was processed using the Affymetrix Microarray Suite version 5.0 software. All gene expression data were evaluated for perfect match and mismatch values and normalized to the median measurement for the genes across all the arrays in the dataset.
2.6. Confirming Selected Gene Expression and Analysis of Selected Genes not Present on the Microarray
Expression patterns of four transcripts that were shown to be differentially expressed using the Affymetrix array (stat1b, saa, irf1b, and loc795887) were confirmed by quantitative real-time polymerase chain reaction (qRT-PCR) using the RNA samples used for microarray analysis. The total RNA (2ug) samples were reverse transcribed using super script VILO cDNA synthesis kit (Invitrogen) according to the manufacturer’s protocol to generate first strand cDNA. Then qPCR was performed using hydrolysis probe assays
(arp) or SYBR green assays using Stratagene Mx3000P
instrument (Agilent Technologies). Primers and probes were either published sets or were designed using NCBI Primer
BLAST (http://www.ncbi.nlm.nih.gov/tools/primer-blast/)
(Table 1). All qPCR reactions were 20ul and contained cDNA template derived from 5ng RNA and were performed
in triplicate. Hydrolysis probe assays were done as previously described [13, 14]. The cycling parameters consisted of 10 min at 95°C then 40 cycles of 30s at 95°C, and 1 min at 61°C. SYBR green assays used EXPRESS SYBR GreenER qPCR supermix kit (Invitrogen) following manufacturer’s instructions. The cycling parameters for SYBR green assay are 10 min at 95°C then 40 cycles of 30s at 95°C, 1 min at 57°C, and 15s at 72°C. Melting curve analysis was performed on all SYBR Green assays to confirm that signal was due to the specific amplified product. Pearson correlations of qPCR data with microarray data were performed using SAS 9.2 software (SAS Institute Inc., Cary, NC, USA).
To determine expression levels of ifn , nitr9 and t-bet,
adult rag1-/- zebrafish were exposed to the following
treatments: SS, SE2, E1S and E1E2 with sample size (n) of 5
for each treatment. Fish were euthanized at 24hpi and 48hpi with MS-222 (Argent Chemical Laboratories, WA), kidneys were taken from each fish and RNA was extracted using TRIZOL reagent (Zymo research, USA) and stored at -80°C. Primers and probes for qRT-PCR were either published sets
or were designed using NCBI Primer BLAST
(http://www.ncbi.nlm.nih.gov/tools/primer-blast/) (Table 1). The t-bet primers and probes (Table 1) were designed by Primer3 plus software [15], respectively. All primers and probes were purchased from Eurofins MWG, Operon, Huntsville, Alabama, USA. Amplification of the ubiquitously expressed acidic ribosomal phosphoprotein (arp) gene was used as a housekeeping gene for normalizing [16].
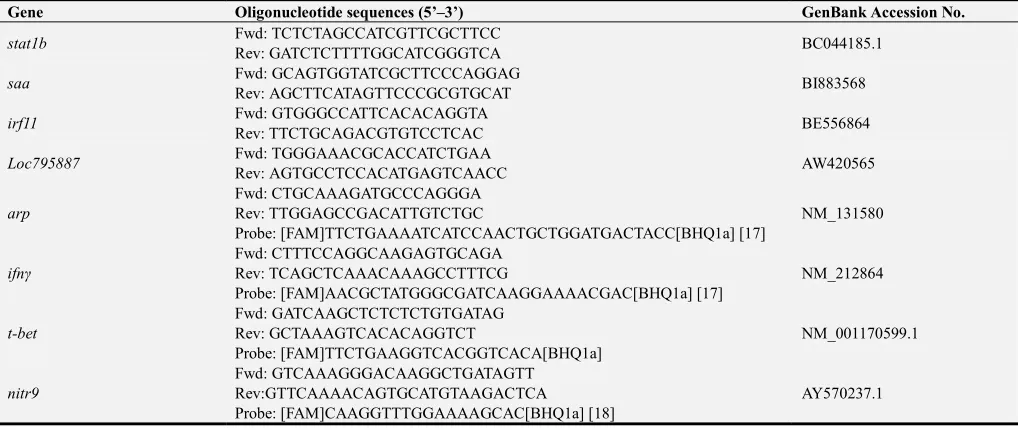
Table 1. Oligonucleotides primer and probe used for qRT-PCR to quantify gene expression levels. Housekeeping gene arp was used as a reference gene. All primers and probes without references were designed by Primer3 plus (GraphPad) software.
Gene Oligonucleotide sequences (5’–3’) GenBank Accession No.
stat1b Fwd: TCTCTAGCCATCGTTCGCTTCC BC044185.1
Rev: GATCTCTTTTGGCATCGGGTCA
saa Fwd: GCAGTGGTATCGCTTCCCAGGAG BI883568
Rev: AGCTTCATAGTTCCCGCGTGCAT
irf11 Fwd: GTGGGCCATTCACACAGGTA BE556864
Rev: TTCTGCAGACGTGTCCTCAC
Loc795887 Fwd: TGGGAAACGCACCATCTGAA AW420565
Rev: AGTGCCTCCACATGAGTCAACC
arp
Fwd: CTGCAAAGATGCCCAGGGA
NM_131580 Rev: TTGGAGCCGACATTGTCTGC
Probe: [FAM]TTCTGAAAATCATCCAACTGCTGGATGACTACC[BHQ1a] [17]
ifnγ
Fwd: CTTTCCAGGCAAGAGTGCAGA
NM_212864 Rev: TCAGCTCAAACAAAGCCTTTCG
Probe: [FAM]AACGCTATGGGCGATCAAGGAAAACGAC[BHQ1a] [17]
t-bet
Fwd: GATCAAGCTCTCTCTGTGATAG
NM_001170599.1 Rev: GCTAAAGTCACACAGGTCT
Probe: [FAM]TTCTGAAGGTCACGGTCACA[BHQ1a]
nitr9
Fwd: GTCAAAGGGACAAGGCTGATAGTT
AY570237.1 Rev:GTTCAAAACAGTGCATGTAAGACTCA
Probe: [FAM]CAAGGTTTGGAAAAGCAC[BHQ1a] [18]
2.7. Data Analysis
Statistical analysis (Student's t-test) was carried out to identify differentially expressed transcripts. The treatment E1S was compared to SS and there were no significantly
different gene expression changes. The SE2 (primary)
treatment group was compared to SS (control), and genes that were significantly different from SS were evaluated in a
pairwise comparison of SE2 (primary) to the E1E2
mapped to UniprotKB and Genbank RefSeq protein accessions. Functional analysis of the differentially expressed transcripts was performed with protein accessions using (pre-existing) GO annotation identification, GO enrichment and pathways and networks. GO annotations of catfish and salmon were identified using Agbase-GOretriever tool [17] and ZFIN GO identified zebrafish genes. GO enrichment analysis was performed using singular enrichment analysis (AgriGO SEA) that computes statistically significant GO term enrichment using Fisher’s exact test for differentially expressed transcripts (DET) compared to their background. Pathways and networks analysis was performed using the Ingenuity pathway analysis (IPA) tool, with parameters of p<0.001 and p<0.05. IPA visualized significant networks and their assigned biological functions from the scientific literature. GO annotations of differentially expressed transcripts compared to the whole array were visualized using the Agbase GOSlim viewer tool [17] with the generic GOSlim set. The percentages of GO terms between the differentially expressed transcripts and the array were compared. GO annotations for the array were obtained from the Affymetrix annotation files. Relative gene expression data was determined using the Delta Delta ct (∆∆ct) analysis method. The data was statistically analyzed by the two-way ANOVA followed by Dunnett's multiple comparisons test using GraphPad Prism version 7.00 for Windows, GraphPad Software, La Jolla California USA.
3. Results
3.1. Microarray Analysis of Global Gene Expression Following Primary and Secondary E. Ictaluri Infection
There were no significant differences in gene expressions between the SS and E1S treatment groups. Transcriptional
profiling in the kidney of rag1-/- mutant zebrafish after the
primary exposure (SS and SE2) demonstrated 129 transcripts
that were significantly up-regulated at 95% confidence (Table 1). The differences in increased transcript expression in primary exposed compared to non-exposed fish were 1 to 4.95 fold. The highest fold expression differences (3.8 to 4.95) were SAA, chemokine CCL-C5a, signal transducer and activator of transcription 1b (STAT 1b), interferon regulatory factor 11, and myxovirus resistance A. Gene expressions with 2.1 to 2.7 fold differences were complement components 7 and 1, ceruloplasmin, kappa light polypeptide gene enhancer and inhibitor alpha a, chemokine C-X-C motif receptor 3.1, and calreticulin (like). The majority of the up-regulated transcripts were grouped into acute phase response, complement activation, immune response, response to stimulus, protein degradation and processing, proteasomes and heat shock protein categories. Transcripts that were significantly differentially expressed less than 2.1 fold are shown in the Appendix Table A1.
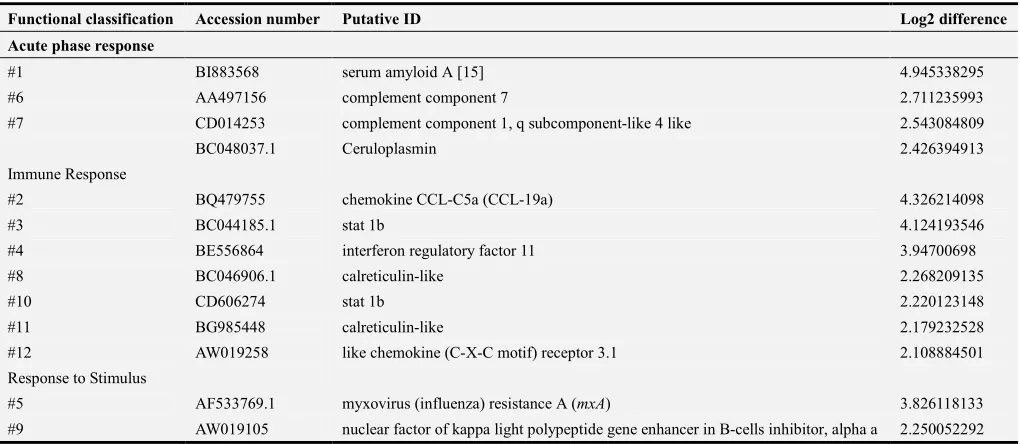
Table 2. Log2 changes in expression of zebrafish transcripts that were up-regulated (p< 0.05) following primary infection (SE2) compared to non-infected (SS)
controls. The highest fold differences (3.8 to 4.95) of annotated genes are shaded dark gray, while the second highest fold differences (2.1 to 2.7) are shaded light gray. The annotated genes with the highest fold differences are also rated #1 to #12. Zebrafish transcripts that were up-regulated (p< 0.05) following primary infection (SE2) compared to non-infected (SS) controls less than 2.1 fold are listed in Supplemental Table 1.
Functional classification Accession number Putative ID Log2 difference Acute phase response
#1 BI883568 serum amyloid A [15] 4.945338295
#6 AA497156 complement component 7 2.711235993
#7 CD014253 complement component 1, q subcomponent-like 4 like 2.543084809
BC048037.1 Ceruloplasmin 2.426394913
Immune Response
#2 BQ479755 chemokine CCL-C5a (CCL-19a) 4.326214098
#3 BC044185.1 stat 1b 4.124193546
#4 BE556864 interferon regulatory factor 11 3.94700698
#8 BC046906.1 calreticulin-like 2.268209135
#10 CD606274 stat 1b 2.220123148
#11 BG985448 calreticulin-like 2.179232528
#12 AW019258 like chemokine (C-X-C motif) receptor 3.1 2.108884501 Response to Stimulus
#5 AF533769.1 myxovirus (influenza) resistance A (mxA) 3.826118133 #9 AW019105 nuclear factor of kappa light polypeptide gene enhancer in B-cells inhibitor, alpha a 2.250052292
To analyze the secondary response, the gene expressions of E1E2 and SE2 were compared. After disregarding genes
identified in the primary exposure, 98 significantly differentially expressed transcripts were identified and associated with protective immunity (Table 2). Forty-six transcripts were up-regulated, and 52 transcripts were down-regulated in E1E2 compared to SE2. In annotated genes, the
Table 3. Log2 changes in expression of zebrafish transcripts that were differentially expressed (p< 0.05) between the secondary (E1E2) and primary (SE2)
exposures. The highest fold differences (2.24 to 3.10) of annotated genes are shaded dark gray. The annotated genes with the highest fold differences are also rated #1 to #4. Zebrafish transcripts that were differentially expressed (p< 0.05) between the secondary (E1E2) and primary (SE2) exposures less than 2.1 fold
are listed in Supplemental Table 2.
Functional classification Accession number Putative ID Log2 difference Immune Response
#1 BI476419 chemokine CCL-C5a (CCL-C19a) 3.1044014
#4 BI865907 relaxin 3a 2.2479468
Cell proliferation
#3 D49972.1 bone morphogenetic protein 4 2.2686536
Miscellaneous
#2 BI982955 myomegalin-like 2.7361798
3.2. ID Mapping
The functional analysis of the differentially expressed transcripts was performed by mapping the transcripts sequence to protein identifiers/accessions of their putative products and were categorized based on the function of the gene product. Of the 98 proteins identified, 64% coded for predicted proteins that had UniProtKB and GenBank RefSeq protein IDs, 46% were up-regulated and 53% were down-regulated. Of the unannotated genes, 26% were expressed sequence tags (ESTs) that did not have connections to predicted known zebrafish genes, and 1% were not listed in NCBI. Annotations for the remaining genes (7%) were not in the NCBI database. However, these genes had UniProtKB and GenBank RefSeq protein accession IDs, so they were included in the analysis along with the 64% predicted proteins. Thus, 71% of the protein identifiers were used in the analysis.
3.3. Functional Analysis
Comparison of the differentially expressed transcripts and the total array transcripts demonstrated that molecular functions such as actin binding, receptor binding, lipid binding and nucleic acid binding were over-represented as 4.75, 4.42, 2.34, and 2.14 fold, respectively. Protein binding, protein kinase activity, and catalytic activity were under-represented by 0.13, 0.25 and 0.48 fold, respectively. Additionally, proteinaceous extracellular matrix, extracellular space, cytoplasmic membrane-bound vesicles, nucleolus, cytoskeleton and chromosome components were over-represented in differentially expressed transcripts by 15.65, 5.6, 3.5, 2.7, 2.38 and 1.92 fold respectively, while, various organelles and cytoplasm sub-categories were under-represented by 0.65 and 0.33 fold respectively. In the biological
process category, response to endogenous stimulus, cell-cell signaling, and cell proliferation were over-represented in differentially expressed transcripts by 4.63, 1.98, and 1.90 fold respectively, while protein metabolic process, cellular component organization and transport were under-represented by 0.46, 0.26, and 0.21 fold, respectively.
Out of 71 differentially expressed transcripts that had UniProt IDs, 32 had GO annotations and 21 GO terms associated with these were significant (p<0.05). These were in two categories: (i) molecular function: catalytic activity, binding, nucleic acid binding, DNA binding, cation binding, receptor binding, metal ion binding and transition metal ion binding and (ii) cellular component: extracellular region, cell, cell part, intracellular, intracellular part, organelle, intracellular organelle, membrane-bound organelle, intracellular membrane-membrane-bound organelle. The molecular functional group had 8 enriched GO (child/secondary) terms. There were three significantly enriched GO terms in the cellular component category: cellular component, molecular function and biological process. None of these were directly connected to each other.
3.4. Confirming Selected Gene Expression and Analysis of Selected Genes not Present on the Microarray
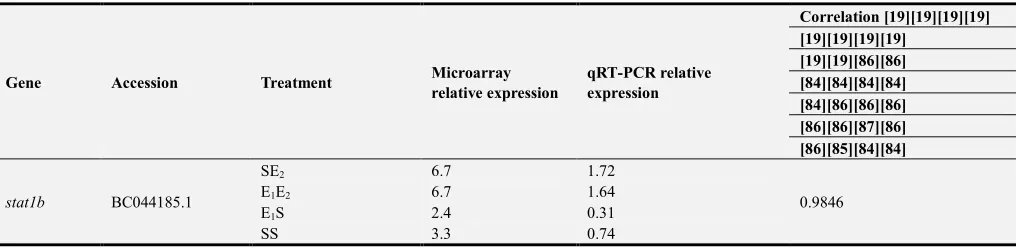
Relative expression values of stat1b, saa, irf1b, loc795887
from the microarray and qRT-PCR were strongly correlated, with R values >0.95 (Table 4). The analysis of ifnγ, nitr9 and
t-bet expressions between SS, SE1 and E1E2 treatments
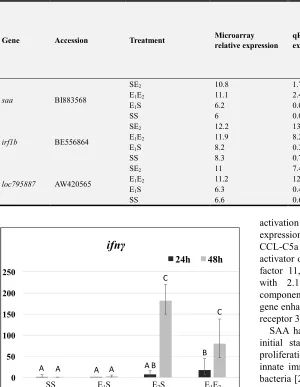
demonstrated significant increases in ifnγ expression (Fig. 1
and Supplemental Table 4). Within treatments, ifnγ
expression was significantly greater at 48 hpi, than at 24 hpi. There were no significant differences in nitr9 and t-bet
expressions between treatments.
Table 4. Correlation of selected genes used for confirmatory qRT-PCR.
Gene Accession Treatment Microarray relative expression
qRT-PCR relative expression
Correlation [19][19][19][19] [19][19][19][19]
[19][19][86][86] [84][84][84][84] [84][86][86][86] [86][86][87][86] [86][85][84][84]
stat1b BC044185.1
SE2 6.7 1.72
0.9846
E1E2 6.7 1.64
E1S 2.4 0.31
Gene Accession Treatment Microarray relative expression
qRT-PCR relative expression
Correlation [19][19][19][19] [19][19][19][19]
[19][19][86][86] [84][84][84][84] [84][86][86][86] [86][86][87][86] [86][85][84][84]
saa BI883568
SE2 10.8 1.74
0.9839
E1E2 11.1 2.4
E1S 6.2 0.01
SS 6 0.01
irf1b BE556864
SE2 12.2 13.6
0.9563
E1E2 11.9 8.2
E1S 8.2 0.35
SS 8.3 0.7
loc795887 AW420565
SE2 11 7.42
0.9511
E1E2 11.2 12.2
E1S 6.3 0.4
SS 6.6 0.60
Figure 1. Fold changes in ifnγ gene expression in kidney 24 and 48 hpi of E. ictaluri, measured by quantitative real-time PCR. Data are presented as mean fold change relative to the PBS control group ± standard deviation based on Log2 data analysis. hpi= hours post injection. *Significant (p<0.05) difference in expression between treatments; treatments with the same letter are not different.
4. Discussion
4.1. Primary Response
There are several studies analyzing the gene responses of catfish to E. ictaluri infection. Differences in responsive genes in blue catfish [20] and channel catfish [11] demonstrate there are species specific responses to the same bacteria. There have not been any studies performed analyzing the gene responses of zebrafish to E. ictaluri. In our study, transcriptome analysis comparing the primary response to non-exposed controls revealed 129 functionally known genes that were significantly up-regulated. These genes were involved in acute phase response, complement activation, immune response, response to stimulus, proteasomes, protein degradation, chaperons, processing and heat shock protein categories. These are normal components of the innate response and cellular injury and indicate
activation of the innate immune system. The highest fold expression differences (3.8 to 4.9) were SAA, chemokine CCL-C5a (also named CCL-C19a), signal transducer and activator of transcription 1b (STAT 1b), interferon regulatory factor 11, and myxovirus resistance A. Gene expressions with 2.1 to 2.7 fold differences were complement components 7 and 1, ceruloplasmin, kappa light polypeptide gene enhancer and inhibitor alpha a, chemokine C-X-C motif receptor 3.1, and calreticulin (like).
SAA has multiple isoforms that are expressed during the initial stages of inflammation, and affect cell adhesion, proliferation and migration. Serum amyloid A is also an innate immune opsonin, and binds to some Gram-negative bacteria [21], with the outer membrane protein A [22] being the major ligand. Edwardsiella ictaluri is a gram-negative bacteria, and in our study, SAA could be acting as a pattern recognition protein for the OmpA of E. ictaluri. In rainbow trout, SAA was upregulated 72 and 96 hours post bacterial injection [23]. Another heat shock protein, Hsp 60, was up-regulated in primary exposed fish compared to non-exposed fish. Hsp60 in humans is associated with functional TLR-4 and is involved in ATP-dependent protein folding. Hsp 90 functions as a chaperone and is involved in housekeeping functions such as protein folding and unfolding [24].
Chemokine CCL-C5A (also known as CCL-19 or 19a) was another of the primary response genes that were in the highest up-regulated group. The CCL-C5a gene was
expressed in zebrafish embryos at 8 hpi of Salmonella
enterica serovar Typhimurium [25]. The zebrafish genome has over 100 chemokine genes, but the functions have not been well studied [26]. CCL-C5a (CCL-19) was the highest up-regulated gene in the secondary response, and is discussed more later.
Chemokines are expressed by various cell types in response to inflammatory stimuli. Chemokines also induce various biological activities such as effects on degranulation, cell division, cell activation and secretion of cytokines in both leukocytic and non-leukocytic cell types [27]. In our study, the presence of cytokines was supported by the up-0
50 100 150 200 250
24h 48h
A A
B
SS E1S E2S E1E2 A A AB
C
regulated expression of 19 chemokine (C-C motif)-like molecules that induce cytokine secretion from leukocytes as well as provides pro-adhesive and migratory signals. CC chemokines promote chemotaxis of anti-tumor NK cells [28]. Zebrafish have increased number of chemokines due to duplication events. Subfamilies such as CXC, CC, XC and CX were found in zebrafish. CX is a novel subfamily found only in zebrafish. It is speculated that these novel chemokine genes are involved specifically in zebrafish development. To cope with environmental challenges, each species has species-specific chemokines during their evolution [26]. Zebrafish have an extensive chemokine system and a well established CC chemokine family [29]. To understand this complex network of molecules further research needs be carried out to in zebrafish [30], with loss of stat3 function resulting in immune disorders in zebrafish [31]. Among the immune response related transcripts, suppressor of cytokine signaling 1, present in multiple forms in fish, is up-regulated in response to infection.
Signal transducer and activator of transcription 1b, or STAT1b, was in the highest up-regulated group of the primary response genes. STAT proteins have important roles in immune cell-cell communication. Stat1, stat3 and stat5
have been identified in zebrafish [32]. Stat1b expression was significantly up-regulated following infection in zebrafish [33]. The up-regulation we observed in our study could have also resulted from increased ifnγ production. Another study
suggested that stat1b promotes myeloid development in
zebrafish [34].
Interferon regulatory factors (IRFs) are a large family of transcription factors involved in host immune response, haemotopoietic differentiation and immunomodulation [35], [32]. Interferon regulatory factors were identified originally as transcription factors in the regulation of interferon expression [36]. There are nine IRF orthologs in mammals, and all of these have been identified in fish, with zebrafish having additional factors: IRF 11 and IRF 12 [37].
MX GTPAses play key roles in viral immunity, and
myxovirus resistance A genes are up-regulated by ifnγ
signaling [38], as are stat1a and stat1b. Vertebrate Mx were compared, and similarities grouped them into fish mx, avian
mx, human mx2-like, and human mx1-like [39]. Diverse mx
proteins are found in fish [40]. In our study, up-regulated mx
probably resulted from increased ifnγ production.
Other genes encoding acute phase proteins that were
up-regulated in response to primary infection were
ceruloplasmin and major acute phase reactant apolipoprotein of the HDL complex. Ceruloplasmin is involved in iron binding, homeostasis and transport. One important innate defense is the sequestering of iron to limit the availability of this critical nutrient to the invading bacteria.
Nearly 35 transcripts were up-regulated which were associated with proteasomes, protein degradation and processing. Proteasomes are involved in non-lysosomal intracellular protein degradation [41], cell cycle regulation as well as various cellular processes such as proliferation, differentiation, apoptosis and response to external stimuli [42].
Some of the up-regulated transcripts have roles in protein
processing and folding such as dolichyl-diphospho
oligosaccharide-protein glycosyltransferase, glycosyltransferase-like domain containing 1 and Dnajb 11 protein. The antigenic peptides presented on MHC I molecules are produced by proteolytic degradation in the cytosol by proteasome, transported to endoplasmic reticulum, and loaded onto MHC I molecules with the help of several other proteins. The upregulation of the ER chaperone calreticulin which is present in various forms, further support the MHC I mediated immune response. Calreticulin is unique in its ability to bind to peptides that are suitable to be loaded on MHC I molecules [43].
At least 6 of the up-regulated transcripts encoded complement components including C1q like genes, C3b, factor B, C7 and C9, indicating the involvement of the complement systems in response to infection. The teleost fish complement system exhibits conserved roles such as sensing and clearing the invading pathogens [44]. The expression of complement system components has been shown to be responsive to infection in other fish. Analysis of complement protein indicated the key involvement of the C7 gene in tissue specificity and pathogen responses [45]. The C7 responses in grass carp were sensitive and rapid in response to a pathogenic bacterial infection and indicates the involvement of C7 in innate immune responses [45]. Complement component C1q like gene is involved in the classical pathway [46].
Fibroblast growth factor (FGF) and FGF receptor (FGFR) gene families in the human and mouse comprise 22 and 4 members, respectively. In zebrafish, the FGF gene family comprises 27 members. The co-evolution of FGF and FGFR gene families enabled the FGF signaling system to acquire functional diversity. This has allowed the involvement of FGF signaling in many physiological and developmental processes. FGF knockout and mutation studies in mice and zebrafish respectively indicated the crucial role of FGFs in various developmental processes [47]. FGF-2 is involved in cytokine interaction networks for positive regulation of hematopoiesis and in the regulation of pathological and
physiological hematopoiesis, granulopoiesis, and
megakryocytopoiesis. Granulopoiesis is mediated by FGF-2 though secondary cytokine production, stimulation of granulocytic progenitor growth and differentiation. FGF-2 stimulates proliferation, enhances cytokine secretion and prevents apoptosis. It is also involved in proliferation and/or survival of hematopoietic progenitors [48]. FGF-2 is expressed in stromal cells, macrophages and leukemic cell lines and is involved in physiological and pathological hematopoiesis [48]. FGF4 is vital for the development of visceral organs and is transcriptionally regulated by lymphoid enhancer factor-1[49] belonging to subfamily of HMG proteins [50]. In our study FGF4 was down regulated in the immunized fish.
in MLL failed to differentiate into any of HSC types in fetal liver or in adult animals [52]. Germline loss-of-function studies have demonstrated that MLL is essential for both development and maintenance of HSC [51, 52]. MLL is maternally supplied, expressed in the adults and is an important transcriptional regulator during the entire lifespan of zebrafish [53].
Alpha-melanin concentrating hormone (MCH) plays an important role in host defense. Alpha-MCH is an ancient anti-inflammatory peptide produced by phagocytes and keratinocytes. Increased expression of α -MCH in the blood indicates infectious and inflammatory disorders. Elevated levels of α-MCH in human plasma have antimicrobial functions [54]. Under inflammatory conditions, MCH receptor (MCHR1) expression was up-regulated on human colonic epithelial cells [49]. In our study fish hematopoietic tissue may have been inflamed due to the injection of E. ictaluri, resulting in up-regulated MCHR1 expression in kidney epithelial cells. In the present study MCH receptor 1 was up-regulated in immunized fish, suggesting that the innate immune system is providing enhanced protection for the immunized fish compared to the non-immunized fish.
4.2. Secondary Response
Transcriptome analysis comparing the E1E2 (secondary
response) and SE2 (primary response) treatment groups
demonstrated 98 significantly differentially expressed transcripts that were uniquely associated with the secondary response, and protective immunity. In annotated genes, the highest fold expression differences (2 to 3 fold) were C-C
like chemokine 19 (CCL-5a), myomegalin, bone
morphogenetic protein 4, and relaxin 3a.
The gene for chemokine CCL-5a (CCL-C19) had the highest differential expression (3.1 fold) following the secondary response. This gene was the second highest differentially expressed gene in the primary response (4.3 fold), emphasizing its importance in the immune responses of
rag1-/- mutant zebrafish. Inflammatory chemokine genes are expressed after an immune stimulus, and result in the re-location of leukocytes to the site of inflammation [21], but their functions are not well studied [26]. The CC chemokines have two cysteine residues bound directly to each other and are the largest sub-family of chemokines. One study stated zebrafish have 46 CC chemokine genes [55], and another reported 63 chemokine genes [29]. In our study, up-regulation of CCL-5a suggests significant cell trafficking in the secondary response. In rainbow trout, C5a was shown to enhance antibody response to a viral protein [56].
Myomegalin is also known as phosphodiesterase 4D-interacting protein. Four genes encode over 20 isoforms of this protein, and they are involved in intracellular signaling [57]. Intracellular signaling and cross-talk occurs between cells and between pathways, and between tissues. Pathway interactions operate in multiple directions. The cAMP phosphodiesterases are required for cell signaling and cross-talk [57]. Certain isoforms of myomegalin are necessary for centrosomal microtubule formation [58] and protein
trafficking between Golgi and endoplasmic reticulum [59]. These findings suggest heightened cell signaling and pathway cross-talk.
Bone morphogenic proteins (BMP) are signaling cytokines belonging to the superfamily of TGF-βs and are involved in the regulation of cell proliferation, differentiation, apoptosis and morphogenesis [60-62]. Function and development of specific hematopoietic lineages are mediated by individual BMP’s [63]. They are also involved in blood vessel formation [64].
In our study, bone morphogenetic protein 4 (BMP4) was one of the highest up-regulated genes in the secondary response. In mammals, it is involved in embryonic hematopoiesis [65]. BMP endothelial cell precursor derived regulator (BMPER), is an extracellular BMP modulator that plays an important role in BMP4 function in endothelial cells [66, 67]. Both BMP and BMPER are necessary for endothelial cells to deliver pro-BMP signals [66]. BMPER is also involved in endothelial cell migration [66] by modulating the expression of adhesion molecules [68]. Zebrafish BMP4 shares 68% identity and 80% similarity to that of human, mouse and frog BMP4 [69]. Its expression is associated with the developing pronephric mesoderm in normal zebrafish.
Relaxins (RLN) are a pleotropic hormone group with a wide range of biological and pathological activities in various tissues and organs in various physiological and pathological conditions [70]. Relaxins are hormones that regulate the migration of leukocyte to sites of inflammation, and increases substrate adhesion [71]. Teleost RLN3a and RLN3b paralogues display similarities in evolution and expression to the mammalian counterparts [72]. Relaxins regulate vasodilation and the movement of macrophages to the site of infection in response to cytokines. Relaxins are involved in wound healing, fibrosis, allergic responses [73] regulation of appetite and feeding in rats [74]. RLN3 acts as a neurotransmitter. Relaxins act on inactivation of contractile machinery leading to cell relaxation. It is also involved in vasodilation in several organs and tissues [70]. Dilation of the blood vessels is a result of the movement of tissue macrophage derived cytokines to the site of injection and/or bacterial presence, which in turn leads to the movement of leucocytes such as neutrophils and monocytes to the site of bacterial infection [75]. Up-regulated expression of RLN3 in immunized fish compared to non-immunized fish suggests enhanced leukocyte migration and adhesion during the secondary memory response.
Go functional analysis demonstrated the over represented transcripts included genes coding molecular processes such as actin binding, receptor binding, lipid binding, nucleic acid binding, proteinaceous extracellular matrix, extracellular space, cytoplasmic membrane bound vesicles, nucleolus, cytoskeleton and chromosome components, response to
endogenous stimulus, cell-cell signaling and cell
proliferation. The underrepresented categories were
sub-categories, protein metabolic process, cellular component organization and cellular transport. AgriGO:GO enrichment analysis revealed pancreas specific transcription
factor 1a (ptf1a), fibroblast growth factor 2, bone
morphogenetic protein 4, fibroblast growth factor 4, BMP binding endothelial regulator, spondin 2b, extracellular matrix protein, high-mobility group protein (hmgp) isoforms I and Y, nuclear receptor subfamily 6, myosin-10-like, collagen triple helix repeat containing 1b, type I collagen, alpha 2 collagen, type XI alpha-2 collagen, 19 (chemokine (C-C motif)-like) and novel immune-type receptor 1(nitr1).
Different categories and GO terms that were over represented in the secondary response compared to the primary response are consistent with a cell mediated protection for vaccinated rag1-/- mutant zebrafish. Cell activation is evidenced by the over representation of cell communication, signal transduction and receptor binding categories. Activated cells were believed to be involved in secreting pro-inflammatory cytokine, effector cytokines and undergoing clonal proliferation, which was evidenced by up-regulated expression of ifnγ and C-C chemokine, and over representation of the cell proliferation category respectively in E1E2 (secondary) compared to SE2 (primary). Activation of
leukocytes is a cell differentiation process. Cell
differentiation is suggested by the over representation of transport, structural morphogenesis, intracellular membrane bound organelles and cellular metabolic process categories. Functional analysis of differentially expressed transcripts between E1E2 and SE2 associated with specific secondary
immune responses corroborate potential heightened and more rapid responses of cells involved in the secondary response.
Over representation of cell communication, signal transduction and receptor binding categories demonstrates receptor activation and its communication with downstream signaling molecules. Upregulation of ptf1a suggests the occurrence of signal transduction because of receptor mediated cellular activation. The function of clonal proliferation is supported by the over representation of the category “cell proliferation” as well as the transcripts such as fibroblast growth fator-2 (fgf-2), fgf-4, bone morphogenetic
protein– 4 (bmp-4), BMP binding endothelial regulator
protein (bmprp), hmgi/y, and ptf1a which regulate
proliferation. Hmgi/y proteinsparticipate in a wide variety of cellular processes including transcriptional regulation and inducing changes in chromatin structure during cell proliferation [76]. Increased expression of hmgi/y occurs during rapid proliferation of certain cells from rat embryos and from undifferentiated cells of young rat thymi [77]. HMGI/Y binds specifically to A-T rich regions on the double stranded DNA [78], affecting chromatin conformation to regulate gene expression by facilitating the binding of transcription factors to dsDNA [79, 80]. In our experiment,
hmgi/y expression may be associated with rapid expansion of the ‘memory’ cell population following secondary exposure. The rate of transcription of large proportions of immune response related genes such as ifnβ, e-selectin, tnf-β, il-2 and granulocyte macrophage colony stimulating factor (gm-csf)
and certain chemokines are correlated to the presence of
hmgi/y protein [81]. This protein binds with transcription factors and affects its binding to DNA by introducing bends in the DNA [81]. In our study HMGI/Y up-regulation correlates with the over representation of binding, and certain GO terms such as sequence-specific DNA binding transcription factor activity.
To perform cytotoxic functions, cells undergo cytoskeletal remodeling. These functions are suggested by the over representation of the “structural morphogenesis” category and differential expression of the transcripts myosin 10, envoplakin, collagen triple helix repeat containing 1b, collagen type I, collagen type alpha 2, collagen type XI alpha-2 and resistance to inhibitors of cholinesterase 8 proteins (ric-8) that perform structural morphogenesis. Another up-regulated functional group is “proteinaceous extracellular matrix”. Cytoskeletal rearrangement is further supported by up-regulated expression of spondin 2. Spondin 2 (mindin) like lectin is an extracellular matrix (ECM) protein that plays essential roles in innate immunity [82].
Spondin 2 recognizes intracellular pathogens [82]. It acts as a unique pattern recognition moiety [83] for macrophages by direct interaction with LPS components on pathogenic microbes [82] and interacts directly with receptors on neutrophils [84]. E. ictaluri is a facultative intracellular
pathogen, and spondin 2 may be playing an important role in
recognizing E. ictaluri when they are localized in
intracellular compartments. Spondin 2 may also enhance
macrophage phagocytosis of E. ictaluri when they are
located in extracellular compartments. The extracellular space sub-category was up-regulated 5 fold. The genes included in extracellular space are bone morphogenic protein - 4 (bmp-4), collagen - 2 (coll-2), fibroblast growth factor - 4 (fgf-4), myosin heavy chain14 (myhc14), and spondin2.
Using the GOSlim Viewer resulted in three categories of GO annotations: cellular components, molecular functions and biological process. The over represented sub-categories from the cellular component category are (i) cell part, (ii) cell organelle, (iii) intracellular, (iv) plasma membrane, (v) cellular component in general and (vi) protein complex. In our study a sub-category of cell part, cytoplasmic membrane bound vesicles, was over represented. These genes are involved in transportation of macromolecules to their cellular destinations. Macromolecules are exchanged between endoplasmic reticulum, golgi apparatus, lysosomes and plasma membrane through vesicular transport [85]. In addition, sub-category “intracellular” is also overrepresented which may be due to efforts to eliminate the E. ictaluri, an intracellular pathogen. This idea is further substantiated by the over representation of the sub-category ‘transporter activity’ from ‘molecular function’ category and ‘transport’ from ‘biological process’ category.
FGF2 is involved in granulopoiesis in response to bacterial infection. Up-regulated expression of FGF2 and bone
morphogenetic protein BMP4 suggests increased
hematopoiesis.
cells that selectively binds to vascular endothelial growth factor (VEGF) [86]. NP-1 supports the protective mechanisms of VEGF on glomerular endothelial cells, preventing damage and apoptosis. NP-1 expression in glomeruli is correlated with damage [87]. It was also reported that NP-1 is involved in the initiation of the primary immune response [88]. Expression of NP1 in the immunized fish was low compared to non-immunized fish, suggesting that the immune system protected kidney tubules from damage by the bacteria. MLL was down-regulated, while FGF2 and BMP4 were up-regulated in immunized fish compared to the non-immunized fish after bacterial challenge, suggesting dynamic regulation of hematopoiesis in the vaccinated fish.
RIC-8 is a unique non-receptor [89] guanine nucleotide exchange factor that enhances the exchange of GDP-GTP in the absence of receptor binding to the membrane [90] and is
involved in PGDFR mediated actin cytoskeletal
rearrangements [91]. Upregulation of RIC-8A in the immunized fish suggests involvement in cell differentiation.
The signals that are involved in the induction of immune responses often suppress other processes. The immune response in zebrafish had increased expression of cytokines and interferon induced genes and dynamic regulation of factors that control hematopoiesis. Other factors that are more vegetative in nature were significantly down-regulated, which include nuclear receptor subfamily 6, group A, member 1 (NR6A1), envoplakin, collagen triple helix containing-1, collagen I and collagen XI, myosin binding protein C, Myosin 10, A-kinase anchoring proteins, synaptotagmin, pancreatic transcription factor 1a, ceramide synthases proteins (TLC domain containing 1 and Na(+), K(+) ATPase), and genes involved in gonadal development (doublesex- and mab-3-related transcription factor 1). Further, cellular migration is supported by the differential expression of spondin 2, bmp-4 and fgf-2.
Another large functional category with up-regulated transcripts is the “immune response” category. Some of these
included up-regulated transcripts such as chemokine CCL-C5a, signal transducer and activator of transcription 1b (STAT1b), interferon regulatory factor 11, colony stimulating factor 1 receptor alpha, TNF receptor-associated factor, TNF ligand superfamily member 10, TNF receptor-associated factor 2a, coagulation factor V, lipopolysaccharide-induced TNF factor, interleukin enhancer binding factor 2 and nuclear factor kappa light polypeptide gene enhancer in B-cells inhibitor, alpha.
Ifnγ expression was significantly greater in exposed than control fish. In both the primary and secondary responses,
ifnγ expression was significantly greater at 48 hpi than 24 hpi. However, ifnγ expression was the same in the primary and the secondary responses.
5. Conclusion
Our findings suggest the primary immune response and innate immune cells are not impaired in T and B cell deficient mutant zebrafish. Acute phase proteins play the predominate role in the primary response, and cell trafficking proteins play a dominant role.
In the secondary response, cell trafficking proteins play the predominate role. Up-regulation of genes involved in cell signaling and cell cross-talk suggest receptor recognition and activation. Cell proliferation and cytotoxic functions were significantly up-regulated, suggesting expansion of cell populations. Up-regulation of genes involved in structural morphogenesis, intracellular transport and cellular metabolic processes suggest cell functions are occurring at a heightened level.
Significantly increased ifnγ expression is associated with primary and secondary protective responses in rag1-/- mutant zebrafish. This expression is significantly greater at 48 hpi than 24 hpi, but is the same in primary and secondary responses.
Appendix Supplementary Data
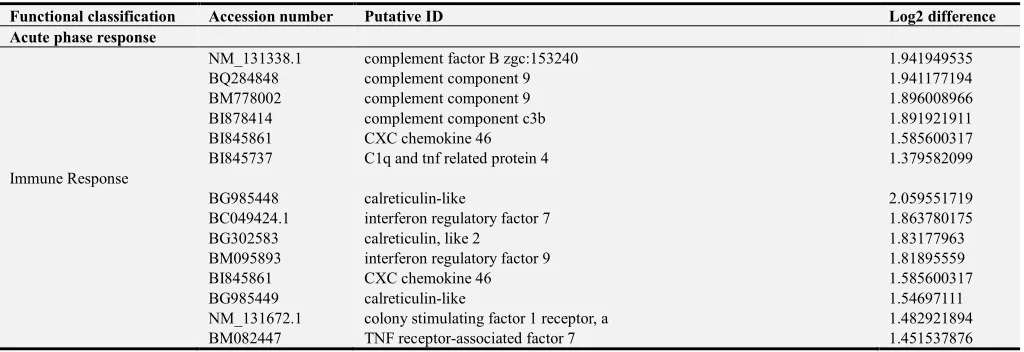
Table A1. Log2 changes in expression of zebrafish transcripts that were up-regulated (p< 0.05) less than 2 fold differences following primary infection (SE2)
compared to non-infected (SS) controls.
Functional classification Accession number Putative ID Log2 difference Acute phase response
NM_131338.1 complement factor B zgc:153240 1.941949535
BQ284848 complement component 9 1.941177194
BM778002 complement component 9 1.896008966
BI878414 complement component c3b 1.891921911
BI845861 CXC chemokine 46 1.585600317
BI845737 C1q and tnf related protein 4 1.379582099
Immune Response
BG985448 calreticulin-like 2.059551719
BC049424.1 interferon regulatory factor 7 1.863780175
BG302583 calreticulin, like 2 1.83177963
BM095893 interferon regulatory factor 9 1.81895559
BI845861 CXC chemokine 46 1.585600317
BG985449 calreticulin-like 1.54697111
Functional classification Accession number Putative ID Log2 difference Acute phase response
Z46776.1 MHC class I gene 1.453299417
BM775009 tnf (ligand) superfamily, member 10 like 4 1.444936285
BI983290 calreticulin, like 2 1.377430169
CA474845 Tnf receptor-associated factor 2a 1.328678832
AF515275.1 coagulation factor V 1.328445833
AW232141 LPS-induced TNF factor 1.318596853
AW232141 LPS-induced TNF factor 1.318596853
NM_131047.1 calreticulin 1.262957707
BM102177 like CC chemokine SCYA103 1.063116385
Response to Stimulus
AF510108.1 HSP 90, beta (grp94), member 1 1.839962141 NM_153657.1 prostaglandin-endoperoxide synthase 2a 1.829305794
NM_131157.1 crystallin, alpha B, a 1.779110338
AW232570 glutathione peroxidase 1b 1.753479161
BI474294 ras homolog gene family, memberGb 1.548966166 Protein degradation
AI878703 proteasome (prosome, macropain) 26S subunit, non-ATPase, 12 1.882078969 NM_131678.1 proteasome (prosome, macropain) subunit, beta type, 9b 1.547871834 AW420599 proteasome (prosome, macropain) subunit, alpha type, 2 1.537063194 NM_131795.1 proteasome (prosome, macropain) subunit, alpha type, 6b 1.465710587 BM776726 proteasome (prosome, macropain) subunit, alpha type,5 1.46080581 NM_131375.1 proteasome activator subunit 1 1.456107519 BC049010.1 proteasome (prosome, macropain) subunit, beta type, 3 1.361401934 NM_153655.1 proteasome (prosome, macropain) subunit, alpha type, 6a 1.289222347 BI534099 proteasome (prosome, macropain) subunit, beta type, 2 1.209112514 BM037579 proteasome (prosome, macropain) subunit, beta type, 1 1.200739227 AI477254 proteasome (prosome, macropain) 26S subunit, ATPase, 3 1.167589576 AA658796 proteasome (prosome, macropain) subunit, alpha type, 8 1.157853387 BI867867 proteasome (prosome, macropain) assembly chaperone 1 1.155346818 BC044358.1 proteasome (prosome, macropain) 26S subunit, non-ATPase, 7 1.117427693 BM859971 proteasome (prosome, macropain) subunit, beta type, 4 1.111095754 BG305906 proteasome (prosome, macropain) 26S subunit, ATPase, 1b 1.110038362 BC049471.1 proteasome (prosome, macropain) 26S subunit, ATPase, 1a 1.083532561 AI943154 proteasome (prosome, macropain) 26S subunit, ATPase, 6 1.036215752 BM102205 proteasome (prosome, macropain) 26S subunit, non-ATPase, 3 1.03255884 BC045970.1 proteasome (prosome, macropain) subunit, alpha type, 4 1.024666414 BI867479 proteasome (prosome, macropain) 26S subunit, ATPase, 4 1.022923298 BC042325.1 proteasome (prosome, macropain) 26S subunit, non-ATPase, 12 1.015459136 Miscellaneous
CA472784 ubiquitin carboxyl-terminal hydrolase L5 1.22927282 BI672243 translocase of inner mitochondrial membrane 8 homolog A (yeast) 1.228679678
AW171078 SWI/SNF related, matrix associated, actin dependent regulator of chromatin,
subfamily a, member 5 1.247599938
AI965054 NSFL1 (p97) cofactor (p47) 1.225614645
AL925726 fatty acid binding protein 1b-like 1.243418738 AL925726 fatty acid binding protein 1b-like 1.243418738 BQ450267 IMP4, U3 small nucleolar ribonucleoprotein, homolog (yeast) 1.242436608
BI865765 CDP-diacylglycerol-inositol 3-phosphatidyltransferase (phosphatidylinositol
synthase) 1.242263428
BM186551 protein O-fucosyltransferase 2 1.236996416 BC053310.1 iroquois homeobox protein 4a 1.235529787 CD605135 NHa-ras Harvey rat sarcoma viral oncogene homolog b 1.233934081 BG305942 Novel protein like vertebrate cyclic nucleotide gated channel protein family 1.231240895
AW171596 centrosomal protein 55 like 1.219244028
AW777876 tyrosyl-tRNA synthetase 1.210944877
BC049319.1 vaccinia related kinase 2 1.208703546
BI881888 nuclear factor of kappa light polypeptide gene enhancer in B-cells 2,
p49/p100 1.20805041
CD283149 asparagine synthetase 1.20485812
BI983167 calcineurin-like phosphoesterase domain containing 1 1.201518532 Unannotated
AW174559 wu:fj05f05 4.730217037
AI496754 --- 4.373735771
AI496738 wu:fb64b08 3.866031518
BQ616817 -- 3.619344146
Functional classification Accession number Putative ID Log2 difference Acute phase response
BM186508 zgc:152945 2.830896542
BI672165 --- 2.697690393
BI878415 --- 2.601745091
AI617721 --- 2.530152336
BI864822 zgc:158271 2.516612853
BQ075086 si:rp71-1c23.2 2.482899493
CD605001 --- 2.466878713
BI865858 --- 2.438501226
BM777312 si:ch211-20b12.2 2.430396283
BI864002 zgc:92903 2.377660001
BI878750 si:dkey-53p21.1 2.185374681
AI974163 si:ch1073-126c3.2 2.185000536
AI331661 wu:fa99f01 2.180037946
AI584672 wu:fb82a05 2.174633072
AI397316 wu:fb09h07 2.167623349
AI384591 wu:fb10g08 2.122730272
AI477673 zgc:103710 2.057605963
BM277076 si:dkey-27i16.2 2.050685063
CD015330 zgc:152809 2.046307942
AW232318 wu:fj17f10 2.040389333
BM777295 Zgc:172136 2.020805737
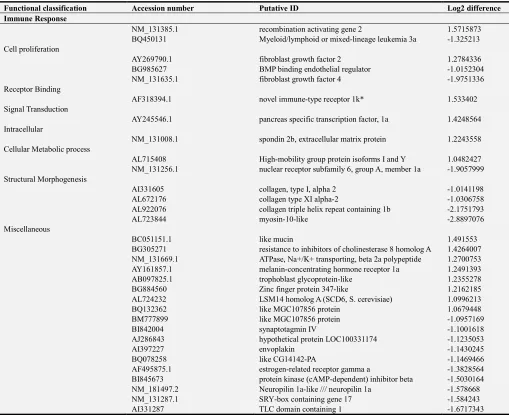
Table A2. Log2 changes in expression of zebrafish transcripts that were differentially expressed (p< 0.05) between the secondary (E1E2) and primary (SE2)
exposures less than 2.24 fold differences.
Functional classification Accession number Putative ID Log2 difference Immune Response
NM_131385.1 recombination activating gene 2 1.5715873 BQ450131 Myeloid/lymphoid or mixed-lineage leukemia 3a -1.325213 Cell proliferation
AY269790.1 fibroblast growth factor 2 1.2784336 BG985627 BMP binding endothelial regulator -1.0152304 NM_131635.1 fibroblast growth factor 4 -1.9751336 Receptor Binding
AF318394.1 novel immune-type receptor 1k* 1.533402 Signal Transduction
AY245546.1 pancreas specific transcription factor, 1a 1.4248564 Intracellular
NM_131008.1 spondin 2b, extracellular matrix protein 1.2243558 Cellular Metabolic process
AL715408 High-mobility group protein isoforms I and Y 1.0482427 NM_131256.1 nuclear receptor subfamily 6, group A, member 1a -1.9057999 Structural Morphogenesis
AI331605 collagen, type I, alpha 2 -1.0141198
AL672176 collagen type XI alpha-2 -1.0306758
AL922076 collagen triple helix repeat containing 1b -2.1751793
AL723844 myosin-10-like -2.8897076
Miscellaneous
BC051151.1 like mucin 1.491553
BG305271 resistance to inhibitors of cholinesterase 8 homolog A 1.4264007 NM_131669.1 ATPase, Na+/K+ transporting, beta 2a polypeptide 1.2700753 AY161857.1 melanin-concentrating hormone receptor 1a 1.2491393 AB097825.1 trophoblast glycoprotein-like 1.2355278 BG884560 Zinc finger protein 347-like 1.2162185 AL724232 LSM14 homolog A (SCD6, S. cerevisiae) 1.0996213
BQ132362 like MGC107856 protein 1.0679448
BM777899 like MGC107856 protein -1.0957169
BI842004 synaptotagmin IV -1.1001618
AJ286843 hypothetical protein LOC100331174 -1.1235053
AI397227 envoplakin -1.1430245
BQ078258 like CG14142-PA -1.1469466
AF495875.1 estrogen-related receptor gamma a -1.3828564 BI845673 protein kinase (cAMP-dependent) inhibitor beta -1.5030164 NM_181497.2 Neuropilin 1a-like /// neuropilin 1a -1.578668 NM_131287.1 SRY-box containing gene 17 -1.584243
Functional classification Accession number Putative ID Log2 difference Immune Response
BI983629 mCG142610-like -1.8298359
BG303134 DEAD (Asp-Glu-Ala-Asp) box polypeptide 51 -2.0876298 BQ074821 doublesex and mab-3 related transcription factor -2.3731684
Unannotated CD606487 SET domain, bifurcated 2 -2.8538423
AI793605 wu:fc49d07 2.6504161
BI710320 --- 2.3408558
BM187461 zgc:92035 2.2996033
AW281782 --- 2.2427615
BG883314 --- 2.2250069
AW018957 --- 2.2219393
AW059176 --- 2.1737237
BI883324 --- 2.1613121
BQ419619 --- 2.0832168
BI867354 si:ch211-147m20.1 1.9192022
AA497170 --- 1.8085751
BG303757 si:dkey-4c15.6 1.5619177
BI709723 zgc:165508 1.4714972
CD606304 --- 1.4665004
BI891762 zgc:158366 1.4638643
BQ092536 --- 1.4309018
BM005167 --- 1.3862775
AI544667 wu:fb77d09 1.3832316
AL731009 --- 1.3729446
BM186516 --- 1.3577334
BI864110 --- 1.3536182
AL719663 Wu:fc11a05 1.2914202
AL913138 --- 1.2142156
BI877608 zgc:152863 1.1424723
AW233702 wu:fj40e09 1.1144797
AFFX-Dr-pAsRed2 --- 1.0867881
BG728511 --- 1.0407045
CD283215 wu:fb81c07 -1.0332313
BI318519 --- -1.0924965
BI845653 --- -1.1600338
BI981210 --- -1.1832179
AW279902 si:ch73-46j18.5 -1.3152468
BI847022 --- -1.5061064
BM186526 --- -1.5448244
BM571195 si:ch211-266a5.1 -1.6606248
AI959658 wu:fd12e04 -1.6830505
BM005010 --- -1.7118405
BE605275 wu:fb15e04 -1.7141458
BG305300 --- -1.8103463
AL719266 zgc:110283 -1.8852786
AI444465 wu:fb39e08 -1.9695472
BE201957 zgc:194138 -1.9698771
BI673395 --- -1.9842097
BI982878 --- -1.9922919
BI671488 --- -2.0579275
AW280155 wu:fj51e11 -2.1208847
AL927596 --- -2.2341451
AI721504 wu:fc44h05 -2.3347106
AL722000 --- -2.4008245
AI794137 hypothetical protein LOC100332904 -2.4113868
BM154625 wu:fb12c09 -2.439278
AI878410 wu:fc57f08 -2.4814408
BM025943 Si:ch211-261c8.5 -2.5580451
BI979237 --- -2.5911717
AI667492 --- -2.6889276
AL724042 --- -2.8792889
BI882036 zgc:64003 -3.3085005
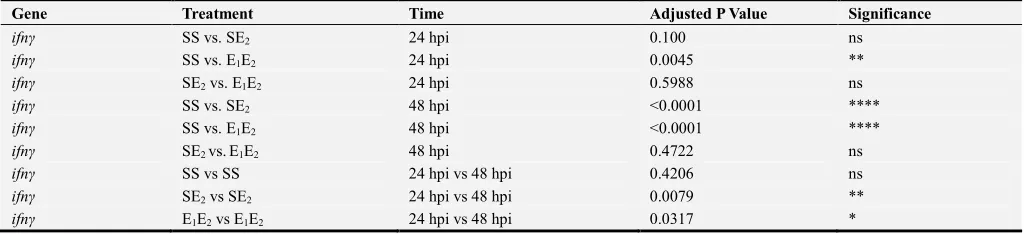
Table A3. Comparison of ifnγ gene expression between treatments at 24 hpi and 48hpi. hpi= hours post injection. *Significance (p<0.05) and ns=no significance.
Gene Treatment Time Adjusted P Value Significance
ifnγ SS vs. SE2 24 hpi 0.100 ns
ifnγ SS vs. E1E2 24 hpi 0.0045 **
ifnγ SE2 vs. E1E2 24 hpi 0.5988 ns
ifnγ SS vs. SE2 48 hpi <0.0001 ****
ifnγ SS vs. E1E2 48 hpi <0.0001 ****
ifnγ SE2 vs.E1E2 48 hpi 0.4722 ns
ifnγ SS vs SS 24 hpi vs 48 hpi 0.4206 ns
ifnγ SE2 vs SE2 24 hpi vs 48 hpi 0.0079 **
ifnγ E1E2 vs E1E2 24 hpi vs 48 hpi 0.0317 *
References
[1] Petrie-Hanson, Lora, and A. Jerald Ainsworth. "Humoral immune responses of channel catfish (Ictalurus punctatus) fry and fingerlings exposed to Edwardsiella ictaluri." Fish & Shellfish Immunology 9, no. 8 (1999): 579-589.
[2] Petrie-Hanson, Lora, and A. Jerald Ainsworth. "Ontogeny of channel catfish lymphoid organs." Veterinary Immunology and Immunopathology 81, no. 1 (2001): 113-127.
[3] Klesius, Phillip H., and Craig A. Shoemaker. "Development and use of modified live Edwardsiella ictaluri vaccine against enteric septicemia of catfish." Advances in veterinary medicine 41 (1999): 523-537.
[4] M. R. B, M., Specificity of the developing channel catfish immune response to heterotypic bacterial challenge by Mary Rebecca Bivings Mackey. 2002.
[5] Petrie-Hanson, Lora, Claudia Hohn, and Larry Hanson. "Characterization of rag1 mutant zebrafish leukocytes." BMC immunology 10, no. 1 (2009): 8.
[6] Hohn, Claudia, and Lora Petrie-Hanson. "Rag1−/− mutant zebrafish demonstrate specific protection following bacterial re-exposure." PloS one 7, no. 9 (2012): e44451.
[7] Sun, Joseph C., Joshua N. Beilke, and Lewis L. Lanier. "Adaptive immune features of natural killer cells." Nature 457, no. 7229 (2009): 557-561.
[8] O'Leary, Jacqueline G., Mahmoud Goodarzi, Danielle L. Drayton, and Ulrich H. von Andrian. "T cell–and B cell– independent adaptive immunity mediated by natural killer cells." Nature immunology 7, no. 5 (2006): 507-516.
[9] Netea, Mihai G. "Training innate immunity: the changing concept of immunological memory in innate host defence." European journal of clinical investigation 43, no. 8 (2013): 881-884.
[10] Baldwin, Thomas J., and Joseph C. Newton. "Pathogenesis of enteric septicemia of channel catfish, caused by Edwardsiella ictaluri: bacteriologic and light and electron microscopic findings." Journal of Aquatic Animal Health 5, no. 3 (1993): 189-198.
[11] Pridgeon, Julia W., Hung-Yueh Yeh, Craig A. Shoemaker, Xingjiang Mu, and Phillip H. Klesius. "Global gene expression in channel catfish after vaccination with an attenuated Edwardsiella ictaluri." Fish & shellfish immunology 32, no. 4 (2012): 524-533.
[12] Raman, T., O'Connor, T. P., Hackett, N. R., Wang, W., Harvey, B. G., Attiyeh, M. A., Dang, D. T., Teater, M. and Crystal, R. G., 2009. Quality control in microarray assessment of gene expression in human airway epithelium. BMC genomics, 10(1), p.493.
[13] Flemming, Banu Elibol. Effects of Edwardsiella Ictaluri Infection on Transcriptional Expression of Selected Immune Relevant Genes in Channel Catfish, Ictalurus Punctatus. 2006.
[14] Elibol-Flemming, Banu, Geoffrey C. Waldbieser, William R. Wolters, Carolyn R. Boyle, and Larry A. Hanson. "Expression analysis of selected immune-relevant genes in channel catfish during Edwardsiella ictaluri infection." Journal of aquatic animal health 21, no. 1 (2009): 23-35.
[15] Untergasser, Andreas, Ioana Cutcutache, Triinu Koressaar, Jian Ye, Brant C. Faircloth, Maido Remm, and Steven G. Rozen. "Primer3—new capabilities and interfaces." Nucleic acids research 40, no. 15 (2012): e115-e115.
[16] Ju, Bensheng, Yanfei Xu, Jiangyan He, Ji Liao, Tie Yan, Choy L. Hew, Toong Jin Lam, and Zhiyuan Gong. "Faithful expression of green fluorescent protein(GFP) in transgenic zebrafish embryos under control of zebrafish gene promoters." Developmental genetics 25, no. 2 (1999): 158-167.
[17] Vojtech, Lucia N., George E. Sanders, Carla Conway, Vaughn Ostland, and John D. Hansen. "Host immune response and acute disease in a zebrafish model of Francisella pathogenesis." Infection and immunity 77, no. 2 (2009): 914-925.
[18] Shah, Radhika N., Ivan Rodriguez-Nunez, Donna D. Eason, Robert N. Haire, Julien Y. Bertrand, Valērie Wittamer, David Traver, Shila K. Nordone, Gary W. Litman, and Jeffrey A. Yoder. "Development and characterization of anti-nitr9 antibodies." Advances in hematology 2012 (2012).
[19] Ebralidze, Alexander K., Florence C. Guibal, Ulrich Steidl, Pu Zhang, Sanghoon Lee, Boris Bartholdy, Meritxell Alberich Jorda et al. "PU. 1 expression is modulated by the balance of functional sense and antisense RNAs regulated by a shared cis-regulatory element." Genes & development 22, no. 15 (2008): 2085-2092.