http://www.sciencepublishinggroup.com/j/ajaf doi: 10.11648/j.ajaf.20180605.12
ISSN: 2330-8583 (Print); ISSN: 2330-8591 (Online)
Genotypic Variation for Root Development, Water
Extraction and Yield Components in Groundnut Under Low
Phosphorus and Drought Stresses
Hamidou Falalou
1, 2, *, Heynikoye Mariama
2, Falke Bacharou Achirou
1, Halilou Oumarou
2,
Vadez Vincent
31
Crop Physiology Laboratory, International Crops Research Institute for the Semi-Arid Tropics, Niamey, Niger 2
Department of Biology, Faculty of Sciences and Techniques, Abdou Moumouni University, Niamey, Niger 3Crop Physiology Laboratory, International Crops Research Institute for the Semi-Arid Tropics, Patancheru, India
Email address:
*
Corresponding author
To cite this article:
Hamidou Falalou, Heynikoye Mariama, Falke Bacharou Achirou, Halilou Oumarou, Vadez Vincent. Genotypic Variation for Root Development, Water Extraction and Yield Components in Groundnut Under Low Phosphorus and Drought Stresses. American Journal of Agriculture and Forestry. Vol. 6, No. 5, 2018, pp. 122-131. doi: 10.11648/j.ajaf.20180605.12
Received: August 7, 2018; Accepted: August 21, 2018; Published: September 11, 2018
Abstract:
[Context] Unpredictable water deficit (drought) and low soil phosphorus (LP) are major interacting constraints to groundnut growth and grain yield in Sahelian zones of West Africa. Combining breeding efforts for drought tolerance and P efficiency could lead to improve tolerance and grains yield in these zones. [Objectives] This study assessed six groundnut genotypes under lysimetric system to better understand the relative importance of P deficiency, water stress, and their inter-action; investigate the water extraction pattern of genotypes under these constraints and identify tolerance related traits to accelerate development of more resilient varieties. [Methods] Thus, in experiment 1 (Exp.1) roots traits were investigated at 50% flowering, pod filling stage (60 days after sowing) and maturity stage (90 days after sowing) under high phosphorus (HP) and LP treatments. In experiment 2 (Exp.2), two water regimes (WW=well water, and WS = water stress) were imposed to HP and LP plants and parameters like total transpired water (TTW), transpiration efficiency (TE), water extraction (Wex), pods and haulm weights were investigated. [Results] Roots traits showed significant decrease due to LP stress, pod and haulm weights correlated significantly to roots length density (RLD) and roots dry matter (RDM). Genotypes 12CS-116 and ICGV 12991 revealed tolerant to LP stress while RLD and RDM revealed LP tolerance related traits in groundnut. Interacting effect of LP and drought stress (LPWS) was higher than separate effect of LP and WS. Under LPWS, Wex, TTW, TE, pod and haulm yields decreased significantly. This study suggests that RLD and RDM contributed to Wex in 12CS-116 and ICG 12991 under LPWS. 55-437 and JL-24 with highest TTW showed drought tolerance strategy while drought avoidance strategy could explain 12CS-116, 12CS-79, ICG 12991 and ICGV 97183 response to WS. Pod weight showed tight correlation (R2 =0.7) to TE only under LPWS suggesting that TE explains a large part of pod yield variation under LPWS conditions. TE revealed WS and LPWS tolerance related trait. The genotypic variation observed on Wex and TTW under LPWS suggests different patterns of water extraction and use among the groundnut genotypes.Keywords:
Water Extraction, Roots Traits, Drought, Low Phosphorus, Stress, Groundnut, Yield1. Introduction
In Sahelian zones of the semi-arid tropics, groundnut (Arachis hypogaea L.) is widely cultivated in rainfed areas.
When drought is combined with heat stress, the pods yield decrease reached up to 72% [3]. Drought stress significantly reduced total dry matter (41%), transpiration (33%) and chlorophyll content (40%) across genotypes but significantly increased transpiration efficiency (20.5%) and Chlorophyll density (22%) in peanut [4]. These authors observed significant genotypic variation for transpiration efficiency and chlorophyll parameters. Mid-season and terminal drought are major constraints of peanut production as they reduced pod yield, can increase the incidence of aflatoxin contamination while an early-season drought stress is not detrimental to peanut yield and it sometimes actually increases yield of peanut [5, 6, 7]. Drought at pod filling reduces growth, yield and seed quality of peanut (Arachis hypogaea L.) and great root system can reduce yield loss under water stress [8]. [9] reported that rooting depth and root branch density are important root architectural traits that directly influence the acquisition of water and nutrients in the soil strata. Drought stress reduced also the uptakes of N, P, K and Ca in peanut [10]. Useful traits, including rooting system and water uptake, to improve groundnut adaptation and productivity under drought are still needed.
The rainfed areas of Sahel are also characterized by low soil fertility which is additional major constraint of groundnut productivity. Among soil fertility factors and on the mostly acid sandy Sahelian soils, phosphorus (P) is the most limiting nutrient for crop production [11]. [12] reported that the acid Sahelian soils are low concentrated in plant available phosphorus (Bray-P typically 2 – 4 mg kg-1) which affects growth and yield parameters. An early season deficiency of phosphorus leads to early irreversible restriction in crop development that can drastically reduce crop populations [13]. Phosphorus (P) deficiency is the most frequent nutrient stress for growth and development of grain legumes [14]. Although legumes can fix their own N, they often need other nutrients particularly phosphorus for good seed formation [15]. The requirement of P in nodulating legumes is higher compared to non-nodulating crops as it plays a significant role in nodule formation and fixation of atmospheric nitrogen. Other authors reported negative effects of P deficiency on the capacity to fix N, roots and leaves growth in legumes [16]. In Common bean, P deficient plants showed 50% lower net photosynthesis at ambient CO2 concentration reflecting lower carboxylation efficiency [17]. In soybean (Glycine max), it was shown that P nutrient improved root traits to enhance tolerance of water deficit during reproductive growth, with less yield reduction at high applied P [18]. In groundnut, it was observed that under LP conditions, tolerant genotypes exhibited increased performance in various root traits and accumulated more root and shoot biomass and P [19, 20]. It was reported also that phosphorus deficiency reduced flower production, size of pods and adversely affect the formation of root nodules in groundnut [21]. [22] investigated the genotypic variation for roots traits in groundnut germplasm under phosphorus stress conditions and observed that ICGV 86590, ICVG 14475 and
ICVG 92188 were found tolerant by producing more lateral roots, root volume and root weight.
In the West African Sahel, unpredictable rainfall deficit and low soil phosphorus (P) are major interacting constraints to crops growth and grain yield. Several research works were conducted on drought tolerance in groundnut [2, 3, 23-29]. Previous works have shown that phosphorus nutrient is an important factor improving the tolerance ability to water stress [30, 31]. Peanut genotypes that have higher root length density in deeper soil layers have enhanced drought tolerance, which can result in a higher pod yield and harvest index under pre-flowering drought conditions [32]. In common bean, [33] reported that shallow-rooted genotypes grow relatively better under P stress, deep-rooted genotypes grow better under water stress, while genotypes with a dimorphic root system permitting vigorous rooting throughout the soil profile grow best in the combined stress treatment. However, even known that in West African Sahel, drought affects groundnut cultivated on low P soil, as far as we know, research has not been done on the interaction between low P and water stress particularly on roots and canopy response, water and phosphorus use. Improvement of peanut to extract water from the whole soil profile might increases drought tolerance [34]. To do so, investigation on the genotypic variation in the pattern of water extraction in soil profile is required. We hypothesize that in groundnut, combining breeding efforts for drought tolerance and P efficiency could lead to improve tolerance and grains yield in Sahelian zones. Therefore, this work aims to (i) better understand the relative importance of P deficiency, water stress, and their interaction, (ii) identify measured traits related to better performance of genotypes under these constraints to accelerate development of more resilient varieties to drought and low phosphorus stress, and (iii) investigate water extraction pattern of genotypes under low P and drought stress.
2. Material and Methods
from a temperature and relative humidity recorder (Gemini Tinytag Ultra 2 TGU-4500 Data logger Ltd, Chichester, UK) located in the crop canopy.
2.1. Experimental Conditions
The lysimetric system was well described in our previous works [35, 28]. All lysimetre tubes (PVC cylinders) were placed upright in 1 m deep trench, over which the weighing mechanism could be moved to select individual cylinders for weighing. The tops of the cylinders were equipped with metal collars and chains to allow the lysimetre tubes to be lifted and weighed. The lysimeter tubes weighting procedure involved a crane balance (S-type load cell with a 200 kg load capacity; Mettler-Toledo, Geneva, Switzerland) connected to a block chained pulley to lift the tubes. The soil used to fill the lysimetre tubes was collected from the farm of ICRISAT Sadoré station. Top soil (0-20cm) and deep soil (20-100cm) from the farm were collected separately. To mimic the field conditions, the lysimetre tubes (25 cm diameter, 130cm height) were filled with deep soil (100 cm height) followed by top soil (20 cm height). The upper 10 cm of the tubes was left empty to allow the application of a layer of anti-evaporation beads and for watering.
2.1.1. Experiment 1 (Exp.1)
Three seeds were sown by hand; seedlings were thinned to one plant per tube at 14 days after sowing (DAS). The experimental design was a 3×2 α-lattice design with 5 replications in each P treatment. LP and HP treatments were at either side of the trench in which all the tubes were placed in order to avoid HP plants shading the LP plants. The soil was kept at 90% of field capacity until harvest. The 6 genotypes randomized within each of the five replications. To investigate roots traits under low varying P conditions, 5 plants of each variety and per phosphorus treatment were uprooted at 50% flowering time, 60 days after sowing (pod filling stage) and at maturity date for extracting roots as described by [36]. During the
experiment (end June to mid-September), mean
temperatures (Min and Max) were 24 and 33°C respectively while the Min and Max mean relative humidity were respectively 53.5 and 98.5%.
2.1.2. Experiment 2 (Exp. 2)
The experimental conditions (soil, seeds sowing, design, genotypes, etc.) were the same as in experiment 1 except that (i) two plants were left per tube after thinning and (ii) in addition to P treatments, 2 water treatments (WW or full irrigation until harvest and WS or drought stress imposed from flowering to maturity times) were applied. This aimed to investigate the separate and combined effects of low P and WS on the 6 genotypes. The Min and Max mean temperatures were 24.7 and 33°C, and the Min and Max mean relative humidity were 24 and 90% during the cropping period (end August to November).
2.2. Phosphorus and Water Treatments
Two phosphorus treatments (HP and LP) were imposed in Exp.1 and Exp.2. The HP treatment consisted of applying 7.5 g DAP tube−1 (equivalent to 100 kg ha-1) in a circle 2–3 cm around the seedling area after emergence. The LP lysimetre tubes (LP treatment) did not receive any P application but were supplied with urea (3.45 g applied in two doses) to compensate for DAP nitrogen input into HP tubes. DAP (18% N, 46% P2O5 and 0% K2O) and urea (46% N, 0% P2O5, % K2O) were used in these experiments because they are the common fertilizers used by Sahelian farmers. Water treatment WW was a full irrigation (90% of field capacity) until harvest for both Exp.1 and Exp.2. WS treatment imposed in Exp.2 was an intermittent drought consisting of cycles of drying (irrigation interruption) and re-watering (1000mL of water per tube) when the majority of WS plants showed clear wilting symptoms [2]. Given the diameter of the lysimetre tubes, this was equivalent to 16mm of water when extrapolated to a field conditions. Prior to impose WS, the lysimetre tubes were water saturated, drained during 2 days to reach field capacity and the soil surface was covered with a 2cm thick layer of polyethylene beads to minimize soil evaporation [37].
2.3. Measurements
Phenology (flowering and maturity times), yield and its components were measured in both Exp.1 and Exp.2. The leaf area and roots traits (volume, length, length density, dry matter) were specially investigated in Exp.1 while water extraction and transpiration efficiency (TE) were measured only in Exp.2.
2.3.1. Roots Traits Measurement: Volume, Length Density and Dry Matter
To explore roots traits and assess genotypic variation among the 6 varieties under HP and LP treatments, for each genotype, roots of 5 plants of each P treatment were extracted at 50% flowering time (21 – 24 DAS), 60 DAS and at maturity date (84 - 90 DAS). Before extracting the roots, shoot and pods were harvested and separated. The roots extraction consisted of gently washing the soil from both ends of the cylinders after removing the end cap. Total root depth was measured by stretching the entire root system. Then, the root system was divided into 15cm portions which were digitized with a scanner and analyzed using WinRhizo software (Regent Instruments INC, Quebec, Canada) to determine the roots volume (RV), roots length (RL) and roots length density (RLD). After RV, RL and RLD measurement, samples were bagged, dried and weighed for roots dry matter determination (RDM). Pod and haulm yield were determined after harvest.
2.3.2. Transpiration Measurement, Water extraction (Wex) and Transpiration Efficiency (TE) Determination
initial biomass (IDM) was determined. During water stress period, transpiration was measured via a gravimetric procedure by weighing cylinders regularly (twice per week). As there was no evaporation nor draining, the difference of consecutive lysimetre weights, plus water added after the previous weighing, was equivalent to the transpiration [38]. The total transpired water (TTW) of WW and WS plants was determined as cumulative transpiration from water stress imposition (25 DAS) to 85 DAS. At maturity, plant of each cylinder was harvested, dried at 70oC for 2 days for determining the final dry matter (FDM). The transpiration efficiency (TE) was calculated as: TE = (FDM - mean IDM) /TTW. Initial tubes weight (beginning of weighing) and final tubes weight (end of experiment) were used to determine the water extracted of HP and LP plants under WW and WS conditions. Water extraction (Wex) was then calculated as: Wex = initial tube weight - final tube weight. Pod and haulm yield were determined after harvest.
3. Statistical Analyses
GENSTAT 14th edition (VSN International Ltd, Hemel Hempstead, UK) was used to perform statistical analyses. A one-way and two-way analysis of variance (ANOVA) were performed to assess the effect of genotype (G), phosphorus treatment (Trt), water regime (RH) and the GxTrt, GxRH and/or GxTrtxRH interactions for the different traits measured. Microsoft office Excel 2016 Software (Microsoft Corp., Redmond, WA, USA) was used for linear regression by plotting different traits to determine the R2 and regression equation. A t-test was performed, differences between the mean values of treatments were evaluated at P = 0.05
4. Results
4.1. Low Phosphorus Stress Effect on Agromorphological Traits Under Lysimetre Conditions
Roots traits investigated in Exp.1 revealed any significant LP effect or genotypic variation on roots diameter. However, a significant genotypic variation was observed at 60 DAS for roots volume (RV) and indicated that ICGV 97183 and ICG 12991 showed the highest RV. LP stress also decreased significantly the roots length (RL) (Table 1) and roots length density (RLD) (Table 2). At flowering, pod filling and maturity times, the roots length decrease was 18, 20 and 24% respectively while RLD decreased respectively up to 17, 21 and 25%. Under LP conditions, ICG 12991 revealed the highest RLD at 60DAS. Significant genotypic variation was observed at flowering, pod filling and maturity times for root dry matter (RDM) and revealed the highest values on 12CS-116 and ICG 12991 (Table 3). Phosphorus treatment effect on RDM was significant only at maturity time and showed 27% decrease due to LP. At harvest, ANOVA revealed that LP stress decreased significantly haulm weight (33%) and pods weight (27%). 12CS-116 and 12CS-79 showed higher pods weight than ICGV 97183, ICG 12991, 55-437 and JL-24 under LP stress. The highest haulm weight was observed on 79, 55-437, 12CS-116 and ICG 12991. As LP decreased the RL, RLD, RDM, pod and haulm weight, linear regressions were performed to determine any relationship between productivity and roots traits. Thus, at flowering time, pod filling stage and maturity date, the regression between decrease in pod and haulm weights and decrease, in RL, RLD and RDM showed significant relationship between RLD and pod, and haulm weight only at pod filling (60 DAS) stage (Figure 1).
Table 1. Roots length (cm) under high (HP) and low phosphorus (LP) treatments at flowering, pod filling (60 DAS) and maturity times in 6 groundnut genotypes. DAS = days after sowing, G = genotype, Trt = phosphorus treatment.
Flowering (50%) 60DAS Maturity
HP LP HP LP HP LP
55-437 2478a 2204a 12560a 8966b 12468a 9147a
ICGV 97183 2244a 1727a 14217a 12204ab 10882a 10749a
JL-24 2282a 2218a 13645a 11193ab 12780a 8051a
12CS-116 3310a 2892a 14333a 8054b 17493a 12766a
12CS-79 2993a 2069a 12589a 12282ab 13700a 10968a
ICG 12991 2950a 2292a 16917a 14419a 16956a 11878a
Mean 2710 2234 14044 11186 14047 10593
G (F prob) 0.314ns 0.388ns 0.816ns 0.04* 0.497ns 0.353ns
Trt (F prob) 0.041* 0.029* 0.020*
GxTrt (F prob) 0.943ns 0.836ns 0.915ns
* = significant at 5% level. ns = no significant at 5% level. Means with the same letter are not significantly different within the same treatment
Table 2. Roots length density (RLD) under high (HP) and low phosphorus (LP) treatments at flowering, pod filling (60 DAS) and maturity times in 6 groundnut genotypes. DAS = days after sowing, G = genotype, Trt = phosphorus treatment.
Flowering (50%) 60DAS Maturity
HP LP HP LP HP LP
55-437 0.049a 0.044a 0.25a 0.17b 0.25a 0.18a
ICGV 97183 0.045a 0.034a 0.28a 0.24ab 0.21a 0.21a
JL-24 0.046a 0.044a 0.27a 0.22ab 0.25a 0.16a
12CS-116 0.066a 0.058a 0.28a 0.26b 0.35a 0.25a
Flowering (50%) 60DAS Maturity
HP LP HP LP HP LP
ICG 12991 0.059a 0.045a 0.33a 0.28a 0.34a 0.23a
Mean 0.054 0.045 0.28 0.22 0.28 0.21
G (F prob) 0.324ns 0.454ns 0.716ns 0.03* 0.487ns 0.233ns
Trt (F prob) 0.041* 0.016* 0.011*
GxTrt (Fprob) 0.909ns 0.799ns 0.772ns
* = significant at 5% level. ns = no significant at 5% level. Means with the same letter are not significantly different within the same treatment
Table 3. Roots dried matter (RDM) under high (HP) and low phosphorus (LP) treatments at flowering, pod filling and maturity times in 6 groundnut genotypes. DAS = days after sowing, G = genotype, Trt = phosphorus treatment.
Flowering (50%) 60DAS Maturity
HP LP HP LP HP LP
55-437 0.34ab 0.43a 4.22ab 3.5b 4.92b 3.06a
ICGV 97183 0.33b 0.31a 3.49b 3.89ab 4.17b 4.07a
JL-24 0.34b 0.40a 3.19b 3.54b 4.24b 3.39a
12CS-116 0.54a 0.50a 4.82ab 4.63ab 7.20a 4.75a
12CS-79 0.44ab 0.39a 4.13ab 3.94ab 5.55ab 3.71a
ICG 12991 0.46ab 0.41a 6.01a 5.72a 6.56ab 4.90a
Mean 0.4 0.4 4.31 4.21 5.44 3.98
G (F prob) 0.034* 0.025* 0.044 *
Trt (F prob) 0.594 0.767 0.004*
GxTrt (Fprob) 0.943 0.454 0.742
* = significant at 5% level. ns = no significant at 5% level. Means with the same letter are not significantly different within the same treatment
Figure 1. Relationship between decrease (%) in pod and haulm weights, and in root length density (RLD) due to LP at pod filling stage.
4.2. Genotypic Variation in Response to Combined Low Phosphorus and Water Stress (LPWS) Under Lysimetre Conditions
4.2.1. Water Extraction
Water extraction (Wex) measurement during Exp. 2 showed that LP plants extracted less water (4.4 kg plant -1) than HP plants (5.2 kg plant-1). Wex decrease was 6% due to LP and 46% due to WS. Under LPWW conditions, 12CS-116 and ICG 12991 showed high Wex. When LP stress was combined to WS, significant (P = 0.001) genotype (G), P treatment (Trt) and water regime (Wr) interaction (GxTrtxWr) was observed. Thus, under HP treatment, 12CS-79, 55-437 and ICG 12991 showed the highest Wex while under LP treatment the highest Wex was observed on 12CS-116, 12CS-79 and ICG 12991. LPWS plants extracted 51% less water than HPWW plants. Under LPWS 12CS-79, 12CS-116 and ICG 12991 extracted more water than 55-437, ICGV 97183 and JL-24. The TTW (sum of transpiration during WS period) data showed significant decrease under WS (67%) and LP (8%) conditions. The significant (P = 0.004) genotype and water treatment interaction (GxTrt)
observed indicated that under WW conditions, 12CS-79, 12CS-116, 55-437 and ICG 12991 transpired much water than ICGV 97183 and JL-24 whereas under WS conditions, 55-437 and JL-24 showed the highest TTW. Under both HP and LP treatments, 12CS-116, 12CS-79, 55-437 and ICG 12991 revealed higher transpired water than JL-24 and ICGV 97183. When LP plants were subjected to WS (LPWS), TTW decrease was up to 69%, the highest TTW was observed on 55-437 and JL-24.
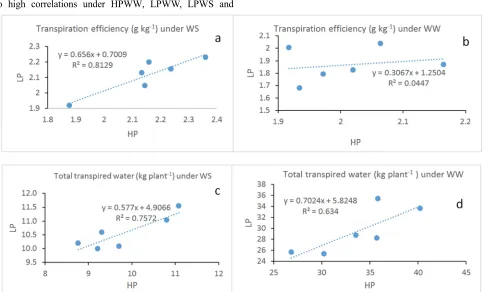
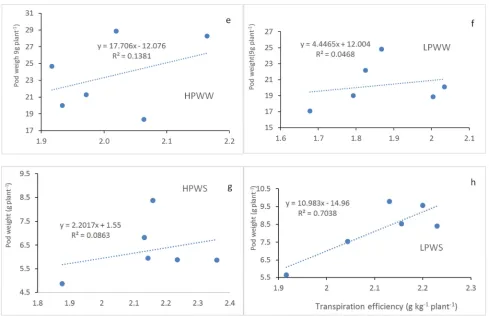
4.2.2. Transpiration Efficiency
f, g, h). The regression between TTW and pod weight revealed also high correlations under HPWW, LPWW, LPWS and
HPWS treatments (Figure 3a, b, c, d).
Figure 3. Total transpired water (a, b,c, d) and transpiration efficiency (e, f, g, h) relationship to pod weight under HP, LP and well watered (WW), water stressed (WS) conditions.
5. Discussions
5.1. Genotypic Performance Under Low Phosphorus Stress
Selection of varieties with desirable root morphological traits can be an effective way to expand their ability to acquire water and nutrients. It was reported that the ability of crops to absorb nutrients and water is closely associated with root morphological traits [39, 40]. In Exp.1, investigations on roots traits at 50% flowering, pod filling (60 DAS) and maturity (90 DAS) stages under LP conditions showed that LP stress decreased significantly the RL, RLD and RDM. However, a genotypic variation was observed which indicated that genotypes 12CS-116 and ICG 12991 revealed the highest RLD and RDM under LP conditions. In addition, correlation between productivity (pod and haulm) and roots traits under LP conditions showed that at pod filling stage (60 DAS), high pod and haulm weights were associated with high RLD. These findings showed that RLD and RDM contributed to the performance of 12CS-116 and ICGV 12991 under LP conditions. [20] Shen et al. (2001) found that under LP conditions, tolerant groundnut genotypes can extract phosphorus thanks to phosphorus solubilizing active substances from the root cell wall. This study findings suggest that 12CS-116 and ICGV 12991 revealed tolerant to LP stress and, RLD and RDM revealed LP tolerance related traits in groundnut.
5.2. Low Phosphorus and Drought Stresses Interaction: Genotypic Performance for Water Extraction and Use
contribution to Wex [41]. Indeed, authors [42, 43] demonstrated that drought tolerant genotypes had higher water extraction than sensitive genotypes under drought conditions. Water extraction under drought stress contributes to dehydration avoidance strategy although high water extraction ability leads to quick soil water depletion when the drought stress endured [44]. It was found that total water extracted from the soil profile did not relate directly to the pod yield [45]. In this study, transpiration was measured to investigate canopy contribution in LP and WS response. It was observed that TTW decreased up to 8% under LP, 67% under WS and 69% under LPWS conditions. Reduction of leaf area observed in LP plants (data not shown) could explain their TTW decrease. In chickpea, [21] found a positive correlation between leaf P concentration and transpiration rate of the young fully expanded leaves. Low transpiration under WS revealed stomatal closure to conserve water while high transpiration led to quick depletion of water in the reservoir [46]. Under LPWS, high TTW observed on 55-437 and JL-24 compared to 12CS-116, ICG 12991, ICGV 97183 and 12CS-79 suggests that 55-437 and JL-24 used drought tolerance strategy while the other genotypes used drought avoidance strategy. The significant and high correlation observed between TTW and pod weight in this study indicates that high TTW was an attribute of pod yield under both P and water treatments. This study findings support this idea as 55-437 and JL-24 with highest TTW showed high pod weight under LPWS conditions. Investigations on TE revealed a significant increase under WS, a decrease under LP stress while the combined effect of WS and LP stresses led to TE decrease. In peanut, [4] observed increased TE as well as increasing chlorophyll density due to ticker leaves under drought stress. The contrary effect of WS and LP stress on TE when they were imposed separately indicates that factors driving TE could be different. Authors reported that reducing stomatal conductance would lead to TE increase [47]. A TTW decrease was observed in this study, consequently, a stomatal conductance decrease to reduce transpiration under WS could explain the TE increase. [45] demonstrated also that TE difference among genotypes could have been driven mostly by the stomatal conductance regulation under high VPD. As for TE decrease under LP stress, photosynthetic activity could be the predominant factor influencing TE. Indeed, authors reported that phosphorus deficiency affecting the concentration of photosynthetic pigments or the leaves thickness could have reduced photosynthetic activities resulting in TE decrease [21, 45]. The TE decrease resulted from LPWS suggest that negative effect on photosynthetic activities predominated when LP and WS interacted. The findings of this study showed also that TE correlated tightly (R2 =0.7) to pod weight only under LPWS suggesting that TE explains a large part of pod yield variation under water and P stress conditions. Thus, LPWS tolerant genotype should show high TE.
6. Conclusion
Drought and low P stress affected growth and yield components in groundnut. This study showed that RLD and RDM were associated to high pod and haulm yield under LP and revealed tolerance related traits. Although LP stress led to less water extraction, the highest yielding genotypes extracted more water and showed the highest RLD and RDM 60 DAS. The decrease of Wex, TTW, pod and haulm yields was high when LP and WS (LPWS) were combined indicating that their negative effects increased when they interacted. TE increased under WS while it decreased under LP and LPWS conditions. These findings suggest different factors driving TE in groundnut response to LP and drought stress. The high correlation of TE and pod yield under LPWS suggests that TE was associated to LP and drought tolerance. Under LPWS conditions, different pattern of water extraction and use was observed among investigated genotypes. 12CS-116, 12CS-79 and ICGV 12991 revealed water savers or dehydration avoidant as they extracted much water and transpired less while 55-437 and JL 24 which showed high transpiration revealed wasteful water or drought tolerant.
Acknowledgements
The work was supported by CRP Grains Legumes. Authors are grateful Dr Zaman-Allah Mainassara Abdou (Senior Scientist, Crop physiologist, CIMMYT, Zimbabwe) for his comments and inputs on the first draft of this manuscript.
References
[1] Reddy, T. Y., Reddy, V. R., Anbumozhi, V., 2003. Physiological responses of groundnut (Arachis hypogea L.) to drought stress and its amelioration: a critical review. Plant Growth Regulation41, 75–88.
[2] Hamidou, F., Ratnakumar, P., Halilou, O., Mponda, O., Kapewa, T., Monyo, E., Faye, I., Ntare, B., Nigam, S. N., Upadhyaya, H. D., Vadez, V., 2012. Selection of intermittent drought stress tolerant lines across years and locations in the reference collection of groundnut (Arachis hypogaea L.). Field Crop Res. 126, 189-199.
[3] Hamidou, F., Halilou, O., Vadez, V., 2013. Assessment of Groundnut under Combined Heat and Drought Stress. J. Agro. Crop Sci. 199, 1-11.
[4] Arunyanark, A., Jogloy, S., Akkasaeng, C., Vorasoot, N., Kesmala, T., Nageswara, Rao R. C., Wright, G. C., Patanothai, A., 2008. Chlorophyll Stability is an Indicator of Drought Tolerance in Peanut. J. Agronomy & Crop Science 194, 113-125.
[6] Jongrungklang, N., Toomsan, B., Vorasoot, N., Jogloy, S., Boote, K. J, Hoogenboom, G., Patanothai, A., 2013. Drought tolerance mechanisms for yield responses to pre-flowering drought stress of peanut genotypes with different drought tolerant levels. Field Crop Res. 144, 34–42.
[7] Hamidou, F., Rathore, A., Waliyar, F., Vadez, V., 2014. Although drought intensity increases aflatoxin contamination, drought tolerance does not lead to less aflatoxin contamination. Field Crop Res. 156, 103-110.
[8] Junya, J., Teerayoot, G., Sanun, J., Vorasoot, N., Patanothai, A., 2014. Response of root characteristics and yield in peanut under terminal drought Condition. Chilean J. Agri. Res. 74, 249-256.
[9] Yinglong, C., Michel, E. G., Siddique, H. M K., 2017. Characterising root trait variability in chickpea (Cicer arietinum L.) germplasm. Journal of Experimental Botany, 68, 1987–1999.
[10] Junjittakarn, J., Pimratch, S., Jogloy, S., Htoon, W., Singkham, N., Vorasoot, N., Toomsan, B., Holbrook, C. C., Patanothai, A., 2013. Nutrient uptake of peanut genotypes under different water regimes. International Journal of Plant Production 7, 677-692.
[11] Nziguheba G., Zingore S., Kihara J., Merckx R., Njoroge S., Otinga A., Vandamme E., Vanlauwe B., 2016. Phosphorus in smallholder farming systems of sub-Saharan Africa: implications for agricultural intensification. Nutr Cycl Agroecosyst 104, 321–340.
[12] Muehlig-Versen, B., Buekert, A., Bationo, A., Roemheld, V., 2003. Phosphorus placement on acid arenosols of the west Africam Sahel. Expl Agric. 39, 307–325.
[13] Valluru, R., Vadez, V., Hash, C. T., Karanam, P., 2010. A minute P application contributes to a better establishment of pearl millet (Pennisetum glaucum (L.) R. Br.) seedling in P deficient soils. Soil use and Management 26, 36–43.
[14] Kamara, A. Y., Kwari, J. D., Ekeleme, F., Omoigui, L., Abaidoo, R., 2008. Effect of phosphorus application and soybean cultivar on grain and dry matter yield of subsequent maize in the tropical savanna of north-eastern Nigeria. African J. Biotech. 7, 2593–2599.
[15] Rezaul, K., Sabina, Y., Mominul, I. A., Abdur, Rahman K. M., Sarkar M. D., 2013. Effect of Phosphorus, Calcium and Boron on the Growth and Yield of Groundnut (Arachis hypogea L.). Int. J. Bio-Sci. Bio-Tech. 3, 51-60.
[16] Kraimat, M., Bissati, S., 2017. Characterization of genotypic variability associated to the phosphorus bioavailability in peanut (Arachis hypogaea L.). Ann. Agric. Sci. https://dx.doi.org/10.1016/j.aoas.2017.01.004.
[17] Georgina, H., Mario, R., Oswaldo, V., Mesfin, T, Graham, M. A., Tomasz, C., Armin, S., Wandrey, M., Alexander, E., Foo, C., Hank, C. W., Miguel, L., Christopher, D. T., Joachim, K., Michael, K. U., Carroll, P. V., 2007. Phosphorus Stress in Common Bean: Root Transcript and Metabolic Responses. Plant Physiology, 144, 752–767.
[18] Jin, J., Wang, G., Xiaobing, L., 2012. Phosphorus Nutrition Affects Root Morphology Response to Water Deficit at Different Reproductive Stages in an Early Soybean Cultivar. In Proceedings of the 4th International Crop Science Congress (Brisbane), Australia, 26 September - 1 October, 1-5.
[19] Kumar, A., Kusuma, P., Gowda, M. V. C., 2009. Genotypic variation for root traits in groundnut germplasm under phosphorus stress conditions. J. SAT Agri. Res. 7.
[20] Shen, RF., Ae, N., 2001. Extraction of P solubilizing active substances from the cell wall of groundnut roots. Plant Soil 228, 243-252.
[21] Hemalatha, S., Praveen, R. V., Padmaja, J., Suresh, K., 2013. An overview on role of phosphorus and water deficits on growth, yield and quality of groundnut (Arachis hypogaea L.). Int. J. Appl. Biol. and Pharma. Techn. 3, 188-201.
[22] Amrit, K., Kusuma, P., Gowda, M. V. C., 2009. Genotypic variation for roots traits in groundnut germplasm under phosphorus stress conditions. Journal of SAT Agriculture Research 7.
[23] Pimratch S., Jogloy S., Vorasoot N., Toomsan B., Patanothai A., Holbrook C. C., 2008. Relationship between Biomass Production and Nitrogen Fixation under Drought-Stress Conditions in Peanut Genotypes with Different Levels of Drought Resistance. J. Agro. And Crop Sci. 194, 15- 25.
[24] Nigam S. N. and Aruna R., 2008. Stability of soil plant analytical development (SPAD) chlorophyll meter reading (SCMR) and specific leaf area (SLA) and their association across varying soil moisture stress conditions in groundnut (Arachis hypogaea L.). Euphytica 160, 111–117.
[25] Hamidou F., Harou A., Falke B. A., Halilou o., Bakasso Y., 2018. Fixation de iazote chez iarachide et le niébé en conditions de sècheresse pour lamélioration de la productivité au Sahel. Tropicultura, 36, 63-79.
[26] Clavel, D., Diouf, O., Khalfaoui, J. L., Braconnier, S., 2006. Genotypes variations in fluorescence parameters among closely related groundnut (Arachis hypogaea L.) lines and their potential for drought screening programs. Field Crop Res. 96, 296-306.
[27] Ratnakumar, P., Vadez, V., 2011. Groundnut (Arachis hypogaea L.) genotypes tolerant to intermittent drought maintain a high harvest index and have small leaf canopy under stress. Funct. Plant Biol. 38, 1016–1023.
[28] Halilou, O., Hamidou, F., Katzelma, T. B., Mahamane, S., Vadez V., 2015. Water use, transpiration efficiency and yield in cowpea (Vigna unguiculata (L.) Walp) and peanut (Arachis hypogaea L.) across water regimes. Crop & Pasture Sci. 7, 715–728.
[29] Hamidou, F., Awel, M. S., Bissala, Y. H., Achirou, B F., Upadhyaya, H. D., 2017. Abiotic Stresses Tolerance and Nutrients Contents in Groundnut, Pearl Millet and Sorghum Mini Core germplasm for Food and Nutrition Security. Indian J. Plant Genet. Resour. 30,201-209.
[30] Jin, J., Wang, G., Xiaobing, L., 2012. Phosphorus Nutrition Affects Root Morphology Response to Water Deficit at Different Reproductive Stages in an Early Soybean Cultivar. In Proceedings of the 4th International Crop Science Congress (Brisbane), Australia, 26 September - 1 October, 1-5.
[31] Pang, J., Megan, H. R., Hans, L., Siddique, K. H. M., 2018b. Phosphorus acquisition and utilization in crop legumes under global change. Curr. Opin. Plant Biol. 45, 1–7. doi.org/10.1016/j.pbi.2018.05.012.
[33] Ho, M. D., Rosas, J. C., Brown, K. M., Lynch, J. P., 2005. Root architectural tradeoffs for water and phosphorus acquisition. Funct. Plant Biol 32:737-748.
[34] Songsri, P., Jogloy, S., Kesmala, T., Vorasoot, N., Akkasaeng, C., Patanothai, A., Holbrook, C. C., 2008. Heritability of drought resistance traits and correlation of drought resistance and agronomic traits in peanut. Crop Sci. 48, 245–253.
[35] Beggi, F., Hamidou, F., Buerkert, A., Vadez, V., 2014. Tolerant pearl millet (Pennisetum glaucum (L.) R. Br.) varieties to low soil P have higher transpiration efficiency and lower flowering delay than sensitive ones. Plant soil 389, 89-108.
[36] Vadez, V., Kholová, J., Yadav, R. S., Hash, C. T., 2013. Small temporal differences in water uptake among varieties of pearl millet (Pennisetum glaucum (L.) R. Br.) are critical for grain yield under terminal drought. Plant soil, 371:447–462.
[37] Ratnakumar, P., Vadez, V., Nigam, S. N., Krishnamurthy, L., 2009. Assessment of transpiration efficiency in peanut (Arachis hypogaea L.) under drought by lysimetric system. Plant Biol. 11, 124–130.
[38] Vadez, V., Deshpande, S. P., Kholova, J., Hamme, r G. L., Borrell, A. K., Talwar, H. S., Hash, C. T., 2011a. Stay-green quantitative trait loci’s effects on water extraction: transpiration efficiency and seed yield depend on recipient parent background. Funct. Plant Biol. 38, 553–566.
[39] Yanbin, H., Guiyuan, Z., Shaoxiong, L., Haiyan, L., Xiaoping, C., Shijie, W., Xuanqiang, L., 2012. The relationship between root traits and aboveground traits in peanut (Arachis hypogaea
L.). African J. Agri Res. 46, 6186-6190.
[40] Pang, J., Zhao, H., Bansal, R., 2018a. Leaf transpiration plays a role in phosphorus acquisition among a large set of chickpea genotypes. Plant Cell Environ. 2018; 1–11. https://doi.org/10.1111/pce/13139.
[41] Vadez, V. 2014. Root hydraulics: the forgotten side of roots in drought adaptation. Field. Crop Res. 165, 15–24.
[42] Zaman-Allah, M, Jenkinson, D. M., Vadez, V. 2011a. Chickpea genotypes contrasting for seed yield under terminal drought stress in the field differ for traits related to the control of water use. Functional Plant Biology 38, 270–281. doi:10.1071/FP10244.
[43] 43] Zhou, Y., Lambrides, C. J., Shu, F., 2014. Drought resistance and soil water extraction of a perennial C4 grass: contributions of root and rhizome traits. Funct. Plant Biol 41, 505–519.
[44] Suneet K., G. 2016. Comparison of the leaf parameters and transpiration rate in commonly grown exotic and indigenous tress species in India during the active transpiration period. Int. J. Bot. Res. 4, 13-16.
[45] Vadez, V., Ratnakumar, P., 2016. High transpiration efficiency increases pod yield under intermittent drought in dry and hot atmospheric conditions but less so under wetter and cooler conditions in groundnut (Arachis hypogaea (L.). Field Crop Res. 193, 16–23.
[46] Jacqueline, W. L. P., Manoel, B. A., Péricles, A. M. F., Rejane, J. M. C. N., Liziane, M. L., Roseane, C. S., 2016. Assessment of drought tolerance of peanut cultivars based on physiological and yield traits in a semiarid environment. Agri. Water Management 166, 70–76.