http://www.sciencepublishinggroup.com/j/ijepp doi: 10.11648/j.ijepp.20170506.11
ISSN: 2330-7528 (Print); ISSN: 2330-7536 (Online)
Solid Waste Generation Rate and Characterization Study
for Laga Tafo Laga Dadi Town, Oromia, Ethiopia
Mesfin Assefa
1, Muktar Mohammed
2, *1Institute of Architecture, Building Construction and City Development, Addis Ababa University, Addis Ababa, Ethiopia 2
College of Natural Resources and Environmental Sciences, Oda-Bultum University, Chiro, Ethiopia
Email address:
[email protected] (M. Mohammed) *Corresponding author
To cite this article:
Mesfin Assefa, Muktar Mohammed. Solid Waste Generation Rate and Characterization Study for Laga Tafo Laga Dadi Town, Oromia, Ethiopia. International Journal of Environmental Protection and Policy. Vol. 5, No. 6, 2017, pp. 84-93. doi: 10.11648/j.ijepp.20170506.11
Received: October 25, 2017; Accepted: November 6, 2017; Published: December 20, 2017
Abstract:
Knowledge of the quantities and composition of the municipal solid waste is fundamental for the planning and development of waste management systems for cities. The objective of this study was to determine the composition and generation rate of household, commercial firms, government institutions and health care facilities solid waste in Laga Tafo Laga Dadi town, Oromia, Ethiopia. Representative Samples were randomly selected from all studied units for the solid waste generation rate per capita and composition determination. Formal survey using structured questionnaire was conducted to gather data on socio-economic condition and current waste management practices of the inhabitants. The per capita daily solid waste generation for household range 0.43 -0.46 kg and hotels, other business sectors and institutions were found to be 1.81, 1.57, and 0.41% kg/capita/day, respectively. The per capita daily solid waste generation in health facilities was found to be 9.61 kg/fac/day. The survey indicated that the household solid waste is composed of organic biodegradable 76% (food 62%) and ash 5% of the total weight of the sorted waste. Moreover recyclables constituents of the solid waste shared about 14.75% of the total weight. The Ropack residential village solid waste was composed of 48.66% organic (37.69% food) and bone accounts for 37.69% which equal to food waste. The recyclable and miscellaneous wastes account 13.94% and 2.76%, respectively. The organic waste of hotels accounts 67.45% (48.10% food) and the recyclables waste 2.44%. Likewise the ash was about 11%. Other business entities accounted 81.68% (68.81% food waste), recyclable shared 23.17% and the ash was 2.68% with miscellaneous 3.51%. The study also indicated that 37.72% infectious, 23.68% Sharps and 38.61% non-hazardous constituents of solid waste generated by the health care facilities in the town. From the result of this survey it can be concluded that, biodegradable solid waste constituted a lion share of the solid wastes generated in the town. Thus, the municipality can recover this waste by introducing an integrated urban agriculture that might convert this waste to organic fertilizer through composting.Keywords:
Municipal Solid Waste, Solid Waste Generation Rate, Integrated Solid Waste Management, Composition of Waste, Bio-Degradables1. Introduction
Solid Waste Management is a vital, ongoing and large public service system, which needs to be efficiently provided to the community to maintain aesthetic and public health standards. Globally, solid waste management is one of the greatest environmental health challenges and continues to overwhelm local authorities and national governments as urban populations continue to rise and consumption patterns
national regulations [14]. The composition of the generated waste is extremely variable as a consequence of seasons, life style, demographic, geographic and local legislation impacts. These variations make defining and measuring the composition of waste more difficult and at the same time more essential.
The characterization of solid waste streams and the estimation of solid waste generation rates are critical information needed to seek alternative solutions to problems created by rising solid waste- disposal costs, increasing public opposition to new landfills and the growing interest in recycling. In Ethiopia, like developing countries, the increasing of solid waste generation is resulted from rapid urbanization and population booming. The amount of solid waste in Addis Ababa and other fast growing areas of the country have been increasing over time, largely attributed to rapid population growth rate and economic factors. For instance, in Addis Ababa the solid waste collection coverage is about 65% and about 10% is estimated to be recycled. The remaining 25% often dumped in open spaces, ditches, riverbanks [8].
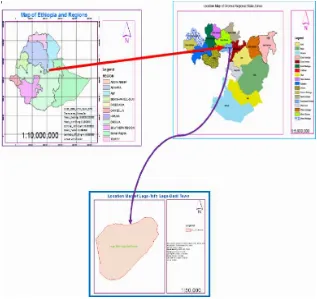
Laga Tafo Laga Dadi town is located in the Oromia Regional State, Finfinne especial Zone. It is located 21km north-east of Addis Ababa. The town is one of the country’s towns experiencing rapid urbanization rate. Based on field survey conducted in the town and discussion with municipality officials poor sanitation, which is caused by the improper disposal of solid waste management practice is one of the key environmental issues in the town. The poor sanitation condition, apart from its negative impact on the aesthetic quality of the town, is a public health concern as it
causes disease transmitter. Characterization of the waste streams to determine the waste composition and generation rate per capita per day from residential households, commercial centers, public institutions and health care facilities is important in planning, development and monitoring of waste management strategies. Moreover, it is noted that there are no previous studies conducted on the amount and composition of solid waste generated in the town. Therefore, this study was initiated with the objectives to determine the per capita per day generation rate and composition of solid waste from households, commercial centers, public institutions and health care facilities in the town.
2. Materials and Methods
2.1. Descriptions of the Study Area
2.1.1. Location
Laga Tafo Laga Dadi town is located in Oromia National Regional State, along the avenue to Dessie-Mekele at a distance of 21 km from Addis Ababa, the capital of Ethiopia. Geographically it is between 9°01'29" N - 9°06'0” N latitude and between 38°53'42" E - 38°55'30" E Longitude. It is located at altitude 2,316 to 2,500 masl. The mean annual, maximum and minimum temperatures of the town are calculated to 17.22°C, 23.76°C and 10.67°C, respectively, which is the characteristic of a warm temperate climate. Recently the town administration has two kebeles namely; Laga Tafo (01) and Laga Dadi (02) sub-divided into 24 zones with in an area of 24,350 hectares.
2.1.2. Economic Situation
Basically from its foundation the town administration was established from the farmer kebeles. Thus, agrarian societies are practicing their agriculture, cattle and traditional pottery. In current situation as the town administration expands and the number of population increased having different customs and work behavior the economy enlarges from small scale trade to national and international level investments. Some of them are small scale trades, cottage industries, micro and small enterprises and urban agriculture. More over the town administration was well known by different kinds of investments 106 in number among these 10 of them are real estate.
2.1.3. Population
Based on population projection by Oromia Urban Planning Institute the estimated population of Laga Tafo Laga Dadi town in 2007 was 8402 at medium variant. Projecting the population based on Oromia population growth rate was 2.90% per year [3] expected to reach 13,099 by the end of 2016. However the reality on the ground is different i. e. currently the population of the town is estimated to be greater than the projected number. The tremendous increase of human population can be attributed to rapid urbanization and migration from Addis Ababa. The driver of migration might be relative low living expense especially house rent compared to the city of Addis Ababa, the capital of Ethiopia.
2.2. Sample Size Determination
In any sample survey, sample size determination is an important step. The number of samples depends primarily on the cost versus its utility. For higher statistical accuracy and confidence level, the number of samples will be more. There are statistical procedures to calculate the number of samples at each confidence level. Usually for solid waste data, the confidence level is set at 80% or 90% [1]. Hence for this assessment a 95% confidence level is considered, moreover the allowable error was 0.05 and statistics theorem sampling techniques were used and calculated.
According to data obtained from the municipality the total number of housing units for town is estimated to be 8,153 (N). According to the data the residential housing units are 8,000 which is 98% which is the value for p. Q represents non-housing units with a value of 2%. Using Cochran method the sample size that was considered for this studywas30 for both residential households and non-residential entities. However to increase the quality of data in this survey about 92 residential household, 35 commercial center, 5 government institutions and 5 health center and clinics a total of 137 samples were considered.
Sample size determination based on [2] sampling size determination:
n= ∗ ∗ ∗
∗ ∗ ∗
Where:
n = Sample size of housing units
P=Housing unit variable (residential houses) Q = Non-residential housing units = 1-P N= Total number of housing units
Z = Standardized normal variable and its value that corresponds to 95% confidence interval equals to 1.96
d = Allowable error (0.05)
A total of 157 samples were considered for this study which is quiet sufficient to comply the minimum sample size for the standard scientific study.
2.3. Solid Waste Data Collection
As indicated above by using Cochran technique the sample size that was considered 157 housing units. About 112 residential households were targeted and were possible to reach 92 HH. Similarly it was targeted to reach 45 non-residential housing units (20 hotels, 15 other businesses, 5 health facilities and 5 government institutions) and possible to address only 44. The data collection was door to door for solid waste collection and measuring. Similarly the characterization was conducted at the disposal site after transporting the waste from the source.
2.4. Socio-Economic Data Collection
Prior to socio-economic data collection one professional and three high school students were identified, recruited and trained. Accordingly the required socio-economic information was gathered using questionnaires from the randomly selected 160 household using door-to-door surveying. Out of the distributed 160questionnaires it was possible to address only 156 residential households. Moreover; separate questionnaires were provided to gather information from five health facilities.
2.5. Materials Used for Data Collection
The materials which were used for the survey include: 2 buckets 20 liter capacity for volume and weight measurement; 12 spring scales (5kg, 50kg and 100kg capacity) for weight measurement; plastic sheet for waste sorting; personal protective equipment and data recording formats.
2.6. Door to Door Solid Waste Data Collection
amount of waste generated below 100 gm. it was mixed with the next two or three units. The result was taken as an average by adding the units and dividing them by the number of units for weight measurement and sorting purposes. The measurement and sorting were conducted every day from 7:00 am-4:00 pm according to the work plan with replacement of bags with the same size for the next day measurement. The status of residential HH & non- residential households were identified and coded. The measured wastes were collected and transported to the landfill for sorting purpose and dispose properly every day by using a vehicle and repeated for eight days.
2.7. Analysis of Bulk Density and Composition
The bulk density was determined by putting the waste into the 20 liter capacity plastic bucket to measure the volume and weight for each category of solid waste sources. After measuring the weight and the volume the waste was placed on plastic sheet and spread for sorting purpose. The bulk density was calculated by dividing the weight by the volume of the waste. The composition was also determined by sorting each type of waste for each category of waste sources. Each sorted waste type was weighed and recorded and each portion of waste weight was divided by the total and multiplied by 100 to get the percentage composition. The waste that was remained after the sorting analysis was disposed properly at the landfill. Similarly the waste that was generated from the health care facilities was source segregated in to infectious, sharps and municipal / non-hazardous wastes. The weight of each component was daily measured and recorded on data collection format.
2.8. Data Analysis
The gathered socio-economic, waste generation and composition data were analyzed using Spread Sheet and
SPSS. Consequently the mean and standard deviation for the total waste generated per household per day, per business entities per day, and per health facility per day were calculated. The per capita solid waste generation rate for each streams were also calculated and the results were compared. The individual components of the examined solid waste stream and their relative distribution based on weight percentage were presented using tables and charts. Moreover the socio-economic data was tabulated and analyzed.
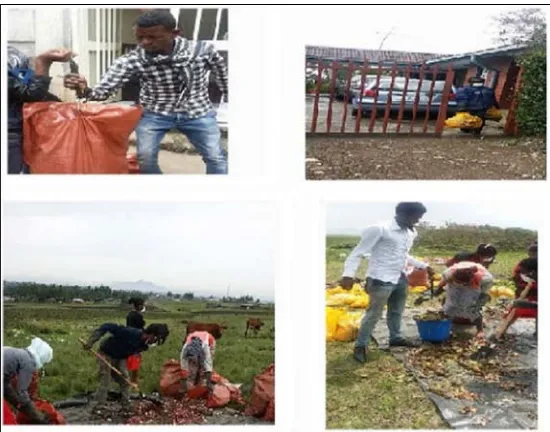
Figure 2. Waste streams (collected and sorted).
3. Results and Discussion
3.1. Per Capita Waste Generation Rate
3.1.1. Residential Households
The per capita solid waste generation rate of households in the town was investigated. The study revealed that minimum daily per capita solid waste generation rate was found to be null, the maximum was 2.71 and the mean was found to be 0.41 kg/cap/day for residential households in the town (Table 1).
Table 1. Residential households’ solid waste generation rate in kg/cap/day.
Sampling days N Minimum Maximum Mean Std. Deviation
Statistic Statistic Statistic Statistic Std. Error Statistic
D1 72.00 - 2.75 0.56 0.07 0.61
D2 72.00 - 5.00 0.47 0.08 0.69
D3 72.00 - 1.55 0.31 0.03 0.30
D4 72.00 - 2.10 0.30 0.05 0.42
D5 72.00 - 4.20 0.54 0.08 0.65
D6 72.00 - 1.60 0.38 0.04 0.31
D7 72.00 - 1.80 0.31 0.04 0.31
Valid N 72.00
3.1.2. Ropack Residential Village
The minimum daily per capita solid waste generation rate was found to be o.03, the maximum was 1.74 and the mean was found to be 0.46 kg/cap/day for Ropack village residential households (Table 2). The slight deviation below the mean indicates that almost all the data was close to the mean. Likewise there was a slight variation between the
residential HHs and Ropack village by about 12% in the daily solid waste generation. This suggests that the daily household solid waste generation rate per household may increases as the economic status of households and living standard rises. Similar trends were reported for Hawassa town [4], Adama town [12], and Arada sub city [19] in Ethiopia.
Table 2. Ropack village solid waste generation rate in kg/cap/day.
Sampling days N Minimum Maximum Mean Std. Deviation
Statistic Statistic Statistic Statistic Std. Error Statistic
D1 20.00 - 2.00 0.44 0.10 0.43
D2 20.00 0.10 1.00 0.45 0.06 0.27
D3 20.00 - 3.50 0.63 0.17 0.78
D4 20.00 - 1.30 0.36 0.09 0.38
D5 20.00 0.10 1.00 0.39 0.07 0.29
D6 20.00 - 1.90 0.48 0.11 0.48
D7 20.00 - 1.50 0.46 0.09 0.39
Valid N 20.00
3.1.3. Hotels and Restaurants
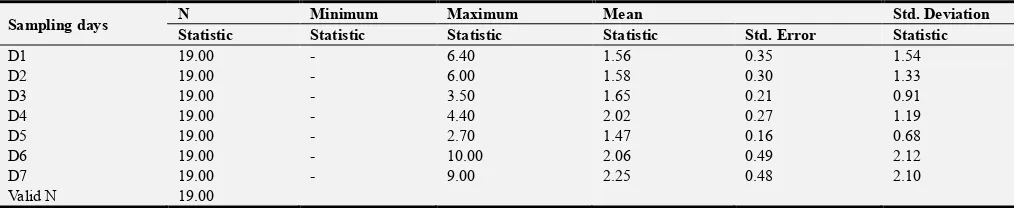
The per capita solid waste generation rate of the hotels and restaurants in the town over the survey period was assessed. The average number of employees in the hotels and restaurants in the town was found to be 5.75 persons per facility. The mean daily solid waste generation of the hotels and restaurants were 1.80 kg/emp/day. The slight deviation below the mean indicates that the data collected are clustered to the mean (Table 3).
Table 3. Hotels and restaurants solid waste generation in kg/employee/day.
Sampling days N Minimum Maximum Mean Std. Deviation
Statistic Statistic Statistic Statistic Std. Error Statistic
D1 19.00 - 6.40 1.56 0.35 1.54
D2 19.00 - 6.00 1.58 0.30 1.33
D3 19.00 - 3.50 1.65 0.21 0.91
D4 19.00 - 4.40 2.02 0.27 1.19
D5 19.00 - 2.70 1.47 0.16 0.68
D6 19.00 - 10.00 2.06 0.49 2.12
D7 19.00 - 9.00 2.25 0.48 2.10
Valid N 19.00
3.1.4. Other Business
The minimum daily solid waste generation was found to be 0.32 and the maximum was 3.82kg/capita/day. The mean solid waste generation was found to be 1.57kg/emp/day (Table 4). Likewise the standard deviation was found to be 1.03 which is below the mean value to reveal the values are clustered around the mean.
Table 4. Other businesses solid waste generation rate in kg/capita/day.
Sampling days N Minimum Maximum Mean Std. Deviation
Statistics Statistics Statistics Statistics Std. error Statistics
D1 15.00 0.60 6.40 2.30 0.47 1.80
D2 15.00 0.50 5.20 2.24 0.42 1.61
D3 15.00 0.33 3.70 1.67 0.22 0.87
D4 15.00 0.20 2.45 1.11 0.18 0.68
D5 15.00 0.20 2.00 1.11 0.15 0.58
D6 15.00 0.15 3.00 1.15 0.20 0.76
D7 15.00 0.25 4.00 1.40 0.24 0.91
Valid N 15.00
3.1.5. Governmental Offices
The per capita solid waste generation rate of the government offices in the town over the survey period was computed. The average employees for the governmental offices (municipality, Finance, etc.) were found to be 6.6 persons per office. Minimum daily solid waste generation was 0.12 and the maximum was 0.78kg/emp/day. The mean SW generation was found to be 0.40kg/emp/day. Likewise the standard deviation was found to be 0.26 kg/emp/day which was below the mean value to reveal the values were clustered close to the mean.
Table 5. Governmental offices solid waste generation rate in kg/employee/day.
Sampling days N Minimum Maximum Mean Std. Deviation
Statistic Statistic Statistic Statistic Std. Error Statistic
D1 5 0.1 1.0 0.44 0.15 0.34
D2 5 0.1 0.8 0.42 0.13 0.29
D3 5 0.1 0.5 0.22 0.07 0.16
D4 5 0.1 0.6 0.40 0.08 0.19
D5 5 0.2 1.0 0.54 0.15 0.34
Valid N 5
3.1.6. Health Care Facilities
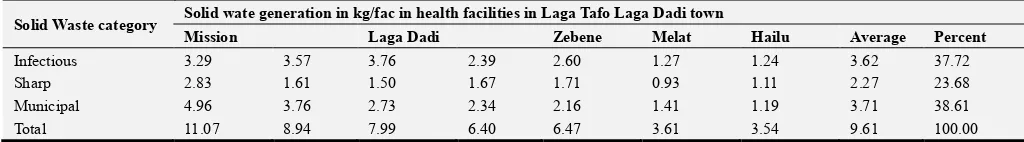
In total two public and three private health care facilities were considered for this study. The minimum daily infectious waste generation was found to be 1.24 kg/day at Hailu Clinic and the maximum daily infectious waste was 3.76 kg/day at Laga Dadi Health Centre and the average infectious waste was 2.59 kg/fac/day that account 30.19%. The minimum daily sharp waste generation was observed at Melat clinic with 0.93 kg and the maximum was 2.83 kg at Mission
Health Facility. The average sharp waste generation was 2.27 kg per facility per day (Table 6). The minimum municipal solid waste generation was recorded at Hailu clinic with 1.19 kg/day and the maximum was 4.96 kg/day at mission health facility with the average value of 3.71 kg/fac/day to account 43.27% from the total health facility solid waste generation rate. The overall solid waste generation in the health facility was found to be 9.61 kg/fac/day with 56.73% hazardous and 43.27% non-hazardous or municipal solid waste.
Table 6. Daily average solid waste generation in kg/fac/day.
Solid Waste category Solid wate generation in kg/fac in health facilities in Laga Tafo Laga Dadi town
Mission Laga Dadi Zebene Melat Hailu Average Percent
Infectious 3.29 3.57 3.76 2.39 2.60 1.27 1.24 3.62 37.72
Sharp 2.83 1.61 1.50 1.67 1.71 0.93 1.11 2.27 23.68
Municipal 4.96 3.76 2.73 2.34 2.16 1.41 1.19 3.71 38.61
Total 11.07 8.94 7.99 6.40 6.47 3.61 3.54 9.61 100.00
3.1.7. Total Per Capita Solid Waste Generation
The total per capita solid waste generation for the city is estimated to be 0.43 kg/cap/day and the annual per capita reached about 156.78 kg. As there is no previous research in the town, the observed result is compared with findings of other researchers in different cities of Ethiopia. According to a survey conducted on households in Hosanna town [17] the
Table 7. Total solid waste generation in the town by source in kg/cap.
Sources of waste centers Kg/cap/ day HH size /fac/emp #units Total Population Total in unit Annually in kg/unit
Residential HH 0.41 4.93 8000 39440 16,170.40 5,906,238.60
Real estate HH 0.46 4.29 3000 12870 5,920.20 2,162,353.05
Hotel 1.81 5.75 32 184 333.04 121,642.86
Factory 51 0 - -
School 7 0 - -
Other businessssss 1.57 1.87 23 43.01 67.53 24,663.76
Others 2 0 - -
Health Facility 8.57 1 8 8 6856 25,,41.54
Gov. office 0.4 6.6 30 198 79.20 28,927.80
Total 11,153.0 52,743.01 22,638.93 8,268,867.61
Per capita 0.43 156.78
On the other hand [12] reported that the daily per capita solid waste generation rate for Adama town was 0.1kg which is less than the value recorded in this study. [19] reported that daily per capita solid waste generation rate for Arada Sub-city of Addis Ababa ranges between 0.075 kg and 0.163 kg which was greater than the value recorded in this study. Likewise the study conducted in Gerbe Guracha town reported 0.35 kg/cap/day [7] which was slightly lower than the current study result. The variation in results may be attributed to change in socio-economic, physical conditions and time difference. The town is surrounded by Laga Tafo and Laga Dadi River which may contribute for huge amount of organic waste to be generated. Moreover the study was conducted in rainy season that may probably increase weights of the daily solid waste generated.
3.2. Solid Waste Projection
Calculating the total generation rate of solid waste streams
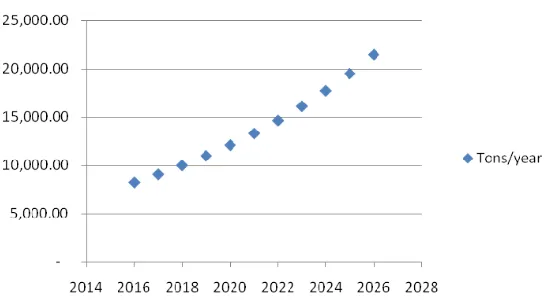
enables us to estimate the total waste that can be generated daily, monthly or yearly, which in turn provides a basis for a sound solid waste management plan for a given town/city for a certain period of time interval. A projection for the total solid waste generation was made by taking in to consideration of the expected growth in population and estimated per capita household waste generation for the town. To predict population growth it was assumed that population is increasing in arithmetical progression and assumption is made that this pattern will persist into future. However, for this study solid waste generation were projected based on the assumption of 10% annual growth of waste generated as of the current year which is 8269 tons per year (Table 7). Therefore, projecting annual solid waste generation for the coming 10 years (Figure 4) and by 2026 the annual solid waste generations for the town will be 21,448 tons.
Figure 4. Estimated solid waste generation with the assumption of 10% increase per year.
The population growth and migration, underlying economic development, household size, employment changes, as well as the impact of waste recycling are factors that influence solid waste generation interactively [11]. [15] reported that the rate of waste generation is an index of socio -economic development of the region.
3.3. Composition of Solid Waste
3.3.1. Residential Households
The composition of waste is as much an important
0.98%, rubber = 0.37%, metal = 0.65% and glass = 1.69%) and ash had a share of 4.86%. The bio-degradable organic wastes including food accounted 76.50% (paper=4.75%, grass=6.37%, leaves =3.33% and wood=0.52%) and miscellaneous (includes diapers, medical wastes and insecticides) accounted 4.84%.
3.3.2. Ropack Residential Village
Food and bone waste accounts 76% (each 38% share) followed by grass which accounted 7.58%. However, the total decomposable organic compounds including food waste accounted for 48.32% (paper=3.05%, grass=7.58% and leaves=0.34%) which was greater than the amount recorded for residential HH in the town (Table 8). Glass and miscellaneous wastes accounted 3.79% and 2.76% respectively. All other waste generated from the village accounts 0.48% (textile, rubber and metal). The high content of the “organic” fraction of HH solid waste of the village can be attributed to the physical environment of this area and living standard of the HH. As income increases the organic waste decreases while other wastes including fines increases as income decreases in town in the period of this study. This is due to excessive use of biomass fuels including fuelwood and charcoal to generate too many ashes.
3.3.3. Hotels and Restaurants
The solid waste composition of hotels and restaurants food waste has shared 48% with a total of 67.45% bio-degradable organic wastes including food waste and others (paper 4.11%, grass 9.50%, leaves 1.91% and leather 3.83%). Ash/fines account 11.30%, plastics account 6.57%, bone shared 4.68%, glass took a share of 4.11% and others account a share of 2.44% (textile, rubber, ceramics and miscellaneous) (Table 8).
3.3.4. Other Business Entities
For other business entities solid waste composition, food waste accounts a share of 69% with a total of 82.85% bio-degradable organic waste. Plastic, fines and textile accounts 8.70%, 2.68% and 2.26% respectively. Miscellaneous wastes accounts a share of 3.51% of the total daily solid waste generated on these business sectors.
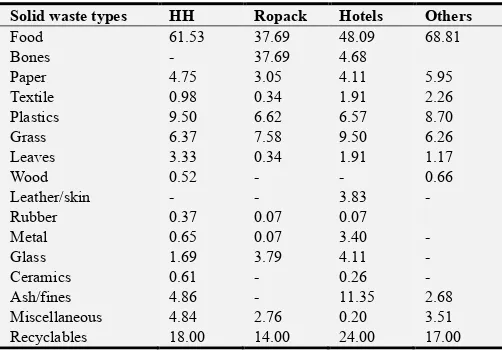
Table 8. Solid waste composition by source in the town.
Solid waste types HH Ropack Hotels Others
Food 61.53 37.69 48.09 68.81
Bones - 37.69 4.68
Paper 4.75 3.05 4.11 5.95
Textile 0.98 0.34 1.91 2.26
Plastics 9.50 6.62 6.57 8.70
Grass 6.37 7.58 9.50 6.26
Leaves 3.33 0.34 1.91 1.17
Wood 0.52 - - 0.66
Leather/skin - - 3.83 -
Rubber 0.37 0.07 0.07
Metal 0.65 0.07 3.40 -
Glass 1.69 3.79 4.11 -
Ceramics 0.61 - 0.26 -
Ash/fines 4.86 - 11.35 2.68
Miscellaneous 4.84 2.76 0.20 3.51
Recyclables 18.00 14.00 24.00 17.00
The recyclable wastes are quiet significant as compared with other towns of Ethiopia. For instance the study conducted in Gerbe Guracha town revealed that the total household recyclable wastes shared only 7% [7] of the solid waste generated. However in this study hotels, residential households, others and Ropack residential village shared 24%,18%,17% and 14% respectively and with an average of 18.20% from the total waste generated in the town. Based on a similar survey conducted in Bahir Dar city, the food waste constituted 29%, ash and soil 48%, and recyclables 9% of the total weight [6]. A study conducted on households in Hawassa town [4] reported that putrescible matter accounts for 59.7%, fines/ash& dust/ 31.3% and recyclables 6.1% by weight. Similarly [12] reported for Adama that organic decomposable waste constituted 56%, fines 36% and recyclables covered 6.2% of the total weight. [16] also reported that putrescible matter accounts for 36- 57% for an assessment conducted in Makurdi, Nigeria. Regional default value for composition of municipal solid waste shows that food waste covers 53.9%, recyclables 18.4%, and others 27.7% of the total weight [10]. The result obtained for organic decomposable fractions is similar with Eastern Africa default value & Makurdi city, Hawassa, Adama and regional default value and it is significantly higher than Bahir Dar town. The recyclable waste is twice as compared with Bahir Dar, three times of Hawassa, Adama, and similar to the IPCC regional default value.
Waste composition is influenced by many factors, such as level of economic development, cultural norms, geographical location, energy sources, and climate [18]. As a country urbanizes and populations become wealthier, consumption of inorganic materials (such as plastics, paper, and aluminum) increases, while the relative organic fraction decreases. Generally, low- and middle-income countries have a high percentage of organic matter in the urban waste stream, ranging from 40 to 85% of the total.
Figure 5. Organic fraction of HH solid waste in the town.
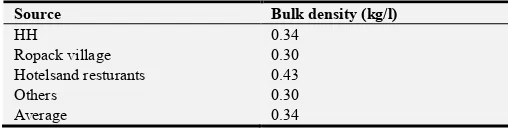
3.4. Bulk Density of the Waste
Table 9. Bulk density of solid waste in different solid waste sources in town.
Source Bulk density (kg/l)
HH 0.34
Ropack village 0.30
Hotelsand resturants 0.43
Others 0.30
Average 0.34
4. Conclusions and Recommendations
4.1. Conclusions
Based on a week survey conducted on households, commercial centers, government institutions and health care facilities the daily solid waste generation rates were determined. Residential HH generate 0.41 kg/cap/day, Ropack residential village generate 0.46 kg/cap/day, Hotels and restaurants generate 1.81 kg/emp/day, other business entities generate 1.57 kg/emp/day, governmental institutions generate 0.40 kg/emp/day and health facilities generate 9.61 kg/fac/day. The infectious, sharp and municipal solid waste generated from health facilities were 3.62, 2.27, and 3.71kg/fac/day, respectively. The composition of solid waste for HH solid waste were 76% organic biodegradable where food waste accounted about 62%. The recyclable HH solid waste accounted 14.75% and ash accounted about 4.86%.
The organic and biodegradable wastes for Ropack residential villages were 49% from which 38% was food waste. The recyclable and ash from the village were found to be 14% and 0.0%, respectively, with surprising amounts of bones that accounted 38% of the total daily HH solid waste generated. The organic and biodegradable wastes of the hotels and restaurants were about 67%, recyclables about 21% and ash about 11% with food waste 48% of the daily SW generated. Other business entities accounted about 83% of organic and biodegradable wastes from which 69% was food waste. The recyclable and ash were 17% and 3% from the total daily solid waste generated. The bulk density of the waste ranges from 0.30-0.43 kg/l among different waste generation streams. Hazardous wastes were observed mixed with other non-hazardous wastes during sorting exercise. This clearly reflects lack of a system for hazardous waste management system in the town and the level of awareness among citizens and municipality officials. A potential threat for vector dependent diseases and disease arising from food wastes.
4.2. Recommendations
Establish a household waste sorting program in town. This helps to recover materials that can be recycled. Moreover, it reduces the amount of wastes requiring collection and disposal. Based on the assessment the household waste can be categorized into three major components i. e. organic decomposable/putrescible, fines and recyclables. In the short to middle term the town can start a pilot household solid waste sorting program in to three categories namely putrescible, fines and recyclables. Based on the results of this study, biodegradable solid waste constituted a lion share of
the household wastes generated in the town. Hence the municipality can recover this waste by introducing an integrated urban agriculture that might convert this waste to organic fertilizer through composting program. Piloting this program may have the following benefits: providing job opportunity, source of income to youth/citizens, enhances urban agriculture practice (contributes for nutritious food stuff & healthy society), reduce the cost of waste transportation and contributes to a clean and green town.
Efforts should also be made to recover recyclable components of the household waste stream as the study result reveal significant amount of recyclables. Further study should be carried out on other waste generators (institutions, street sweeping, and all commercial firms, industries, etc.) to have a complete picture of the solid waste composition and generation rate of at the town. During the survey hazardous wastes were identified as part of the household wastes. These types of wastes are dangerous and pose risks to human health and the environment, the town need to establish a system to manage these type of wastes safely.
Sensitize the public on impacts and handling of municipal hazardous and non-hazardous wastes. The private sector involvement in solid waste management should be encouraged and establishing and strengthening MSEs for SW management should be a priority issue for the town. Land filling is one essential component of municipal solid waste management. The waste that remains behind or unmanaged through reuse, recycle and refuse initiative should be disposed safely. In this regard, it is important to establish a sanitary landfill system in the town. If not, this may cover, allocate budget, site selection, design, fencing, construction, training, purchasing of equipment and working procedures and manuals are some to be mentioned.
References
[1] Cacadia Consulting Group (2003). Guidelines for Waste Characterization Studies in the State of Washington. Washington State Department of Ecology.
[2] Cochran, G. (1977). Sampling techniques, 3rd ed. Wiley series in productivity and Applied mathematical statistics. New York, USA.
[3] CSA, (2007). Population and Housing Census. Addis Ababa: Ethiopian Federal Democratic Republic Central Statistical Agency.
[4] Dereje Diriba, (2009). Household Solid Waste Generation Rate, Composition and Content Analysis for Disposal and Resource Recovery in Two Selected Kebeles of Hawassa Town. M. Sc. Thesis Addis Ababa University, Ethiopia. [5] Environmental Protection Agency (2007). Municipal Solid
Waste Generation, Recycling, and Disposal in the United States: Facts and Figures, Washington, DC. USA.
[7] GG consult. (2015). Solid Waste Generation Rate and Characterization Study for Gerbe Guracha Town. Addis Ababa: Water Aid Ethiopia.
[8] Getaneh Gebre and Tesfaye Beyene (2006). Household Waste Sorting and Composting the case of Gerji Composting project, Addis Ababa Environmental Protection Authority. Addis Ababa, Ethiopia.
[9] Hoornweg, D. and Bhada-Tata, P. (2012). WHAT A WASTE, A Global Review of Solid Waste Management, Urban Development Series, The World Bank.
[10] IPCC, (2006). Waste Generation, Composition and Management Data, IPCC Guidelines for National Greenhouse Gas Inventories.
[11] Karadimas, N. V., Alessandra, O. (2006). MSW generation modeling based on fuzzy logic, Proceedings 20th European Conference on Modeling and Simulation, ISBN0-9553018-0-7/ISBN 0-9553018-1-5 (CD), pp 1-6.
[12] Lema Asfaw (2007). Household solid waste generation rate and composition analysis in two selected kebles of Adama town, MSc Thesis, Addis Ababa University. Addis Ababa, Ethiopia.
[13] Marshall, R. E. and Farahbakhsh, K. (2013). Systems approaches to integrated solid waste management in
developing countries. Waste Management, vol.33, no. 4, pp.988–1003.
[14] McCauley-Bell, P. and Reinhart, D. (1997). Municipal solid waste composition studies, pp. 158-162.
[15] Sastry, D. B. S. S. R., (2007). Composition of MSW– need for thermal treatment in present Indian context, Earth Engineering Center, Columbia University, pp 2-12.
[16] Sharholy, R., Aboho, S. Y., Oketunde, F. O., Eneji, I. S., Unazi, G. and Agwa, S. (2007). Survey of solid waste generation and composition in a rapidly growing urban area in central Nigeria. Waste management 27.352-358.
[17] Tekilu, E. L. (2014). Characterization and Disposal of Municipal Solid Waste, Case Study, Hosanna Town. American Journal of Environmental Engineering, 162-168.
[18] World Bank (2012). What a waste, A global Review of Solid Waste Management, Urban Development Series Knowledge Paper, No. 15, WB, 2012.