Cold Atoms in Cavity QED for Quantum
Information Processing
Tf~esis by
David
W. Vernooy
In Partial Fulfillment of tlre Requirernerrts for the Deg~ee of
Doctor of Philosoph~y
@ 2000 David \frtii'. Vernooy
Acknowledgements
I ~vould like to tfiaiik first antl forornost Jeff Kimble for providing the kind of at- mospllere and resources necessary to do world-class rcscarch in at,ornic atil optical phy-sics. Virtually everything I now krtow about doing science, froill daily experime~l- tal .'plumbing" techniques to assessrrlerit of long-term scientific goals, colrlcs frorn him. His personal encouragen~ent of, keen interest in, and conitributions to every aspect of the work presented herc have been much appreciat,ed. His energy and enthusiasm liave been infectious.
I an1 indebted to all those with whom I have had the pleasure of working dur- ing my tenure at Calteth. including Joe Buckt Akira Furusawa, Chris Fuchs, Xikos Georgiades, Christina Hooti, Ron Legere, Theresa Lynn; Jason L;IcKcever, Michael Xielsen; Dan Starnper-Kurn, Quentin Turc;liette ancl Steve11 V ~ I I Enk.
I
would like to especially acknowledge Vladirriir Ilchenko, Hideo Mabuclii, Christopll Xagerl, Sze Tan arid Jun Ye for tlie rnyriad of experimental and tlseoretical tricks I have learner1 from tk1c111. Outside tire lab, both Franklin X~lonzon arid Bill 'tkrcber have been great roornrnates arrd iiave lselpctl keep r~ie abreast of scierst,ific tlt:velopnlerits outside of rjuanturn optics.Abstract
The riew field of qualltuln inforrriatioli science has exploded into virtually every area of i~iodern physics because of t,he promise it holds for understa~~ding physical lirnits to communication, computatiori and more generally t,hc processing of informat,ion. Remarkably, this has conic concornitar~tly with stunning successes at illtegrating laser cooling and trapping techniques with high finesse microresonators. A regime wliere some of the new theoretical ideas may be experirnentally t,ested iri the particular setting of cavity qilantilm electrodynamics (&ED) has now beer1 reached.
Contents
Acknowledgements iii
Abstract iv
1 Introduction 1
I MICROSPHERES
6
2 Microsphere Resonators in Cavity
QED
72.1 The Motivation: Microspheres as a Future Uirectiori for CQED Exper- iment. s . . . 7
. . .
2.2 Whispering Gallery Modes 10
. . .
2.2.1 Allode Fuiict. ions 10
. . .
2.2.2 Rtrtiiative Quality Factors I1
3 High (2 Measurements for Fused Silica Microspheres in the NIR 13 . . .
3.1 ExperinlentalIssues 13
. . .
3.1.1 Fabrication ant1 Cleaning 13
3.1.2 Mode Coupling iind Ringdown hIeas~~eriients . . . 14
. . .
3.2 ?ilea.~urenierits 19
. . .
3.2.1 T4kvelengtlr Dependence of the (2 19
. . .
3.2.2 What is Lirriiting the Q? 20
4 Cavity
QED
with High CJ Whispering Gallery Modes 25. . .
4.1 VHV Sphere Apparati~s arnd Dat. a Acyi~isition 26 . . .
4.2 Observations 30
. . .
VI
4.2.2 Intracavity I'hoton n'umher Calibration
. . .
4.3 Model for the Ir~t. eractioil . . .
-1.3.1 Ansatz for the Three Contributior~s to the Susceptibilit. y
.
.4.3.2 What About the Extremely Karrow %a. t~ires? . . .
4.4 A I ~ Update . . .
11
CIV4 QUANTIZATION IN CAVITY QED
5 Well-Dressed States for Wavepacket Dynamics in Cavity QED 5.1 Introductiorl . . .
5.2 Field-Wavepacket Overlaps . . .
5.3 Tile Well-Dressed States . . .
5.4 Structure . . .
5.4.1 Hamiltoniarl . . .
5.4.2 Tllc Three Different Regimes . . . . . .
5.5 Dynamics
...
. . .5.5.1 Dissipation . . .
I11 TRAPPED ATOMS IN CAVITY QED
6 Cold Atoms and High Finesse Microcavities
.
Experimental6.1 I~itroduction . . .
6.2 Delivc.c:ring Cold At. orris to the Cavity . . .
6.2.1 Cesiurn Level Structure . . .
6.2.2 Systerrl Overview ar~tl Introduction to t. he MOT . . .
. . .
6.2.3 Tile L'acuurn Systerrl
6.2.4 The Upstairs hIOTl . . .
6.2.5 Polarization Gradient Cooling (PGC) . . .
6.2.6 The Downstairs L11OT2 . . .
vii
. . .
6.2.8 Timirig Diiigrarn 92
6.3 The High Finesse Cavity . . . 93
6.3.1 Const. rilctiori . . . 93
6.3.2 Deterrninatioll of Cavity Parameters . . . 95
6.3.3 Passive Vibrat. ion Isolation a. rld t lie Cavity Support. St. ructurc 101 6.3.4 Motle-kfatcliing and Cavit.
y
Birefringence . . . 10'3 6.3.5 The Cavity Servo . . . 1056.4 The Laser System? Cavity Locking and Heterodyne Dotection of the Intracavity Field . . . 107
6.4.1 Ti.SapphireLaser . . . 107
6.4.2 The Transfer Cavity and Locking Diode Laser . . . 112
6.3.3 Heterotiyne Detect. ion . . . 116
6.4.4 DataAcquisition . . . 118
7 Trapping a Single Atom Inside a High Finesse Cavity 120 7.1 Atoni Transits amd Trapping with a Single Photon . . . 120
7.1.1 Eigenvahle Spectra and Do~vngoing Atom 'nrarisits . . . 121
7.1.2 Latt. icc (Cooling) Bearm I1 . . . 131
7.1.3 Upgoirlg Transits and Trapping with 1 Photo11
. . .
1397.2 11itraCavity FORT . . . 148
7.2.1 Far Off-Reso~lance Traps (FORTS) . . . 148
7.2.2 The Harriilt. oniarr and Eigcrlvalue Spectnlm . . . 155
7.2.3 FORT Laser Irriplcxlier~tatiorl . . . 1fX3 7.2.4 Atorn Transits in t. he Preses~i:e of the FORT . . . 164
7.2.5 FOKT Triggering with Single Aton~s: Trapped Atorris . . . 167
7.2.6 FORT Lifeti~r~e 3 1e;isureirierlt . . . 171
7.2.7 Limits to Trap Lifetime . . . 175
7.2.8 Blue FOlIT ft~attcrnpt . . . 180
8 Next Steps
viii
. . .
8.2 Resolved Sidebands 186
. . .
8.3 Irltracavity Cooling with a FORT 189
. . .
8.4 940 rlin FORT 190
. . .
8.5 Long-Lived Two-Level Atoms 193
. . .
8.6 fluorescent Imaging of a Single At. 0111 193
List
of
Figures
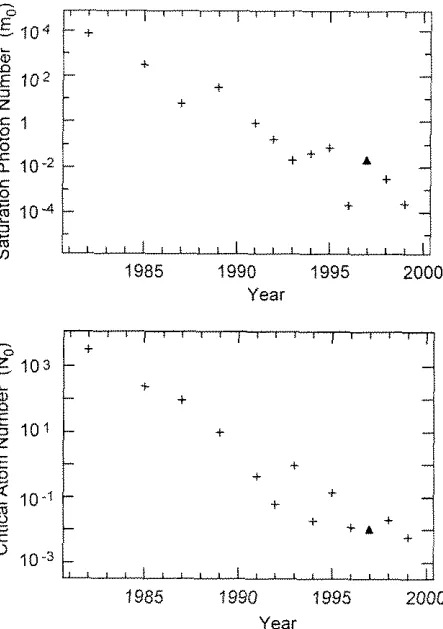
2.1 Progress in the crit. ical numbers for Kin~ble lab cavity QED experirnerrts 8
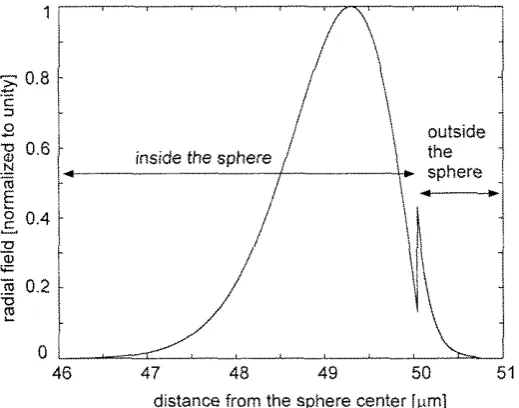
2.2 Tire radial field tiependency of a WGh.1 . . . 11
3.1 The basic apparat-us for riiicrospliere fabrication . . . 14
3.2 The apparatus used fc~r coiipling light into J.'Gbfs . . . 16
3.3 High Q microsphere ringdow~r rneasuremerit. s . . . 18
3.4 Experimental and theoretical dependence of tlie different Q values on wavelength . . . 19
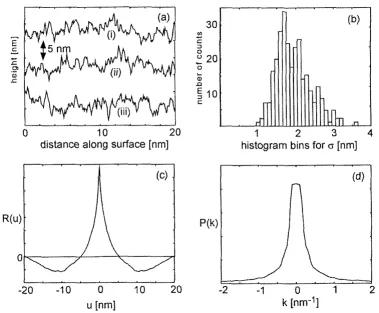
3.5 Statistical surface roughr~ess data as lneasurcd by AFM
. . .
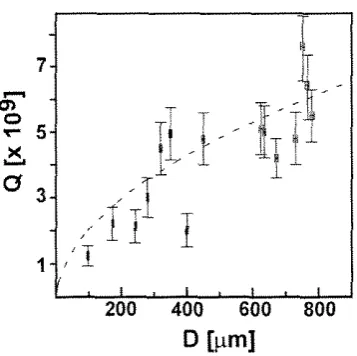
213.6 Tlre depenilence of Q on sphere size at 670 nm . . . 23
4.1 The apparatus for. tlie atorri-rnicrosplierc couplirig experiment
. . . .
264.2 The vacuum chmnber design for the atom-rnicrosphere coupling exper- i~llerit
. . .
274.3
A
close-1111 photograph rhroilg11 the cjuartz chamber a. t. the microsphere coupling apparatus. . .
294.4 hlicrosphere cavity trarisrriission data iri different Q regimes . . . 31
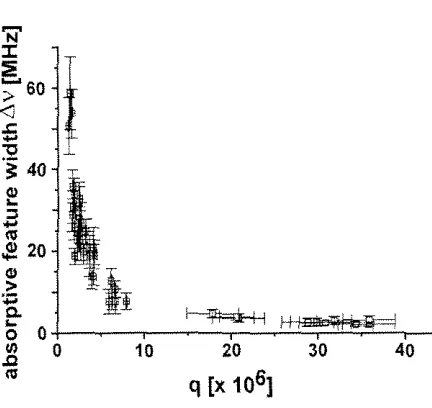
4.5 Dependence oft. he absorptive feature width on (2 . . . 32
4.6 Saturation of the atomic response and the inferred absorption profile 37 5.1 Comparison of the c.111. bound states with the spatial structure of the cparrtu~n field . . . 42
5.2 Eigenvdue spectra for the '\~~~ell-tlressed" states . . . 43
5.3 initial conditioris for the clynamicitl evoliltion of the hound states
.
. 524 Quadratic short tirr~e evolution of ( t ) . . . 52
X
5.6 Decorilpositiom of t. he initial c.rn. wavepacket in terlrrs of the bouiid states . . .
. . .
5.7 The iicpelltlcnce of ( t ) or1 the ratio R,,
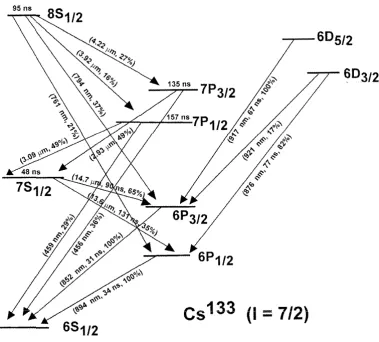
6.1 The level structure of Cs'33 . . .
6.2
h
schematic oft. lric physical layout of the two-stage XIOT set. up . . .6.3 A sketch of a typical XIOT geonlctry . . .
6.4 The layont of the vacuum systerrl for the atom trapping work . . .
6.5 Fluorescence from the atorrls in the upstairs MOTI . . .
6.6 The basic layout. for the tlxee upstairs MOTl diode lasers
. . .
6.7 Thc ~ ~ i e c h a i i s m for Iiniliil PGC . . .6.8 Measurerricnt oft. lie temperature of the MOTI atom cloud . . .
6.9 A scliemat. ic for t l x "do~vrtstairs" trapping laser set-up . . . 6.10 An image of the do~vrlstairs MOT2 . . .
6.11 Irnages of the falling XOT2 atoril cloud . . .
6.12 The spatial polarization st. ructure of a 2 0 opt. ical lattice
. . .
6.13 A tirriing diagram to clarify the experiment. a1 sequence . . .
6.14 The dcpendencc of the rriodc spacing on frequency for the physics cavity 6.15 The geornet. ry of thc XOT2 and cooling (lattice) laser beams around
the high finesse physics cavity . . .
6.16 The cavit. y support. structtre . . .
6.17 The amplitude and phase raponse of the thin PZT
. . .
6.18 The Ti.Sagphire, iockiiig arid FORT diodc laser set-up . . .
6.19 The Ti.Say, phire rioise cleperrde~lce on Ari and cliod+pilmpetl solid state purrlp source . . .
6.20 A diagram t o help to keep traclc of all the ilrlportarrt laser frecjuencies 7.1 The spatial ciependencc of thc eigeilvalues of the Jaynes-Curnmirrgs
Harniltonian . . .
7.2 The cavity transmissiori for cases of large arid sr~iall coupling g ( z )
.
.7.4 The very first set of downgoing atom t.ransit. s data for this incarnation
of the esperin~erit . . . 128
7.5 The width of a single atom transit event frorri the upstairs ?rlOTl . . 129
7.6 The transit widths for atorns from tlie dou~~istairs MOTz . . . 130
. . . 7.7 The effect of a long pulse fro111 the cooling bean~s 133 7.8 .4 n attempt t. o explain tile hebi~vior of the cooling beans . . . 134
7.9 The effect of a short cooling prilse on t. he atoms . . . 135
7.10 Individual txansits affected by the cooling beams . . . 137
7.11 Detuning the probe can have a trapping effect on tile atomic motion
.
141 7.12 A senli-classical explanation for Sysipl~us cooling in a one-photon po- tentla1 . . . 1447.13 Upgoing transits emphasize cc~nfincmert in the oncphotor~ potential . 147 7.14 The
AC
Stark shift of the ground stat. es due to the FORT trapping laser149 7.15 The FORT potent. ial as a function of wavelength . . . 1517.16 The scattering rate as a function of wavelength . . . 152
7.17 The registrat. ion FORT potential with respect t. o tlie cavity QED field 154 7.18 The spatial dependence of the eiger~values for an atom trapped near t. lie cent. er of the cavity . . . 158
7.19 Tli: eigerivalue st.ructnre 1/4 of the way along the cavity axis . . . 159
7.20 The limit of a very big FORT . . . 161
7.21 The effect of the at.om-cavit. y detuning . . . 162
7.22 Seven long "transits" with the FORT potential on . . . 165
7.23 Tile use of tile atorn-cavity tietinling to improve tile transit contrast . 166 . . . 7.24 Tllc updated timing diagranl to emphasize FORT triggering 168 7.25 Det.errnining the protjability that a11 atom inside the cavity will be trixppecl . . . 170
7.26 Single atom transits used to trigger the FORT . . . 171
7.27 Detection and trapping of a single atorn . . . 172
7.28 The detc:rn~ination of a t. rap lifetime close to 28 ms . . . 173
xii
7.30 The FORT lifetirnc independently verified . . . 175 7.31 The large background count at short times . . . 176 7.32 L'feasuring the hlie PSI) of fractional intensity fluctuat. ions of the FORT
laser at the physics cavity outprrt . . . 179 7.33 Verification that the locking beam has lit. tie r~icchanical effect on the
List of
Tables
6.1 Hyperfine structure for tire Cs GSIi2 -+
GeI2
I32 line at 852 nm. . ..
656.2
The co~~pling coefficients for an F = 4 -+ F' = 5 traimitiun..
. .. .
66 6.3 Comparison of t,he parameters for the upstairs and tiowrlst,airs MOTS.77
6.4 Comparison of the polarization gradierit cooling (PGC) parameters used for the t,wo MOTS.
. .
. ..
. . ..
. . ..
.. .
. .. .
. ..
. . 82 6.5 The measured wavclengti~s used in a dctcrmination of the cavity bet:spectral range. .
. .
. .. .
.. .
. ..
. .. .
. .. .
. .. .
. ..
. ..
95 6.6A
corripariso~i of the Cohuent Innova-100 Ar ion laser arrd CoherentVerdi as pump sources for. a Coherent 899 Ti :Sapphire laser. .
. . .
. 109 7.1A
comparison of the cooling parameters for the long downgoing transit,^. 138m
i .2
rZ
co~nparison of the coolirlg par;unet,ers for the long upgoing transits. 146Chapter
1
Introduction
The last five years have heralded in an extremely excit,ing new era in which physicist,^ have begun to explore both t,heoretically and experimentally tlic fundamerrt,al phys- ical liillit,s to infornlation science jlj. Perhaps not surprisinglyt it has since become generally recognizecl th<xt, principles of qnaritu~n mechanics, such as s~iperposition, can be i.iscd to extreme advantage iri certain types of algoritluns [2], cornnlimicatiorrs
[3. 41, cryptograpliy i5j and teleportariori protocols [GI. On the expcrimerital side, there lias been a tremendous push to i~nplement some of these ideas using various forrr~s of "hardware," iricluding t,eleportat,ion of quar~tum st,ates of the electrornag- netic field [7,
S]>
optical and microvave cavity QED 19; 101, ion traps [ll, 121,NMR
systems [13], and more recently an electronic and nuclear spin-based proposal 1141. The very sirnple fact that nseful iriformation systems usilally have outputs (wlrich rrlight be inpiits to other systknls) Inearls that any quant111~1 rnecharlical inforination system must be open to the out,side worlti ("ttic environrnerit,"). This uouid seem to compete with the requirement that such a syst,em 1nairlCain coherence, since it has been shown tlrat decoherence in an otilerxvise isoiated system can arise from couplirlg to this externai reservoir j15]. The study of such open quantum systerrls in the field of optical cavity QED has been steaclily progressing towards the poirit at, which tlicse loss rat,es to tile erivironrnerit can be suppressetl with respect to t,lre system's internal clock, even when considc:ririg tire iriteraction between irldividual cluarita. This is known as the stmny con~,pliny rccjuirerrient in tlre study of opcri qua~lturn systerris, and an appropriate set. of crit,eria, c m be irier~tifiecl for each of the experirnerltal paradigms n~entiot~ed above.
Strongly coupled txtorriic pliysics based systerr~s have had sorne overwhelmiilg r t i ccrit, successes, iricludirig creat,ion of Fock states of tire electrornagnet,ic field [16] and
QKD
rrreastrrement of iritracavity photon rii~rnber j17] in microxvave cavity QED, tile2
and cooling to the mot,ional grorintl st,ate [20. 121 in ion trap work at the single ion levell ai~tl trapping of single aton~s inside high finesse cavities i21, 22? 231 in optical cavity QIZD.
Thi: generic optical cavity QED system of a single, t~vo-level atom of excited state linewidth ?,I, strongly coupled at the Rabi frequency g to a single photon inside of a high finesse opt,icai resonator of lineu~idth n , rvm among the first candidate sysieins to be ideritifieti and exploited for quailt1111 information processing 1241. The quantnin illechanical structure of this sirnple system has been studied ext,ensively arid is described by the well-known Jaynes-Curnmi~gs Hamiltonian. The strong coupling parameter in this idealized systeni is given by g2/n?,, and experimentally ca11 now reach values rnuch greater than unity.
A
"quantum ~riecharlical processor" based on t,his atomic system will have a p h etor1 flux irko the output fielti of g"lii for the at,omic dwell time T, prompting tile identification of the optical i n f o m ~ ~ t i o n per atom of g 2 T / n 1251. The push to increase 7' forces the system to be considered fro111 the perspective of t,l~e atomic center of mass (c.nl.). Even though t,his is not a furidaxnenitally new idea, the possibility of cooling tile atomic c.m. motiorl down to riear its zero point [20, 27, 121 ~vould add a whole new diniension t,o the traditional Japes-Cummings crlergy spectrurr~ and would sig- nify a revolution in tile capabi1it:ies of such a system fr-orn a quantuin computational perspective.
The fact, that this systern can even be cortsiciered +IS a possibility for experimental
ir~vestigation is due t,o two recent r~lajor experimental advances. First, breakthrouglls in mirror coating techiiology liave allowed for rnicroresonators to be constructeci from niirrors with losscs at tile few pprrt level, while rnaint,aining a srrrall rriode volurne for large electric fields even at the single photon level. Sccontl, there have been stunning recent advances in atomic coolirig and trapping tcchnicliles, wliiclr were pioneered in pasallel by groups set:king more precision in at,o~nic clocks
1281
and. those pursuing the DosoEinstein phase trarisitiori 729, 301. Hence, there h a been the extremely fortuitous situation of sinl~~ltaneous advances for g , r, and T.3
done with atomic beatiis and Fat~ry-Perot cavities (j311 and i24j represent, the last, of this era. in the Kimntde labs), mny graduate work in I994 started with invest,igat,ions of rnicrospheres as possible rwst-gerleration resonators. They promised to deliver ultra- I-iigh Q's for long photon storage tirnes while maintairdng a large coripling g clue to tllc small nlode solume.
As a first project,, witli initial l~elp frorn I-Iideo %Iabuchi who had first st,art,ed building up serious nlicrosphcre ciq~itbilit,ies in the lab, I spent about a year building an apparatus to reproducibly fabricate high quality spheres and measure tlleir Q's at several different wavelcngt,hs. This work was done in collaboration with Vladimir Ilctienkoco, wrllo had pioneered marly of the techniques I was using and carlie for an iniense two-week visit frorn Moscow to gauge my progress. An undergraduate, Erik Streed, also spent a snnirner working with an atomic force microscope to characterize the surface rongi~ness of the spheres. I was successful a t measuring a world-record for finesse for an optical resonator, eclipsing the mark held previously (also by our group) for a Fabry-Perot geornet,ry.
Another year and a half was spent building a second apparatus t,o see some first in- dication of interaction of aton~s with these microresonators. Initially; it was thought a rnagnet,o-optical trap (~JIOT) woultl be necessary for tllis: and Nikos Georgiades worked 1vitl.1 nte to incorporate a MOT int,o a chaniber capable of housing a sphere coupling apparat,us. After Nilos g~adutlted~ a visiting scientist from Nikon Corpora- tion, Akira Furusi~~.va~ got acqnainted with cavity QED basics by helping rne continue this experiment, arid Vlaclimir again was irivaluable (luring a second two-week visit in helping t,llis experirrlerit finally see sorne initial evidence of atomic interaction. For about 3 morit,!ls: Jeff anti I worked very intensely to try t,o underst,and the experi-
rnerltal results. My experimental microsphere work is sumtnarized in two papers [32],
[33] and forrrrs t l ~ e first section of this thesis.
4
bound state structure of this potential, but for me the irrlplications turned out to be profound. It was irnmt:diately noticeable that the c.111. wavefunctions for these bound states could have structure on the sarne spatial scale as the quantized optical field, forcing orie far axmy from the situation where the aromic rriotiori coulct be considered in a billiard ball rnodel. This was studied in much more depth in a second paper 1351 in which .Jeff and I itlentifietl three separate regimes depending on t,he relevant eliergy scales in the problem. The additiori of a corifining external poter~tial for the atomic c.m. tlrrrls out to have an impact on both the usual structure of rlie .Jayues-Ciunmings states (which we called tlie "well-dressed st,ates," since tile usual "dressed stat,esn are impacted by t,l~e presence of an external poterltial well) and resulting dynamics.
A discussion of this theoretical work fornis the second past of my thesis, and serves as a very xiice introduction to the final part in which I discuss experimental work I have pursued (and coritinue to pursue) in the hopes of seeing sorne of these c.m. efbcts in the lab. I began working with Jun Ye, a post-doc in our group, in December 19'37 with the ultimate goal then of trying to trap a sirigle arom inside of one of these higll-finesse resonators. The idea behind t,his effort is that it will become absolutely esseritial for many future experir11ent.s in qual~turil inforrriation science based on cavity
QED to start with ail initial coridition of a single atom at, rest in a known positiori inside the ctlvity.
W'e were able to build somewhtrt on Hideo's precision positiori measurement work j36j; but rnudl of the existing hardware had to be rerlesigned for the purposes of an atom trapping experiment,. Sun and I were firlally successful in tile early summer of 1999 in trapping a sir~gle atom insitie of a iiigli finesse Ftxbry-Pcrot resonator using an iiitra-cavity FORT [21j. We hope that this result, and tire experimerlt,al infrastructure which is now iir place, will eriable x whole iiew gerleration of experimerits for whicll a single atom, Iocaiized iriside R high firiesse resonator, is rrtcrely t,l~e initial condi-
5
c.m. degrees of freedom using the ricli eigerlvalue structure of the well-dresseci states.
Part
I
Chapter 2 Microsphere Resonators in
Cavity
QED
2.1
The Motivation: Microspheres
as
a
Future Di-
rection
for
CQED Experiments
Slnall optical resonators witlr large cluality fact,ors Q have diverse t,echnological and scientific applications, ranging from freq~lency stabilization of semiconductor diode lasers j37] to envirorlr~rncntal sellring by trace absorpt,ion detection in cornpact, int,e grat,ed s t r ~ ~ c t u r e s 1381. Our o~vn interest in such resonators arises within t,he realm of cavity q u a n t ~ ~ x ~ l electroiiynarnics (QED) where it is necessary to simult,aneously achieve small cavity rnode voll~nnes (for large electric fields per ptioton) a ~ t d nlt,ra-low resonator losses (for long plioton storage times) [B]. In the optical domain, tliese coil- ditions lave previoi~sly been rilet orlly in small Fabry-Perot ci~vities. An at,tractive alternative are t,hc: WGMs of quartz microsphercs, as was pointed out i11 tile pioneer- ing work of Ref. [39]. These niodes can have both large coupling coefficients for the atonl-cavity irlt,eract,iori (mode volurne V
-
5 x lo3 / ~ r n ~ ) i40, 411 and extremely loxv losses [43, 441Fig. 2.1 is a farno~~s plot frorn tht: Kilnl,le group that clrrorlicles the rnarcl~ over tlie last two decad(:s to ever srrlaller parameters
where
&
is tile critical atorn nunibcr necessary t,o significantly irlfiuerlce the intra- cavity field, and ?no is tire n1111nber of photons necessary to saturate a single atorn. Note that for purely radiative decay. Ti = ~ ~ 9 1 2 ,21
Z
-
m 10.'1985 1990 1995 2000
Year
Figure 2.1: Progress in tlic critical ninr~t)ers (rno.lQ) of Eq. (2.1) for cavity QED
experirrients in the Kimble group over the last 15 years liere are for pu1,lished experiarents). Tliough tlic overaI1 trmid has lristorically been deterrrli~led by Fabry- Perot cavity t,ecl~r~ology and i:or~tini~es to he impressive, emphasized iri t,l~is plot ( A ) is tlre first report of atornic irrieractiori with rnicrosphercs of Ref. /33]. The tecl~r~ology
9
in 1997 correspond to the first publisheci reports [33] of at,ornic interaction with t,he high (2 sphere rnode at tlie level of one atom in the inode volume, whereas all other experi~tter~ts are done xvith Faltry-Perot cavities. Though tlie rriost recent Fabry-Perot, data are the result, of rriirror sispcrpolishing and ultra-low loss, ultra-high quality in- terft:rence coatings, estimates of present experin~er~tal capabilities indicate that t,ltt:se rxlurlbers vvill rcaclr sometllirrg of an upper lirnit as t,he mirror gap approaclles the or- der of R wavelength (present gaps allow 5 to 10 standing mims inside the fibry-Perot microresonators 1651). In a Rxbry-Perot cavity of length L, the couplir~g g ix L-3/4,
and the linewidth K a: L-' so that tile ratio g / ~ a: L1!4 in fact favors longer cavities.
Ho~vcver~ the requirement of strong coupling, namely g
>
y,, /c mearts that L rnustultimately he kept as small ;IS possible to continue to decrease (mo, No).
011 t,he other hand, for a microsphere of diameter D, y cc ~ - " 1 ' ~ ; and tile linewitith K cc D-n, urit11 n = 0 for absorption-limited losses and n = 112 for
surfacescattering limited linewidths (radiative losses are ignored for D/X
>
20 at a wavelength A). The dat,a to be present,ed below suggest. that n<
l j so thatg / n a ~-(11/12-n) will lncrease with decreasing sphere sizes uritil radiative Q lirnita- tions arc reaclted. This is also the same con(1itiorl on D necessary- for maximizing the coupling.
The Q factors for spheres I L S C ~ in act~zal reported cavity QED experiments (i.e.: spheres coupleci to a dipole) tend to be several orders of magnitude lower than the best
Q
factors ~.t>t s~rewn~.ed for spheres on their own. In fact, mo earl gain three orders of magnitncie if a Q of 10'' coulci 1)e nsailrtained for a 100 pm diarneter spl~ere, and even more spectacular progress co~sld be made with s~naller spheres. Actrlal experimental results rt:portcd in Refs. [45; 321 ticrrrorist,rated beautifully that experirr~ental Q fact,orscan reacli t,he irltrinsic absorption lirnit of fused silica (at 633 11111, Q =
(8
i 1) x 10" was reported). For use in cavity QED and otherwise, the microsphere WGMs axe thus worthy of irnrnediate further i~\.cstigat,ion; especially with tile possibility of evert higher Q in the near infrared (XIR), as the bulk silica allsorption coefficient falls more than fivc~fold moving fro111 600 nm to 1 prrs.1U
call~etl Whispering Gallcry ?,lodes (WGMs), and will then docurrient efforts wllicil led to a series of higli
I)
~neasuremt:rits for different xvavelengtlm in the NIR and an attempt to untlerstand the fundamental limits to bhese measurements.2.2 Whispering Gallery Modes
2.2.1
Mode
Functions
The solutiorl of the classical electronlagnetics problem for the resoriarit i~licrosphere rnode struct,iu.e is well-known ;46]. Two different polarizatioris are allowed, but the rriode splitt,ings ill the snlall spheres consitlered here are large enough (N 100 GHz)
compared to the line>r.icitl~
(5
100Pm)
to e r i s m that only one polarization is excited at ally givt:ri t,ime. The TM rnodes of electric type briefiy corlsidered here have a predornirlantly radial electric field vect,or. In polar coordinates, the TM electric field inside t,he spliere scales aswhere the tD,"hre associated Legemdrc polyrioniials and the jl are spherical Bessel functions. The field outside the spliere is given by tile above expression with ji
replaced by tile outgoing sptlerical Eankel functiorl hj". The wavevector K inside the sphere must also be repiaced by k = 2 7 i j X = K / n , with the sptlere's refi.active index.
Resonances in ttic Mie scattering coefficie~it,s are clet,ernlincd fro111 the bourldary contlitions on Maxwell's equations. For a sphere of radius a,; tlle following character- istic equatiori with p = K a applies to T M rrodes,
j 1 ( ) 1
( )
21
-
--
= - -j, ( p i P hi1; (:) P
11
the number of azirnutllal maxima. Tile WGMs are highly confined to the sphere equator arid have 1 x m, where 1 x Ka for large 1. For perfect spheres, tile modes are dege,enerat,e in nz: but a slight aspllericity is enough to cause splittings (3% asphericity gives a 10 GHz spiitting in a 100 p111 diailit:t,er spherc). For visrralizatior~, Fig. 2.2 shows a numerical calc~llation of tlie ficld radial iiependence.
distance from the sphere center [pm]
Figure 2.2: The radial ficld depemtlency for the \VGM ( q , l , 7 n ) = (1; 521,521) for a 50
p m radius splrere of index n = 1.452 at 852 nrrl ( k a = 456) . The ficld rnaxirliunl lies just inside the sphere and tlecays exponcritially outside t,lie sphere with l / e length
X / ~ T
-
120 nm at 850 IIII~.2.2.2
Radiative Quality Factors
Tht: cavit,y damping rat,c K (note, Q = aqtj2ic) can be a w e q srr~all nunlt>er and this
is orie of tlie main reasons wily rnicrosphere rcsoilators are illterestirlg for strongly
12
Numerical evaluation predicts Q,,,, values
>
lo2' for2
30 (as is typically satisfied~ I I our xvc~rk) so that radiative losses are gcncrally riot the linlitirlg factor iri deter~nining
the illtimate Q experimenttilly, as was first slloum by a nieasuremerlt of Q 8
x
lPqChapter
3
High
Q
Measurements for
Fused Silica Microspheres in the
NIR
3.1
Experimental Issues
3.1.1
Fabrication and Cleaning
14
(Zeiss Stcrni-SV11) with a fairly long working distance of 11 cm and typical 70X il~agruficatiorl was invaluable for tliis work.
sphere and ultrapure HZ and 0 2 preform
combiner
Figure 3.1: The basic apparatus for niicrosphere fabrication stlows the oxygen- hytirogen rnicrotorch and. rnetllanol doping mixture. Care had to be taken to ensure cleanliness and safety with this apparatus. In additior~! t,he highest Q m<:as?surenients had to he perforrried wit,hin 1.5 rriirlutes of fabrication due to absorption by adsorbed wat,er on t'ric sphere surface.
3.1.2 Mode Coupling and Ringdown Measurements
Both t,o exter~ti to the NIR the X'loscox~r measurement at 633 nm meritioned at~ove; and also to jrnprove our own capabilities at n~icrosphere fabricatiorr with an eye towartis an experimental cavity QED implementation, Q factors were measured at three additiorial wavelengtt~?, namely 670 rlrn, 780 rirri and 850 nm. For each of the witvelc~igtlls st utlicdl the cxcitatioii soiuce was a home- built external grating st,a'uihed rliode laser ;42j, with Siriewidtll of a few hundred kHz.
15
scatteririg, the in-coupling bearn was iriject,ed at an angle O to the sphere's equatorial plane arid an angle CJ with respect to a tangent plane at the sphere surface in order to take advant,age of tht: so-called precessirig modes 149, 501. The excit,ation geometry and apparatus are illustrated iri Figs. 3.2 (a) arid (h) for reference. This geometry,
(C3, CJ)
-
(10"; 10") typicaily necessary for efficient excitation, can also be used for n~otle identification so that a. 100 jim diarneter sphere \auld have ( q i 1,m) (1,400,385). Note that q is prirnarily determined by the "depth' angle 43 and m via the off-axis "launch" angle 0.The spheres were rnour~ted on a long silica rod wlrich was ghed to a magnetic base. This base could he rriariipulated into place quickly using a refrigerator mag- net mo11nti:d to the micro-translation stage (B~xleigh PZS-100) used to control the gap between tlie sphere and tltc coupling prism. The couplillg lensl of focal lerigth 5 mni, was a higti nunierical aperture spheric lens of ihe sort typically used for diode laser collimation. The whole alignment procedure was monitored through the st,ereomicroscope system by learning to recogriize the patt,erri of reflect,ed spot,s on the prism.
PMT
sphere
grating-
stabilized r . . . diode
threshold detector
Figure 3.2: The incoupling excitation was at an angle O to the sphere eql~atorial plane in order t o excite a precessing mode. The outcoupled light, in (a) will give a typical "transmitted" int,ensity profile. Ringtiown r~leasurerncnts in jb) used t,his Lorentzian buildup to gatc off an acou~to-optical niodulator (AOhI) as a fast shutt,er.
Anot,I~er. iniportant issue with regard to nlode co~tpling is the fact that the builili~p of light in the sphere car1 cause tllerrrlal bistability if more than a1jo11t 10 pLV of power is alloxved to circulate in a few htrrdred p111 dianletcr sphere 1481. Furtlierrnore, the Q
Q co~rtribution, and at the sarile time attenuates tlle circulating power: helping to
overcome any therrr~al prohlerus.
In Figs. 3.3 (a) - (c). t'hi: held energy as a function of tirrle is plotted for the highest Q's recorded at, the three wavelengths; corresponding to (8 i 1)
x
10%t 670 nin in a spllerc: of ciiarneter D = 750 iim. (7.5 i 1) x 1P9 at 780 nm with D = 800 Ann and (7.2 i 1)x
10"t 850 11nl for D = 680 jrm. In the case of the trvo NIRwavc:Ierlgti~, either the 670 nnl laser or a 633 nm I-Ten'e laser was overlapped for visual alignment of the incouplirlg beam spot on the prism with t,he equatorial plane of t,he sphere. Tliougll mode splittings arc seen for Q
5
5 x lo8, as reported in [51], the part,icular results report,eti here have an observed resonator energy decay well fit by cxp -tjr = exp - w t / Q : corresponcling to e x ~ i t ~ t i o n of only one eigenrnode when the light was ga,ted off.In each case; the ringdown tirne is 011 the order of a, few ps, wllich is rnuch longer than either the RC time constant of the PMT (tflically N 100 ns) or the acoustic
delay of the AOM (typically
-
10 as). These Q's were repeated in at lle~st orie other sphere for all three wavelengt,l~s. The high Q was never seen in instarlees where the sphere had coritacted the coupling prism during the process of alignment,. The highest Q's were also never seer1 in spheres below 500 pm. As documented in [15j, we also see a time dependence of the Q due to water absorption on the surface as will be cliscusseci in Sec. 3.2.2, and the data in Fig. 3.3 all correspond t o nleasurenlentsmade within 1.5 minutes of fabricat,ion of the sphere. It cert,ainly took much pract,ice and a consicieral>le amount of rrrarrual dexterity to complete the whole process in t,his aniount of time.
To make contact with otiier ~net~surenlet~ts of resonator loss, we use the cavity finesse: 3: for a free spectral rarrge corrcsporrdiiig to an additional wavelength around the sphere's circumference 153;. For (D: A) = (345 pm, 670 nrn) : 3 = 2.3 x 10' which
is the highest value yet reporred for an optical int,erferornet,er, while for
(D:
A) =(680 pm, 850 nrn) ; 3 = 2.2 x 10' (exceeding the value 3 = 1.9 x 10%t 850 nm in
time [ms] time [ms]
I
0 1 2 3 4 5 6 7
time [ms]
Figure 3.3: X,fit:rospt~i:re ri11gtio\vri rric;rsur.emerts alorlg with exponential fits. The correspoutiirig Q's inferreti via Q = w.r give (8 i 1)
x
10%t, 670 11111 with D = 750p m (a)> (7.5 i 1) x 109 at, 780 rim wit11 D = 800 p x 1 (b) arid (7.2 i- 1) x 10" at 850
19
3.2
Measurements
3.2.1 Wavelength Dependence
of
the
Q
111 Fig. 3.4. thc nieasl~ernents above art: plotted along wit11 the point from Ref. [45]
at 633 nm ~vitll D = 750 ~ 1 1 1 , which; taken together? are the highest Q's for WGMs in tire oprical domain achieved to datk Also shown in Fig. 3.4 is the expect,ed variat,io~i for Q if bulk material absorption was the limit (i.e.?
Q
,,,,,
,,
= n k l a,,,,
+,, with refractive index 71. = 1.452, k = 2.;r/X and the absorpriori coeficient a,,,,t (A) in verylow-OH fibregrade fused silica given in j55j). Although the two dat,a poinlt,s a,t (633, 670) nrn approacl~ Q,,,,,
,
t,he data at (780, 550) 11111 in tlle NIR fall substantially short.;o
[nm]
20
3.2.2
What is Limiting the Q?
Surface Roughness
One possible reason for reduceii d) is surface contaruinatiorl, althoilgli tile cleaning procedure outli~li?cl in Sec. 3.1.1 was developed t o eliniinate virtiuxlly ,111 diffuse scat- t,cririg froirl particles ori the preform surface. Furthermore, as described in Sec. 2.2.2,
t,tie limit set, by radiative losses is irrelevant for these "large" spheres with D
=->
20X.In thc al~sence of a more rigorous test of the cleaning procedure, scattering from surface inhon~ogeneities is now investigated as another candidat,e loss mechanism. Tlle forrnatioli of the sphere si~lrfacc is determined 137 the annealing history of t,he silica ball as it is wit,ildrawn from the flame and cooled. Although scanning electron microscopy (SEh'I) was initially atternptcd, high resolution atornic force microscopy
( A F M ) proved to be nluch rnorc fr~ritful in provitiing quant,it,at,ive data on the sur- face quality of the microsplieres. Surface morphology was measured in a 20 nm
x
20 nrn square grid of 256
x
256 poiritys near the sphere equator; with a nominal ver-tical resolution of 0.01 nm. Features with curvatrlre on this scale could reliably be
reco~lstruct,ed.
These data. were organized as 256 line scarls of 256 poi~lts each (i.e., heights hi
(z)
,
wit'h z ( j ) = 2Oj/256 [run], i , j = (1..
,2561 and (hi ( x ) ) ~ = 0 ) , of wilichthree typical line scaris are shown in Fig. 3.5(a). Calculating the standard deviation
LT! = (hi (z) hi ( x ) ) ~
of
surface roughness horn each line scan results in an average3 = (2.5
-+
0.7) nrn. Sirnilasly, for each line sca,nIsi
( u ) = (hi (z) hi (x+
u )j,
is cal- culated and an average correlation function R ( u ) =jRi
( 7 ~ ) ) ~ c011structed, as in Fig.3.5(b). A statistical correlat,ion lengtli of U = ( 5
-+
0.5) rtm can be identified fromthis plot. The Fourier trarisforrn P ( k ) of
R
( u ) is shown in Fig. 3.5(c) and gives the "power spectruni" of surface fliictuatior~s in reciprocal space, wiiich is correspondingly flat ola to a spat,ial frequency ko-
l / B . Though no analjlic model has heen con-structed, rtote that tile fur~ctiorial form of R ( u ) has cllaracteristics of both R, ( u )
-
! u (Pi ( k )
-
1 - W (ikj - 8 ) with ti ( b ) tlic: step fnnction) as for bandpass, ad-L I
a rantlorn telegraph signal. with the interpretation of
B
as ttlie correlation lerigth the sarrie in both cases. It was verified that an increase in the scan region to 100 nm x100 nm while accordi~igly decreasing the resolution (as set by the 256 point, sample) tlitl not affect the surface height distribution data, but did inhibit t,he extraction of
B fro111 surface correlations due to spatial undersampling.
distance along surface [nrn] histogram bins for cr [nrn]
Figure 3.5: (a) Typical line scans of surface data showing feat,ures at, 11x11 rr:solution. In (b), the dist,ributiori of riverageti surface roughrless for 256 differexit lirir: sca~ls is sl.~own: frorrr -rulich 0 = (1.7 i 0.5) nrri. (c) Correlation fi~rrctiori R (u) and (ii) estimate of it,s Fourier Transforru: the power spectral density P ( k ) , s f i o u ~ ~ ~ after averaging over 256 scans of the type in
(a)
on a 20 ri111 scliiare grid, ns explained in the text. Both support the idt:rtificrition of the correlntion length U -. 5 rlrllGiven (IT: B ) : tlie surface scattering lirnited Q , , nlust take into account precisely
exciteti here have q
<
3, a sinlple estimate may bc based upon scattering from particles of ciielectric constant E = n 2 and voluine 00'<
xX".
Such scatterers will have anabsorption cross-section scaling as (volilnlc)" (jwavele~~gtlr)" and scat,tering density proportional to (l/volume); so the effective absorption coefficient for these scatterers is
-
k 4 r B 2 . Tising the volumetric ratio .Yr/m
of a surface layer of such particlesto that of the mode, one fincis at1 effective absorptiori coeificierit which scales as k4 (02B')
/
(m)
so that,An equivalerrt expression can be derived using a different approach based on sur- face scattering from planar waveguides j56, 57, 58: by substituting t,he ratio of ex- ternal t,o internal rrtode volumes of the sphere for the ratio of external to internal guided power in the waveguide. Using (IT, R ) from above and (D, A) =
(800 pm, 800 nm)
,
we estiniate Q ,.,-
(7.5 i 5) x 10"which cornpares to themeasurernent,s wit11 (2
-
8 x log.Size Dependence of Q
In Fig. 3.6, the highest
Q
achieved as a function of D is plotted for my work with splreres at fixed X = 670 rlrn with the cavetit that the repeatability in obtainingthe "highest" Q for ix givcn D accounts for the consitlerable scatter in the data. Nevertheless; a fit .x D1I2 as sllggested by Eq. (3.1) yields nB
-
5 nm" whicli coincides we11 wit11 our aiialysis of the experimental AFM data. Though the trend in Fig. 3.6 argues for ~neasrire~rle~ints with &ill larger spheress; our fixbricat,ion technology is riot suited for D rriuc:h in excess of 1 rnrn.Water Absorption on the Surface
As in [45], il tirtre dependent rcciuction in Q is seen, with tlie ilighest C) data rneasirred
Figure 3.6: The higliest Q values measured in spheres of diameter D at 670 nrn. Tlre dependence C),, cx 0'12 is suggested by Eq. 3.1.
formed from a rod of Si02; tliere are dangling surface silicon bonds, which then undergo changes to t,heir chemistry deperiding upon the surrounding erivironment. In air, O2 ~ilolecxiles see a potential nlinirrrum xiear the silica surface and are absorbed by a physical borid with a typical time scaIe of l o 7 s. Dissociation of Oz c a i further reduce the surface energy in a process known as chemisorption, d i d 1 has a time scale of 10 s (t,he competirig clesorption process has a 350 s time scale). Hydrogen, in the forrrr of kiydroxyl radicals, then forms a cl~ernical bond wiih the oxygen wit,h a characteristic ti~rre scale of T , N 50 s, depending upon the presence of water in the air
as a hydroxyl source. This snrface water layer is ;~ssurxied t o cause the t,inle dependent light absorption (and srrbsequerit Q tlegraclat,ion) due to 0-15 bond resonances. 111 fact, for a water layer of width
6
<
X i 2 ~ occul~yir~g a frat:tion of the rota1 rnode volurnex 6jm; and absorption coefficient
P,,
(A), we estirnate24
in the 500 ilm to 900 nrn range frorn R.ef. [ G l j and
6
-
0.2 nm as appropriate for1 to 2 monolayers gives
QQ,.
-
7 x 10'' for our data point at; 670 nm with D = 750(likewise, the data of Fig. 3.6 at 670 nrn would predict
S
about an order of magnitude too largc). This estinlat,c? favors material absorptiori and silrface scattering losses a t long visible n~ar~elengtlis allti snlall At. Wo~ve~ier, there is a r a i d decrease toQ,
-
8 x lo9 at 850 nm (with D = 680 pm)> strongly suggestirig that water absorption plays a fundanientd role furt,her into the NIR. The depexlclence suggest,ed by Eq. 3.2 is also shown in Fig. 3.4.There is a real possibility t,kiat even higher Q could he recorded in a dry environ- merit as At
-.
0, as cliemical changes in t,he surface diie to oxygen alone should not causc the absorption. This immediately suggests drying of the air its a n approacll t,onmintaining high Q . At STP and a. relative humidity of 5070, there is a water vapor partial pressure of 11,500 ppm in air. Hence, I next attempted to inlple-
7 1 0 , ~
ment a dry glove box irrto tlie fabrication and memureitlent scheme, but dry nitrogen purging made it very difficillt to light tlie torch. I then iilvestigated an industrial lab- oratory gas dryer based on dehurrlidificatiorl of the Caltecl-1 compressed air line using a molecular sieve desiccant that can produce
%
<
1 ppm. This s l l o ~ ~ l d traaqla,te into a lengthening of (L) presorvat,ion in such an atmosphere frorn 100s to on the order of many hours. Such a systerri mas inst,alled, but, further work was not pursued, sinceChapter
4
Cavity
QED
with High
Q
Whispering Gallery Modes
C a ~ i t ~ . QED has proven to he a f(:rtilo arena irt whicit to study coliererit interactions bettween single atorns a,ritl p11ot~ons @2]. 1x1 t,he optical domain: the cavities eerriployed to achieve strong coupling have h e w Fabry-Pcrot microresonators with finesse
F
-
10", asin the initial work of Ref. [63! and continuing t,o the recent demo~lstratio~ls of real-time cavity QED with individual ator~zs 164, 651. By contrasti the LVGMs offi-r an alternarive avenue to strong coupling with the potential to surpays Fahry-Pcrot cavities with respect to certain key pararr1etc:rs. Fhr example, such resonators have the capability of achieving extremely lorig plroton storage lifetimes while maintaining a st,rong dipole couolixrg t,o an atomic ;401; ionic [66], or lrlolccular /G7] species via tfie small volume of a single mode? leading to the potential for ratios of coherent coupling to loss mechanisms in excess of 103.hlotivat,ed by these proxpect,s, I will now discuss measurerner~ts of the interaction of at,orns with the extiernit1 ewurescenit, field of a WGM iin a dontain in which cavity QED effects ~ C C O I I ~ C important,. More specifically, there are sigi~ficmt, modifications of cavity trarlsrnission due to the coupli~lg of
&
-
1 Cesium (Cs) atom in a thermal gas with a single resoxiantVVGX
at the level of a few pkiotons in the mode. The possibility for sensitivit,y to,V2'
N 1 at0111 in the micros@ir:re's evanescent field in tZteface of Doppler broadening of roughly 100 tirries the natural linewidth is a consequence of the uovcl features of the rriicrospheres used here, riamely small size (with radius
26
4.1
UHV
Sphere Apparatus and
Data
Acquisition
The act,ual setup is depicted in Fig. 4.1 and consists of a grating stabilized diode laser of a few hundred kHz linewidth coupled into LI microsphere via frustrated total
internal reflection from a prism [43]. Thc! microspheres, of index n = 1.432, were Eabricat,ed using t l ~ e procedure ontline in 3.1.1 arid then rriorrntcd inside the vacuum system.
grating- stabilized diode laser
saturated absorption
monitor time-averaged cavitv
I I transmission
coilimating optics
peltiel - - - - - - -
..
microspherecesium tempsrature
resewoil heatel, eervo
vacuum chamber
Figure 4.1: A simplified scl~er~:matic of the experimental setup is shown along with a det,ailed discussion in the text. Tile nlicrosphere (shown as a circle up against the prism) is surrounded by a dilute atomic vapor.
The main vacuum cl-lanlt~er is shown in Fig. 4.2 and consisted of a 5 i1tc21 square iioliow piece of fused silica mated (by Glass Inst,rnnients; Pasaderiaj to a 4 112 inch glass to rrletal corrfiat flange on one side and a 1.33 irlcli glass to rrietal "quickflange" on the other. Tlie microspllere coupling apparatus was lnoilntcd onto a rnatc11i1:mg 4 112 inch conflat flange with a port for electrical fecdti~ronglis, arid this was caref~~lly screived into tile bottom of the main chamber every t,ilne a new sphere was made. The cluickflange led to a six-way cross, from wkricii there were ports for
a
turbo roughingto 20 11s ion pump
to ion ga<@
:
i<
i<ughing pumpto cesium source:
V
stress relief bellows
'
electrical feedthroughsFigiue 4.2: Tiie va~:ui~rri c:kiarnber design for this experirncnt is sllown schernatically (not to scale). The charnher was fabricat,ed by Glass Instrurilerits (Pilsadcrra; CAI
28
The sphere was mourited close to the prisrn on a hornerrlade micrrrt,ransltLtioii stage using a specially niade vaciiunl-colllpatible piezo stack (ED0 Corporation, Salt Lake Cit,y) that had 20 prri travel for I kV of bias. It turried out to be very difficult to lriairitairl Q rnilch hig11:;r than about 1 x 10' in these experiments for several reasons. First, the sphere was inevitably burriped against the prism cluing the process of p r e aligning tile sphere on the translation stage ant1 t,he subsequent bolt,ing of the bottom flange to the main chamber. Secoridl the spheres usually xirere exposed to air for at least 30 llliriutes before thc system could be initially pumped down. Finally, typical spheres iri these experiment-s were 100 jinl diarneter or less (to keep the niode volumes small), which is much smaller tliari the sizes wit,h which the highest d) result,s of Sec. 3.2.1 had been obt,ained.
In any case, t,he range Ql -, Q2 discussed here was acccssecl by using different spheres and various rnodes of the sanle sphere; by loading the bare Q of any individual mode with the prisrn out,coupl~!r~ and by wa,iting for t,lie gradual ciegradatioii of the
Q clue to repettted cont'act of the sphere with the prism iiuririg day-to-day process of optimizing the couplirlg in vacuo. In fa,ct, it was necessary to couple to higher order WGM radial rnodes (q
-
3 - 4) in order to rllairitain an acceptable couplingeficiency, as the incoupling ieris was rrioilnted out,side the vacuum chamber. For this experiineiit,, this lens w t . ~ a doublet of focal length 14 em. In atidition, the light was inljected off of the borizortal synnnetry plane of the microsphere by an angle
O
-
10' - 15' to take advantage of the slight ellipticity of tile splicres (typically-
3 %,) and excite thc strcalled precessillg ~rnodes as clcscribc?d in 3.1.2 allowing tlre direct emission from a WGhI to he separated frorti tile reflected exciring beam and collected ordo a PMT. A single travcllirig-wave mode ( q ; l ; r n ) was t,lius exi:ited. It is degenerateordg with the counter-rotating (q, 1 , -m) rniotie, which for Q
5
5 x 10⁷ is imexcit,ed as evitfenced ci~y the al->sencc of any reso1vc:cl doiiblets in the transmitted intensity 1511.element for active temperature control. The reference potentiorrleter was used to t,-~uie a given cavity resonance w,,,,.itv to the frequency w
,,,,,,,
of the F = 4 c--. F' = 5hyperfine transit,ion of the Cs D2 line (lifetime T = 1/27 rr 32 ns, see Fig. 6.1) at
A,,,,,,, = 852 nrn, relying prinlarily upon the thermally induced change in the sphere's illdcx of refraction. Because there was no active stat-ilization of t,he cavity t,o the atotniC iine pel. se, rcsisidual drifts of the mode
--
i 500 kHz over 10 rniriutes withrespect t,o t,he atornic line were present, but could be co~npensatetl ruanudly \vit,h very little trouble. The piezucont,rolled translat,iori &age allowed fine coritrol of t,he prism-sphere distance. A picture of this completed systeni is shown in Fig. 4.3.
Figure 4.3: A close-up photograph through the quartz chamber at tile micrsophere coupling apparatus. The peltier k~eater and thermistor for the sphere temperature tuning servo are obvious, along with the rnicropositiorGng syst,em and optics.
30
atolnis/c~n", as inorlitoreti by optical absorption in t,he vapor. Urider the assumption hhat this background Cs density is a fair represeiitation of the atoinic derlsit,y in t,he eva~iescerit field, the total rrlode volume external to the sphere V,',
-
5x
10-lo cm3 iinplying that iYiT -- 1 atom in this dilute vapor interacts with the mode volurne.Thie procedure for data acquisition was to scar1 the frequerlcy 31, of rile inciderit,
laser while recording the illtelisity transmitted by the microsphere, with averaging r,inles of several rni1111tes required t,o achieve an acceptable signal-t,o-noise ratio.
h
digital storage oscilloscope (Lecroy 9400) was used for the averaging and the res~ilt- ing traces transferred to a PC for analysis. The freqliency of the incident laser is independently monitored via saturated absorption spectroscopy in a separat,e cell. For small frequency scan.: of 1 2 5 XjIHz, a second method consists of FM locking of 61it: laser to the atorrlic line !52] and freq~iericy scannirlg using a double-passed acousto-optic modulator.
4.2
Observations
As shown in Fig. 4.4 for tlie case of coincicient cavity a.nd atomic w,,,,,, res- orlarice frequencies; sub-Doppler features are clearly observed as "absorption dips" in the trarlsmission spect-run1 T ( w L ) obt,airled upon averaging tlie transrriitted cavity intensit,y for several minutes. Other scans demoilstrate that when w,:,,i,y is tuned away from a,,,,,,,, the absorptive feature in T (wI,) does not similarly sliift. It was impossible to remove the atoriis corripletely for further verification of this effect, as this v~ould have irivolved either turiirig the sphere resorrance
2
500 MNz off of the Doppler line or pumping the atorris from the vicinity of the sphere. With the present set-up, it would be irripossible t,o riiairit,aiil a coilstarit sphert:/prism gap (anti herrce, the cavity transmission) during either of these procedures.4.2.1
Q
Dependency
From data as in Fig. 4.4 over a range Q1
5
Q5
Q2; Fig. 4.5 shows the widthdetuning [MHz] detuning [MHz]
Figure 4.4: The transrnitted irittensity T ( d L ) for single WGXs is shown for (a) Q =
1.5 x 10%nd (h) Q = 4 x lo7. For tlie data of (a)* we infer from a pllenomenological rnodel [solid linel see Eq. (4.4)j that the dip widttl is driven by a set of a t o n ~ selected by the cavity geometry. As the Q increases (b). the widt,h of thc ahsorpt,ive feature narrows, suggestive of a class of atoms with small velocity. Zero detunirlg corresporlds to the comnlon atom-cavity resonance (wL = waroin = ~ , . ~ , ~ i , ~ ) . The inferred empty
cavity transmissiorl is indicaleci in (a) (dashed line).
transrrlission function, with (Au; A52) defined in Fig. 4.4. Note tlrat Ail serves as an iridirect rricasure of t,he linewidth of the empty cavity asid lieilce of Q-I via q
=
ail.
Given t,hat the Doppler I-IWI-IM in tlie Cesium vapor is A w d m / 2 ~-
190 MHz and that the data in Fig. 4.5 axe taken in a linear regime, it is perhaps surprising t,hatAv <<
Awd. This ivill be discussed extensively in Sec. 4.3.4.2.2
Intracavity Photon Number Calibration
The irnport,a~t issue of how to calaliate ilic efiticiency with which tight why coltected
irrirricdiatcly arises in ortler t,o estimate the mean riumber of pliotons in the cavity, and so calibrat,e the transmittccl iriterisity axes in Fig. 4.4. The \%'%$I linewidth proper
(HTVHM) K = K , i 6,( d ) is a suru of the iut-ririsic linexvidtll K i (due to absorption in the bulk silica, scattering l,y siufiace inliomoger~teitics, contarilinatioril etc.) and the loaded linewidth due to tire prism ti, (d) ~vh'ich deperids exponentially on the &stance
d between the sphere arid the prism as K, ( d ) = ti, (0) exp ( - . l i i r l / X ) . By morritoring
Figure 4.5: The width Av of the absorptive feature plotted against q r w,:;,,i,.,/AR (Av, AR defined in Fig. 4.4) ; where the relat,ionship of q t,o the actual mode Q is
discussed in the text.
that K / K , ( d o ) 5; the factor by which tlie intra-cavity photon riuluber would be uriderestirnated if based solely upon the power. a,t the loss channel ~netrstired (i.e.? via tlre prism at a rriean separation do
-
200 nm). Another factor of two must be irrcluded to account for the use of the precessing inodes arid the two outcoupled bearm in the prism.Operationall3: it is ensured that the data are acquired in a linear regime with measurernerit,~ of the sort shown in Fig. 4.6(a). For a specific mode with
&
-
1.5 x lo6 the depth of the absorptive feature oli resonance as a function of the trarisrriitted intensity on resonance is seen to exhibit a linear relatiori up until nt,
-
33
4.3
Model for the Interaction
The st,arting point in ari attempt to model these observations is t,he set of I-Ieisenberg equatiorfi of mot,ion for a collectio~i of moving, two-level atoms (atomic lowering operators {mj,-) velocities {vj} ailci excited state linewidth T ~coupled strongly )
(dipole coupling strcngtlls {g,}) to a sir~gle WGM (wave vector k, plioton annihilation operator a ) . In the weak-field limit, j9. 681, wit11 (a! = a i ~ n d (nj_j = ;'ij, these (:(pations can be reduccd to a co~~pletl set of equations for rlle field ilrid thc at,ornic dipoles,
1s the driving Here, n = d,,,,,+,/2Q is the cavitv ISWHM with no atoms, e e - " ~ ~ '
-
field and G,tivjrv, ; , : ~ , , I , - W L - ~ ~ . ~ , , i : , - ,,i, are the cavity and atomic detunings frorn the
driving field at
w,,.
Thc replacerneritx,
4 j"d3vd%op (v;rO) is made for atomsall with the same velocit,y distribution p (v) =
j"
d3rop (v, r,) which is assurned tobe >laxu,ell-Boltzrnann, and a ur~iform position distribution p (ro) =
j"
d3vp (v; ro) =-
;VT/J<, -= p, with p as the ato~rlic clensity and
K,,
the mode volurne. Ruthermore, taking g, ( t ) = g, (v,t+
ro),
this set of equations 4.1 car1 be reduced to the following single equation for the field.t-to
a ( t ) = - dtle-("-i6,.v.ir)ti
/
~ V ~ J W W (v) ,y ( ( I - t i ) v+
ro)(4.2)
if/ ( t c - i s ,,,it,)
Assuntirig a tirnoindepcr~der~t steady-state for the intracavity field a ( t ) = a,, and
plificd into the follo\virg foriri:
Using the mode function $ ( r ) , the atomic dipole couplir~g rate (vacuum Rabi fre- cluerlcy) for a single atom is rewrit,ten as y ( r ) = y,n,,$ (r) with g,:,, = b/3~~2r.i/4xi/, so that go = y (a) is the value at rhe surface of the sphere (though the LVGhI field m;rximum is ac:tually inside the sphere close to t,he surface ;is shown in Fig. 2.2,
t,he rrraximurn vahie accessible to the atorriic vapor, yo/27i
-
20 !vl\/IIiz, is right at the surface). The qilaritityplays the role of an effectjive susceptibility for the atornic sarnple in its interaction with the WGkL The Fomier transiorrn of the niode function,
4
(k) = ( 2 ~ ) - " i 2 d3r$ ( r ) exp (-ik. r ) (4.5)is normalizeti such that V, = j"d% j jd (k)j2 =
j"
d"r
14
(r)j2. Because it is extremely diRcult t,o evaluate ~ ( w , , ) exactly for the actual furlctions( 4
( r ) . p ( v ) ) , calculationshave been performed numerically for sirr~pliticd approxiniat,iot~ to $ ( r ) external to the rriicrosphere (e.g., $ (r)
-
exp (-ZT(T - a ) /A) exp (-82:18i) exp(im.4)
as a11 ap- proximation to J!, (rj .Y hjl' ( k r )Y;,,,
(H, 4;)). Via nurnc:rical ir~tcgratiori~ transmission35
4.3.1
Ansatz for the Three Contributions to the Susceptibil-
ity
Nonetheless, tliese calci~latioiis rrrotivate an ansats which takes
with m d
+
ivt
+
N,
=ivI.
The first, cornpor~ent in Eq. (4.6) is physically n~otivat.edby noting that there must be a Doppler-broadened response
due to velocity conlpor~ents tangential to the sphere in the direction of circulatiorl of the mode. In additioil, due to the geometry of the 'VZTG&i, there is also signific,mt transit broadening due to resicience tirnes of only 10-'r for lllotion along the radial coordi~iate to 10-'7- aloi~g tiicr Go direction (for which there is no Doppler broadelring). TfiougI~ any giver1 at,ornic trajectory will yield a colnplicated funct,iorr of both of tliese mecharlisms (as in Eq. (4.4)), in Eq. ( l . G ) , a transit broacleneti component of H'AXM
Sut/27r
-- 25 hh1Hz is simply added on; correspoi~ding to a lir~ear traject,ory of lengttiI , -- through the mode.
The solid lines through the dat,a of Fig. 4.4 are based on Eq. (4.3a) with the
nnsatz of Etl. (4.6). For Q
5
Qo, orily the first t,wo coniponerrts with fld = 0.75 i0.05 arrd
,Vt
= 0.25+
0.03 are needed in order to explain all t~aces. From t,his, it is inferred that tlie Doppler-broadened set of atoms act only as a broad ahsorber (sinceAwl
<
ti<
&,I) and that the absorptive dip at line center is accounted fort ~ y tlre width A w t ? implying tluit cavity geometry is a doniinarlt factor below Qo.
That is, the geonretry of the cavity correctly accour~ts for t,he coexistence of both transit ant1 Doppler broaciening, where of cowse the sirnplc siurl of c o n t r i b u t i o ~ ~ stlggested phcrtor~~enologicdly in Eri. (4.6) is more properly ir1tt:rpreted as an iriterplay of frequency scales as in Eq. (4.4).
atorris which respond with their natural linewidtl~ 7 (the inclusion of which does not, change the quality of the fits for Q
5
Qo). In fact, this componerit now completely determines the properties of the narrow absorptive feature since n<
(Alit, A&),). hlthougll the need for this small s ~ ~ h s e t of atoms moving sloxvly er~ougii and iri direc- tions s~~cicil that t,liey are ~ieitl~ev itppreciably Doppler- nor transit-broadeneci is thus operationally motivatedl their existeui:e is also supported within the context of other measurements near dielectric surfaces, as, for example; in the work on Doppler-free evanescent-wave spectroscopy [69].This sirriple model also allows the issue of the relationship of the qxantity q of Fig. 4.5 to the actual ernpty cavit:y Q to be addressed. For Q
5
Qo, t,he relationshipq N Q holds; with the inferred erripty cavity transmission showri as the dashed trace in Fig. 4.4(a). I-Iowever, for
(2
>
Qo, the t,wo broadly absorbing components in(*GdTd,
a)
(which account for niost of the atoms) significantly alter the lineshape relative to that inferred for the empty cavity with q 1.Q/2.5 for Q = Q2 and tile peak t,ransmissionof the cavit,y reduced by a factor w 4.5. I11 fact, within the cont,ext, of the ar~satz (Eq.
(4.6)) for
xA;
tlie si~b-nat,ural widths in Fig. 4.5 are an artifact of ho\v tliese differerit contributions (each of width2
y)
corribine t o produce T(ur,j, as shown by the solid curve in Fig. 4.4(b).Finally, the result,s of this plienornenological rriodel are summarized in Fig. 4.6(b) where the inference of the effective at,onlic susceptibility X , in Eq. (4.6) is shown. The pwanleters
(;qcl,
%;
!XTG)
= (0.75: 0.25,0.015) wl.iicli best fit tlle data across the whole-
range in Q are ilsccl. Note that
&Gc,
t 1% ,-iN,
N 1, which agrees rather nicely wit11 the ~~revious estimate bitsetl upon V: a ~ i d p. 11ite.restirigly) tlle profile of Fig. 4.6(b) bears a striking rescrnblallce t o those seeri in nltral~igh resolution trilrlsit broadening-lirniterl molecular saturation spectroscopy 1701.4.3.2
What About the Extremely Narrow
Features?
2 . .
.
Because