THE EFFECTS OF EXTENSIVE MUSICAL TRAINING ON TIME PERCEPTION REGARDING HEMISPHERIC LATERALIZATON, DIFFERENT
TIME RANGES AND GENERALIZATION TO DIFFERENT MODALITIES
Thesis submitted to the
Institute for Graduate Studies in Social Sciences in partial satisfaction of the requirements for the degree of
Master of Arts in
Cognitive Science
by Emre Sevinç
The Effects of Extensive Musical Training on Time Perception Regarding Hemispheric Lateralization, Different Time Ranges and Generalization to Different
Modalities
The thesis of Emre Sevinç has been approved by:
Prof. Dr. Reşit Canbeyli (Thesis advisor) ____________________
Prof. Dr. Cem Say _____________________
Assist. Prof. Dr. Burak Güçlü _____________________
Assist. Prof. Dr. Esra Mungan _____________________
Dr. Ayşecan Boduroğlu _____________________
Thesis Abstract
Emre Sevinç, “The Effects of Extensive Musical Training on Time Perception Regarding Hemispheric Lateralization, Different Time Ranges And Generalization
To Different Modalities”
Time perception and estimation are very important aspects of human behavior. Whether these are based on a single internal clock or the result of distributed and emergent processes in the brain is still a matter of debate. The present thesis
investigated the effects of lateralized presentation of auditory and tactile stimulation to assess whether time estimation is lateralized and affected by stimulus modality. Additionally, performances of both female and male trained musicians were
compared to those of non-musicians to evaluate the effects of gender and training in time estimation. In an identical subject design, subjects attended a time duration comparison task for short (100 to 900 milliseconds in 50 milliseconds increments with a standard stimulus of 500 msec) and long ranges (1 to 5 seconds in 250 milliseconds increments with a standard of 3000 msec) in auditory and tactile modalities. Subjects listened to pairs of sounds either monaurally or binaurally and indicated whether the two stimuli were of equal duration. Tactile (vibratory) stimuli were applied on the top of either the right or the left hand. Stimulus pairs were presented in ascending or descending order. The results suggested a gender
modality can be generalized to others. Additionally, an analysis of estimation errors compared to the standard durations (percent of error) indicated that overall
Tez Özeti
Emre Sevinç, “Kapsamlı Müzik Eğitiminin Hemisferik Yanallaşma, Farklı Zaman Erimleri ve Farklı Modalitelere Genelleştirilmesi Bakımından Zaman Algılamasına Etkileri”
Zaman algılaması ve kestirimi insan davranışının çok önemli bileşenlerinden olup beyindeki tek bir içsel saate mi dayandığı yoksa dağıtık süreçlerden mi
kaynaklandığı halen tartışma konusudur. Bu tez zaman kestiriminin uyarım modalitesi ve hemisfer yanallığına dayalı olup olmadığını değerlendirmek için yanallaşmış işitsel ve dokunsal uyarımların etkilerini inceledi. Ek olarak, cinsiyet ve eğitimin zaman kestirimindeki etkilerini değerlendirmek için eğitimli kadın ve erkek müzisyenlerin performansı müzisyen olmayanlarla karşılaştırıldı. Özdeş bir denek tasarımında, denekler, işitsel ve dokunsal olarak kısa (standart uyaran 500 milisaniye olacak şekilde 100’den 900 milisaniyeye 50 milisaniyelik artırımlarla) ve uzun (standart uyaran 3000 milisaniye olacak şekilde 1’den 5 saniyeye 250 milisaniyelik artırımlarla) süreli aralıkları içeren süreleri karşılaştırdılar. Denekler tek kulaktan (sağ ya da sol kulak) veya çift kulaktan ses çiftlerini dinleyip bunların sürelerinin aynı olup olmadığını belirttiler. Dokunsal (titreşimsel) uyaranlar sol ya da sağ elin üst kısmına uygulandı. Uyaran çiftleri artan ve azalan dizilerde sunuldu. Sonuçlar cinsiyet farklılığı göstermedi; erkeklerin zaman kestiriminde daha hassas olduğu saptandı. Cinsiyet farklılığı erkekler ve kadınlar arasındaki corpus callosum
genellenebileneceğini göstermektedir. Buna ek olarak, kestirim hatalarının standart uyaran sürelerine oranlarına dayalı (hata yüzdesi) analizleri, deneklerin
ACKNOWLEDGEMENTS
I first would like to thank my thesis supervisors, Prof. Dr. Reşit Canbeyli
and Prof. Dr. Cem Say, for their support during the preparation of this thesis. I also would like to thank Assist. Prof. Dr. Burak Güçlü for his support throughout the project. Their guidance and comments improved the scope and quality of this thesis.
I would like to thank Prof. Dr. Sumru Özsoy for the support she
had provided during my studies in the Cognitive Science Department. I also thank all faculty members contributing to the program.
Many thanks to my friend Nalan Saraç for telling me about this program in the first place. I also want to thank my friend and business partner Memduh Er for giving me the courage to apply, and supporting me during hard times. Another source of support and courage was my friend Tolga Kürkçüoğlu. My dear brother Ergin Sevinç was always there when I needed him, thanks to him, too.
CONTENTS
INTRODUCTION 1
Perception of Time --- 2
Hemispheric Communication, Lateralization and Learning of Temporal Processing5 Generalization of Temporal Processing and Search for Different Time Ranges --- 7
Gender Differences--- 8
Using Music Experience--- 9
METHOD 12 Subjects ---12
Stimuli---13
Procedure ---15
Measuring the Responses---17
RESULTS 19 Gender Differences---20
Long Range Time Estimation---23
Auditory Modality - Females ---23
Auditory Modality - Males ---28
Tactile Modality - Females ---33
Tactile Modality - Males---38
Short Range Time Estimation ---43
Auditory Modality - Females ---43
Auditory Modality - Males ---48
Tactile Modality - Females ---53
Tactile Modality - Males---58
Analyses of Percentage of Errors---63
DISCUSSION 72 Gender Differences---73
Effects of Music Training on Laterality ---74
Effects of Music Training on Time Estimation ---75
Analyses of Percentage of Errors---77
Conclusion---77
FIGURES
1. The absolute average times (in milliseconds) at which female subjects decided that the tones were of equal length for ascending and descending tone sequences. ...24 2. The absolute difference between the female subjects’ decision and the standard stimulus (3000 msec.) for ascending and descending tone sequences. ...26 3. The average of ascending and descending sequences’ absolute difference between the female subjects’ decision and the standard stimulus (3000 msec.). ...27 4. The absolute average times (in milliseconds) at which male subjects decided that the tones were of equal length for ascending and descending tone sequences. ...29 5. The absolute difference between the male subjects’ decision and the standard stimulus (3000 msec.) for ascending and descending tone sequences. ...31 6. The average of ascending and descending sequences’ absolute difference between the male subjects’ decision and the standard stimulus (3000 msec.). ...32 7. The absolute average times (in milliseconds) at which female subjects decided that the vibrations were of equal length for ascending and descending vibratory
sequences...34 8. The absolute difference between the female subjects’ decision and the standard stimulus (3000 msec.) for ascending and descending vibratory sequences. ...36 9. The average of ascending and descending sequences’ absolute difference between the female subjects’ decision and the standard stimulus (3000 msec.). Lower
numbers mean better interval time discrimination. ...37 10. The absolute average times (in milliseconds) at which male subjects decided that the vibrations were of equal length for ascending and descending vibratory
sequences...39 11. The absolute difference between the male subjects’ decision and the standard stimulus (3000 msec.) for ascending and descending vibratory sequences. ...41 12. The average of ascending and descending sequences’ absolute difference
between the male subjects’ decision and the standard stimulus (3000 msec.). Lower numbers mean better interval time discrimination. ...42 13. The absolute average times (in milliseconds) at which female subjects decided that the tones were of equal length for ascending and descending tone sequences....44 14. The absolute differences between the female subjects’ decision and the standard stimulus (500 msec.) for ascending and descending tone sequences. ...46 15. The average of ascending and descending sequences’ absolute difference
21. The average of ascending and descending sequences’ absolute difference
between the female subjects’ decision and the standard stimulus (500 msec.)...57
22. The absolute average times (in milliseconds) at which male subjects decided that the vibrations were of equal length for ascending and descending vibratory sequences...59
23. The absolute difference between the male subjects’ decision and the standard stimulus (500 msec.) for ascending and descending vibratory sequences...61
24. The average of ascending and descending sequences’ absolute difference between the male subjects’ decision and the standard stimulus (500 msec.)...62
25. Percentage of errors for auditory modality for female subjects. ...64
26. Percentage of errors for tactile modality for female subjects...66
27. Percentage of errors for auditory modality for male subjects. ...68
TABLES
1. Absolute Times for Long Range Auditory Signals in Ascending and Descending Order for Female Subjects ...24 2. Absolute Differences for Long Range Auditory Signals in Ascending and
Descending Order for Female Subjects ...26 3. The Average of the Absolute Differences for Ascending and Descending Auditory Long Range Sequences for Female Subjects ...27 4. Absolute Times for Long Range Auditory Signals in Ascending and Descending Order for Male Subjects...29 5. Absolute Differences for Long range Auditory Signals in Ascending and
Descending Order for Male Subjects...31 6. The Average of the Absolute Differences for Ascending and Descending Auditory Long Range Sequences for Male Subjects...32 7. Absolute Times for Long Range Tactile Ascending and Descending Order for Female Subjects...34 8. Absolute Differences for Long Range Tactile Ascending Order for Female
Subjects ...36 9. The Average of the Absolute Differences for Ascending and Descending Tactile Long Range Sequences for Female Subjects ...37 10. Absolute Times for Long Range Tactile Ascending and Descending Order for Male Subjects ...39 11. Absolute Differences for Long Range Tactile Ascending Order for Male Subjects
...41 12. The Average of the Absolute Differences for Ascending and Descending Tactile Long Range Sequences for Male Subjects...42 13. Absolute Times for Short Range Auditory Ascending and Descending Order for Female Subjects...44 14. Absolute Differences for Short Range Auditory Ascending and Descending Order for Female Subjects ...46 15. The Average of the Absolute Differences for Ascending and Descending
Auditory Short Range Sequences for Female Subjects ...47 16. Absolute Times for Short Range Auditory Ascending and Descending Order for Male Subjects ...49 17. Absolute Differences for Short Range Auditory Ascending and Descending Order for Male Subjects...51 18. The Average of the Absolute Differences for Ascending and Descending
24. The Average of the Absolute Differences for Ascending and Descending Tactile
Short Range Sequences for Male Subjects...62
25. Percentage of Errors for Auditory Modality for Female Subjects...64
26. Percentage of Errors for Tactile Modality for Female Subjects...66
27. Percentage of Errors for Auditory Modality for Male Subjects ...68
CHAPTER 1 INTRODUCTION
Time estimation is one of the most important aspects of human behavior in general and human cognition in particular. Since the human brain does not seem to be equipped with a high precision clock that records time intervals and compares them with the previous ones, time for us is not an accurate and absolute measure, but always an estimation of an objective physical property.
What makes the issue even more complicated is that time is not in the same category with light, sound, physical pressure, etc., all of which can be sensed and perceived directly. We have sensory organs to detect subtle changes in terms of visual, tactile or auditory stimulation; however, there is no time-sensing organ in our body, yet time estimation and discrimination are implicit in many of the tasks humans perform daily. Without timing mechanisms it is not possible to detect the location of a sound source, produce and understand speech, make music, drive an automobile, engage in sports, sleep and wake up.
of seconds to minutes. Finally, the biological clock that regulates our circadian rhythms works in the range of approximately 24 hours (Halberg & Cornélissen, 1994; Rietveld, 1996).
Perception of Time
The diversity of the phenomena of time perception in many different tasks such as sound localization, speech production and music performance has drawn a lot of interest in research since the early days of psychophysics and cognitive science. By observing performances of humans in different areas as mentioned above, it is easy to see that humans can estimate time ranges with relative accuracy. It is clear that if we could not make such estimations this would have drastic negative effect in many daily tasks including motor-control related activities. Two of the most important questions regarding time perception can be stated as “how can humans estimate time in different ranges with relative accuracy?” and “what is the source of variability in humans’ estimations of time?”
Early models of time perception tried to answer the above questions in terms of a single internal-clock hypothesis (see Grondin, 2001 for a review). It was assumed that the brain somehow had a clock mechanism such as a pacemaker-accumulator system. The pacemaker ‘module’ was responsible for emitting pulses which the accumulator collected, leading to perception of time. The accuracy and variability of timing were related to the clock frequency. Changes in the clock frequency would account for differences in time perception. Variability would be explainable by stochastic processes of the clock, e.g. by a Poisson process.
of Gibbon and Church comprises three main processes (Gibbon & Church, 1984), namely the clock process, memory process and decision processes. The clock process includes a pacemaker, a switch and an accumulator. As stated above, the pacemaker emits pulses according to some predefined frequency model and these are switched into the accumulator. The memory process is where the information from the accumulator is passed on to the working memory and then carried to the reference memory and the decision process. The final component, the decision process, includes a comparator which receives information from working memory and reference memory, compares them and produces a yes / no answer based on the equality of magnitude of time estimations from those memories.
This model was one of the important contributions to animal and human timing even though its main theme was to provide a pure mathematical model which would fit experimental data. Although there is current research to provide
neurological plausibility for this model (Matell & Meck, 2000), its assumptions of an internal clock, and a pacemaker-accumulator place a heavy practical burden because no central clock has yet been found in the brain. Since time estimation and
perception are essential to and implicit in many different tasks, it is very doubtful that a specific part of the brain is dedicated to this kind of processing.
In addition to the problems mentioned above, from an evolutionary
perspective, such a model is more in line with a predefined precise design and is not compatible with the brain's redundancy for various tasks. It also does not take into account the problem of different performance in characteristics for different time range estimations which is the case for time perception and estimation in humans.
provide a two-unit artificial network and related differential equations for the dynamics of the network. This model does not assume any internal clock, multiple oscillators or any explicit time based comparison process. Although lack of such assumptions provides strong points for the model, it still suffers from
neuropsychological plausibility. Even though the authors give a detailed
mathematical model, they do not suggest which parts or mechanisms of the human brain their model’s components would correspond to. In addition, they also suggest that at least two extra oscillators are needed for their model to be able to explain the multiple timing phenomena in which two time intervals can be independently and simultaneously timed by animals.
Fortunately these are not the only types of theories in the field of time perception and estimation research. There are population clock models and simulations that, in addition to not assuming any explicit internal clock, take into account the properties of real neuron cell assemblies (Buonomano, 2005;
Hemispheric Communication, Lateralization and Learning of Temporal Processing
The human brain is comprised of two hemispheres which are mainly connected by the corpus callosum, a large tract of nerve fibers. Even though both hemispheres seem to be symmetrical to a first approximation, there are functional and anatomical asymmetries (Hellige, 2001). For example, most human brains have a wider frontal region in the right hemisphere whereas the frontal part of the left hemisphere is narrower and its rear part, the occipital region, is slightly wider (Hellige, 2001). This anatomical asymmetry of cerebral hemispheres is sometimes called the
“counterclockwise torque” as if the brain was subjected to an angular force in the counterclockwise direction. Another anatomical asymmetry is related to the Sylvian fissure (lateral fissure) which is a boundary mark above the temporal lobe and between the frontal and parietal lobes. Generally the Sylvian fissure is longer and straighter in the left hemisphere and a bit shorter and more curved at its posterior tip in the right hemisphere (Hellige, 2001).
In addition to the anatomical asymmetries described above, there are also functional asymmetries in the brain. For example, areas related to speech production and understanding, such as Broca’s and Wernicke’s areas, are found in the left cerebral hemisphere of the brain (Hellige, 2001).
Hemispheric communication and lateralization add to the complexity of psychological time perception. Presently, there is no consistent model which
hemisphere (Elias, Bulman-Fleming, & McManus, 1999). On the other hand, there is evidence that the right hemispheric cortical networks, especially the right
dorsolateral prefrontal cortex, and the right inferior prefrontal cortex receive focus for temporal processing in the millisecond to second range (Belin, et al., 2002; Rubia and Smith, 2004). In addition, a recent visual temporal processing experiment in which a split-brain patient took part reports a clear right hemisphere advantage in processing time intervals in the range of a few milliseconds (Gazzaniga, Corballis, & Funnel, 2003). In the reported work, two experiments were conducted. In one, pairs of black circles were presented simultaneously, during half of the trials both of them stayed on the computer monitor for the same amount of time and in the other half they had different durations of visibility. In the first half, both circles stayed on the screen for 200 milliseconds. In the second half, one of the circles stayed for 200 milliseconds and the other circle stayed for less than 200 ms by 24, 36, 48, 60 or 72 milliseconds for 240 trials in total (120 for each visual field). The split-brain patient was instructed to press the keys denoting “yes” if he thought that the circles stayed for the same amount of time, or press another set of keys denoting “no” if the circles stayed on the screen for different amounts of time. The result was that the subject’s right hemisphere had an advantage and better performance than the left hemisphere in duration comparisons. Results of this research were against the view that left hemisphere was solely specialized for temporal processing. As mentioned earlier, that evidence was supportive of the idea that temporal processing which is implicit in so many different cognitive tasks cannot be localized to a region within one
hemisphere.
different modalities of temporal processing such as brief tactile stimuli. For example, when vibrations that lasted for 120 milliseconds and contained 6 msec. or 18 msec. gaps (in the middle of the vibration) were applied unilaterally to the hands of 30 first year university students, it was observed that there was a left hemisphere advantage: the left hemisphere’s brief temporal gap detection performance was better than the right hemisphere’s (Nicholls & Whelan, 1998).
Generalization of Temporal Processing and Search for Different Time Ranges
Another study also suggested that short period of practice of interval timing improved performance and this ability generalized across different modalities, hemispheres and skin locations (Nagarajan, et al., 1998). The authors trained 22 subjects for 10 to 15 days for tactile temporal interval discrimination task. Subjects were provided with two mechanical vibration pulses to their palm (thenar eminence) that were separated by a fixed amount of time and then another pair of same modality of pulses which were separated by a longer target duration. They were asked to indicate which of the pairs was separated by the target (longer) duration. Once their temporal discrimination threshold was determined, they were trained for 900 trials everyday for 10 to 15 days. After the training, it was found that the subjects were able to do the similar discrimination task for the vibrations applied to other parts of the body such as different fingers and contralateral hands. They also showed similar performances for the durations that were defined by auditory signals. However the trained subjects were not able to generalize across different temporal intervals. These results suggest that even though similar time estimation mechanisms may exist in the brain for different sensory modalities, a central internal clock model is not adequate because it does not account for such generalizations and learning of interval timing.
Gender Differences
The question “is there a difference between genders regarding time estimation?” does not have a definitive answer. First of all the issue of brain asymmetry between genders is not a settled one. This is important because if the time estimation
Even though meta analyses do not provide conclusive evidence for detailed gender based brain asymmetries (Hellige, 2001), there are data which suggest that in some conditions such as auditory signal based time estimation, there are gender differences (Dolu, et al., 2004), suggesting that males are more accurate in prospective time estimation. Another study also provides evidence for better
performance of males in time duration judgments (Loftus, et al., 1986). In addition, a review by Block, Hancock, and Zakay shows that there is some small but significant difference between genders in terms of prospective time estimation where subjects are previously informed that they would be making duration judgments (Block, Hancock, & Zakay, 2000).
There is also different evidence for hemispherical connectivity and corpus callosum differences between genders. For example a study by DeLacoste-Utamsig & Holloway provides evidence for larger splenium in the females (DeLacoste-Utamsig & Holloway, 1982). However another study by Jäncke and Steinmetz casts doubt on that evidence by failing to find evidence for significant gender differences in terms of corpus callosum shape and size (Jäncke & Steinmetz, 2003).
Thus it is reasonable to investigate the effect of gender in time estimation using different ranges, modalities and sides by having gender balanced experiment groups.
Using Music Experience
Using some aspect of temporal expertise as in extensive professional music training can shed light on important aspects of temporal processing in the human brain. Since musical temporal processing is in the range of milliseconds, people who are music experts are good candidates to investigate the models and hypotheses of time perception, cross-modal interval estimation generalization, and hemispheric lateralization.
Previous studies provide data that show that even though musical abilities such as tonal processing (both low level pitch processing and high level melodic processing) and rhythmic processing are generally located in the right hemisphere for non-musicians, extensive professional musical training leads to the left hemisphere dominance for musical processing (Bever & Chiarello, 1974). These data lead to the prediction that people who are experts in temporal processing in the range of
milliseconds must be able to do successful time discrimination judgments (in the range of tens of milliseconds to hundreds of milliseconds) for different modalities (e.g. auditory, tactile) and hemispheres. Another prediction is that, musical performance is related to the range of milliseconds and since, as stated in the previous section, that temporal processing practice does not generalize to different intervals, professional musicians are not expected to differ from non-musicians for temporal stimuli in the 1 second to 5 second range. There is also evidence suggesting that auditory temporal processing happens on two different timescales, 25-50 msec and 200-300 msec (Boemio, et al., 2005).
modalities, tactile and auditory. To investigate the potential effects of laterality, stimuli were applied to the left side and the right side of the body.
The following were the hypotheses to be tested based on the current time perception framework using the experimental task mentioned above:
1. Professional musicians (M) will perform better in temporal discrimination tasks that are in the sub-second range compared to non-musicians (NM). This means that musician’s errors are going to be smaller compared to
non-musicians in the 100 msec. to 900 msec. (with 50 msec increments) range for both auditory and tactile modalities.
2. M will be able to generalize the above temporal discrimination task to different modalities such as tactile stimulation.
CHAPTER 2 METHOD
Subjects
Two groups took part in the experiments, “musicians” (M) and “non-musicians” (NM). “Musician” meant a person who had at least seven years of musical training and one who played with an orchestra or a band. “Non-musician” meant a person who had no professional music training and did not play any musical instrument professionally or with an orchestra or a band.
Seventeen musicians and 22 non-musicians participated in the experiments. Both groups consisted of subjects who were either Boğaziçi University students or friends of the experimenter. They were either undergraduates or graduate students. The musician group consisted of 8 women and 9 men; with an average age of 24.11 years (SD = 2.95). The average years of musical experience for the group was 11 years (min. 7, max. 15 years). There were 12 guitar, 5 piano (keyboard), and 2 saxophone players in the group; some of the players were multi-instrumentalists.
The non-musician group consisted of 12 women and 10 men; with an average age of 26.77 years (SD = 2.91). Thirteen of the musicians and 18 of the
Stimuli
There were two types of stimuli: auditory sequences (auditory modality) and tactile sequences (tactile modality). The auditory sequences had pairs of auditory signals in two different ranges: R1 as the sub-second range (100 msec. to 900 msec, 500 msec. as the standard stimulus) and R2 as the supra-second range (1 to 5 seconds, 3 seconds as the standard stimulus). R1 was the range between 100 msec. and 900 msec. The standard stimulus was 500 msec. and the difference was 50 msec. (∆ = 50 msec.); ranging from 100 msec. to 900 msec. in steps of 50 msec. This range included comparison intervals such as (500, 750), (250, 500), (850, 500), etc., each including the standard stimulus in the first or the last part in a counterbalanced order. The ordering of the intervals (either ascending or descending) was in fixed order but the direction of the sequence and the slot of the standard stimulus were randomized, such as ascending (e.g. (100, 500), (150, 500), (200, 500), (500, 250), (500, 300), (350, 500), ..., ) or descending (e.g. (500, 900), (850, 500), (500, 800), (500, 750), (500, 700), (600, 500), …,). R2 was the range between 1 sec. and 5 sec. The standard stimulus was 3 sec. and the difference was 250 msec. (∆ = 250 msec.); durations ranged from 1 to 5 seconds in steps of 250 msec. This range included intervals such as (3, 4.25), (3.25, 3), (5, 3), etc., each including the standard stimulus in the first or the last part in a counterbalanced order. The ordering of the intervals (either
The auditory signal used in the auditory sequences was a pure sinusoidal tone at a frequency of 1000 Hz, a sampling frequency of 44100 Hz and an amplitude of 75 dB (SPL) heard through circumaural headphones. This signal was produced and controlled by a PC (running MATLAB 6.5 software). A window of cos2 was applied to this sinusoidal wave at the beginning (rise time = 10 milliseconds) and the end (decay time = 10 milliseconds) so that the wave slowly faded in and faded out respectively. This method was applied so the subjects of the experiment would not experience a sudden rise and an immediate cut in the signal but rather a smooth beginning and an end. This also eliminated a possible cue because otherwise subjects could have used these sudden changes as a cue since a pure sinusoidal tone, without the cos2 window applied, produced easily audible clicks at the beginning and the end of stimulation. The sound pressure level of the signal was calibrated
according to the author’s ears wearing circumaural stereo headphones (SONY MDR XD-100). The sound signal which was produced by the PC at its highest volume was passed through a low pass filter at a frequency of 10 KHz and the output was
attenuated using a programmable attenuator (Tucker Davis Technologies ZBUS System 3 PA5). The sound levels were calibrated near the tympanic membrane by using a clinical probe microphone system (ER-7C, Etymotic Research, Illinois, USA).
the start of the experiment the subjective tactile vibration threshold was measured using a two-interval forced-choice paradigm (using the TACLAB software) as described in (Güçlü & Bolanowski, 2005), and during the experiments the signal with an amplitude of 20 dB higher than the subjective tactile threshold was applied to the finger. Again a cos2 window was applied to the beginning and the end of the wave. The signal was passed through a 1 KHz filter and its output was input to the PA5 attenuator which sent the signal to the amplifier (ALESIS RA 300). The
resulting wave was sent to the V203 electro-dynamic shaker (Ling Dynamic Systems Ltd., Royston, Herts, UK). The sound of the vibrator machine was masked by white noise provided through the earphones. All of the responses of the subject were obtained by a custom made box that had two switches which sent the Yes / No answers to the computer. All of this setup was located at the Psychophysics Laboratory of Boğaziçi University Biomedical Engineering Institute.
Procedure
The central task in the experiments was to detect when a pair of signals were of equal duration. The method of limits was used to find the thresholds of the subjects’
threshold of temporal interval discrimination.
The components described above led to 10 different permutations for
musicians and non-musicians (short range auditory stimulus for left ear, right ear and both ears; short range tactile stimulus for left hand and right hand; long range
auditory stimulus for left ear, right ear and both ears, long range tactile stimulus for left hand and right hand).
right hand was chosen (for tactile stimulus), or left, right or both ears were chosen (for auditory stimulus) and then long range or short range was chosen.
The subjects were placed in a relatively sound-isolated room in the
psychophysics laboratory in Biomedical Engineering Institute. A PC equipped with required sound and vibration synthesis software was used and a set of quality and comfortable circumaural headphones that provided sound insulation was used for presenting the auditory stimuli as described above. Two ascending and two descending sequences in two different ranges R1 and R2 were randomized as described above, and played through the headphones to the left, right ear or both ears, or applied by the electro-mechanical shaker to the left hand or right hand. For each signal pair, there was a 1 second pause between the signals. Subjects made a forced choice (Yes / No) temporal judgment by pressing one of the predefined keys on the switch box to indicate whether the durations of both signals of the pair were equal or not. They were instructed to press the red button if they perceived the pair of signals as of different duration or the green button if they perceived them as of same duration. Subjects were given limited time (2 seconds) to make a judgment. If no response occurred during this trial, this was counted as no decision and the next trial started. The subject was motivated to make judgments in the allowed period by being instructed to state his or her answer as soon as he or she had seen the yellow LED lit up.
The above procedure was one element of a single block. The procedure was repeated until the subject produced a Yes (meaning both signals were perceived as of equal length) response and this completed one block of trial. Four blocks of trials were run with five seconds of breaks given between blocks. Each block was
include exactly two ascending and two descending orders. Also in order to prevent subject's counting the order and number of the intervals start of each block was offset by 1 element randomly, e.g. started with 150 msec. instead of 100 msec. (ascending) or 1.25 seconds instead of 1 second.
Measuring the Responses
A typical data set from one of the experiments (e.g. ascending auditory short range signal applied to both ears or tactile short range vibration applied to right hand) looked like the following (Y for Yes: equal durations, N for no: different durations):
(100, 500) ... (500, 250) (500, 300) (350, 500) (500, 400) (450, 500) N … N N N N Y
The point for which the ‘Yes’ answer was given marked the approximate boundary of the subject's threshold for temporal discrimination, the closer that was to the standard stimulus the better was the accuracy of making a temporal judgment, hence a lower threshold of temporal discrimination. The arithmetic mean of the non-standard stimulus at the last ‘No’ answer and the one at the ‘Yes’ answer was taken, for the above hypothetical data set the result would be (400 + 450) / 2 = 425 msec. Then the absolute difference between this number and the standard stimulus (e.g. 500 msec.) was taken to indicate how close the subject came to the standard stimulus, in this case 500 – 425 = 75 msec. This was the absolute difference for the ascending sequence. Using the same calculations the absolute difference for descending
To counterbalance the experimental conditions, the subjects were first assigned one of the modalities. If they were assigned to the auditory condition, the experiment was done for either the left or the right ear, or both ears stimulated for both the short and long range auditory sequences. If subjects were first assigned to the tactile condition, similarly short and long range tactile sequences were applied either to the left or the right side of the body (the middle finger) with a
CHAPTER 3 RESULTS
Gender Differences
A four way analysis of variance (ANOVA) with repeated measures on two factors (Gender x Group x Side x Ascending / Descending) for long range auditory condition indicated a significant difference between male and female subjects [F(1, 210) = 4.62, p = 0.03]. Male subjects were better than female subjects in the long range auditory time estimation. There was significant difference between musicians and musicians [F(1, 210) = 33.06, p < 0.001]. Musicians were better than non-musicians. There was no significant difference between sides [F(2, 210) = 0.49, p = 0.48]. There was a significant difference between ascending and descending order [F(1, 210) = 11.99, p < 0.001]. The performance of subjects was better in the ascending order. There was no interaction between gender, group, side and ordering of sequences (for Gender x Group [F(1, 210) = 0.42, p = 0.51], for Gender x Side [F(2, 210) = 1.31, p = 0.30], for Group x Side [F(2, 210) = 0.14, p = 0.71], for Gender x Ascending/Descending [F(1, 210) = 0.30, p = 0.60], for Group x Ascending/Descending [F(1, 210) = 1.31, p = 0.25], for Side x
Ascending/Descending [F(1, 210) = 2.20, p = 0.15], for Gender x Group x Side [F(2, 210) = 0.32, p = 0.57], for Gender x Group x Ascending/Descending [F(1, 210) = 2.26, p = 0.14], for Gender x Side x Ascending/Descending [F(2, 210) = 0.01, p = 0.97], for Group x Side x Ascending/Descending [F(2, 210) = 0.61, p = 0.44], for Gender x Group x Side x Ascending/Descending [F(2, 210) = 0.95, p = 0.33]).
The same type of test for long range tactile condition did not show a significant difference between genders [F(1, 134) = 1.02, p = 0.31]. There was significant difference between musicians and non-musicians [F(1, 134) = 30.23, p < 0.001]. Musicians were better than non-musicians. There was no significant
difference between ascending and descending order [F(1, 134) = 21.95, p < 0.001]. The performance of subjects was better in the ascending order. There was no interaction between gender, group, side and ordering of sequences (for Gender x Group [F(1, 134) = 0.05, p = 0.81], for Gender x Side [F(1, 134) = 1.03, p = 0.31], for Group x Side [F(1, 134) = 0.05, p = 0.82], for Gender x Ascending/Descending [F(1, 134) = 0.34, p = 0.56], for Group x Ascending/Descending [F(1, 134) = 0.04, p = 0.82], for Side x Ascending/Descending [F(1, 134) = 0.26, p = 0.61], for Gender x Group x Side [F(1, 134) = 0.99, p = 0.32], for Gender x Group x
Ascending/Descending [F(1, 134) = 0.55, p = 0.46], for Gender x Side x Ascending/Descending [F(1, 134) = 0.15, p = 0.67], for Group x Side x
Ascending/Descending [F(1, 134) = 0.25, p = 0.61], for Gender x Group x Side x Ascending/Descending [F(1, 134) = 0.72, p = 0.39]).
The same type of test for short range auditory condition indicated a significant difference between genders [F(1, 214) = 10.46, p < 0.01]. Males were better than females in the short range auditory time estimation task. There was significant difference between musicians and non-musicians [F(1, 214) = 14.61, p < 0.001]. Musicians were better than non-musicians. There was no significant
Group x Side [F(2, 214) = 0.26, p = 0.60], for Gender x Group x
Ascending/Descending [F(1, 214) = 0.001, p = 0.96], for Gender x Side x Ascending/Descending [F(2, 214) = 0.49, p = 0.48], for Group x Side x
Ascending/Descending [F(2, 214) = 0.65, p = 0.42], for Gender x Group x Side x Ascending/Descending [F(2, 214) = 0.86, p = 0.35]).
The same type of test for short range tactile condition showed no significant difference between male and female subjects [F(1, 133) = 4.35, p < 0.05]. There was no significant difference between musicians and non-musicians [F(1, 133) = 2.90, p = 0.09]. There was no significant difference between sides [F(1, 133) = 1.47, p = 0.22]. There was a significant difference between ascending and descending order [F(1, 133) = 17.04, p < 0.001]. The performance of subjects was better in the ascending order. There was no interaction between gender, group, side and ordering of sequences (for Gender x Group [F(1, 133) = 1.13, p = 0.29], for Gender x Side [F(1, 133) = 2.70, p = 0.11], for Group x Side [F(1, 133) = 1.21, p = 0.27], for Gender x Ascending/Descending [F(1, 133) = 0.03, p = 0.85], for Group x Ascending/Descending [F(1, 133) = 0.87, p = 0.35], for Side x
Long Range Time Estimation
Auditory Modality - Females
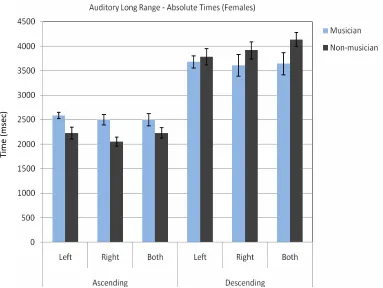
Fig. 1The absolute average times (in milliseconds) at which female subjects decided that the tones were of equal length for ascending and descending tone sequences.
Table 1.Absolute Times for Long Range Auditory Signals in Ascending and Descending Order for Female Subjects
Left SD Right SD Both SD
Ascending
Musician 2589.29 172.52 2500.00 291.24 2500.00 353.55 Non-mus. 2229.17 408.33 2052.08 326.21 2229.17 368.63 Descending
Musician 3678.57 329.59 3609.38 631.88 3640.63 635.40 Non-mus. 3781.25 571.89 3916.67 603.81 4136.36 472.54
A three way ANOVA for absolute times with repeated measures on two factors (Group x Side x Ascending/Descending) for females in the auditory long range time estimation task showed no significant difference between groups [F(1, 110) = 0.08, p = 0.78]. There was no significant difference between sides [F(2, 110) = 0.80, p = 0.37]. There was a significant difference between ascending and
T
im
e
(
m
se
descending orders [F(1, 110) = 332.05, p < 0.001]. The absolute time for ascending order was closer to the standard stimulus. There were no significant interactions between groups, sides and ascending/descending order (for group x side [F(2, 110) = 0.15, p = 0.69], for group x ascending/descending [F(1, 110) = 1.19, p = 0.16], for side x ascending/descending [F(2, 110) = 1.49, p = 0.22], for group x side x ascending/descending [F(2, 100) = 0.58, p = 0.44]).
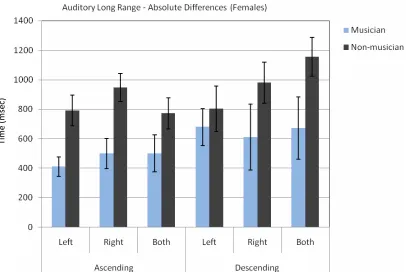
Fig. 2 shows the absolute difference between the subjects’ absolute response time and the standard stimulus for the auditory long range ascending and descending sequences. The ascending and descending sequences are given separately for left ear, right ear and both ears. Table 2 summarizes the absolute difference data for the long range auditory ascending and descending conditions (all numbers are in
Fig. 2The absolute difference between the female subjects’ decision and the standard stimulus (3000 msec.) for ascending and descending tone sequences.
Table 2.Absolute Differences for Long Range Auditory Signals in Ascending and Descending Order for Female Subjects
Left SD Right SD Both SD
Ascending
Musician 410.71 172.52 500.00 291.24 500.00 353.55 Non-mus. 791.67 362.81 947.92 326.21 770.83 368.63 Descending
Musician 678.57 329.59 609.38 631.88 671.88 597.38 Non-mus. 802.08 539.51 979.17 326.21 1156.25 455.79
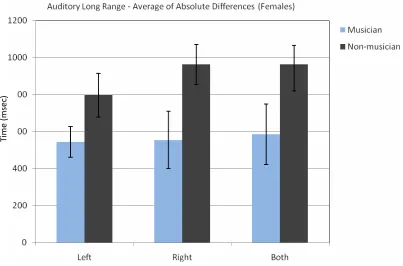
Fig. 3 shows the average of absolute differences for ascending and
descending auditory long range sequences. The averages are given separately for left ear, right ear and both ears. Table 3 summarizes the average of absolute differences for ascending and descending auditory long range sequences.
T
im
e
(
m
se
Fig. 3The average of ascending and descending sequences’ absolute difference between the female subjects’ decision and the standard stimulus (3000 msec.).
Table 3.The Average of the Absolute Differences for Ascending and Descending Auditory Long Range Sequences for Female Subjects
Left. SD Right SD Both SD
Musician 544.64 221.60 554.69 438.69 585.94 462.83 Non-mus. 796.88 412.97 963.54 376.38 963.54 355.02
A three way ANOVA for absolute differences with repeated measures on two factors (Group x Side x Ascending / Descending) for the female group indicated that there was a significant difference between musicians and non-musicians [F(1, 110) = 18.39, p < 0.001]. Absolute differences for musicians were smaller than
non-musicians. There was also significant difference for ascending / descending order [F(1, 110) = 3.98, p < 0.05]. The absolute difference for descending order was bigger. This test did not show any significant interaction between the groups, ears
T
im
e
(
m
se
and ascending or descending order (for group x side [F(2, 110) = 0.39, p = 0.53], for group x ascending/descending [F(1, 110) = 0.05, p = 0.81], for side x
ascending/descending [F(2, 110) = 1.02, p = 0.31], for group x side x ascending/descending [F(2, 110) = 1.37, p = 0.24]).
Auditory Modality - Males
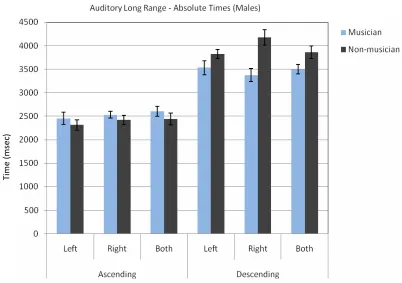
Fig. 4 The absolute average times (in milliseconds) at which male subjects decided that the tones were of equal length for ascending and descending tone sequences.
Table 4.Absolute Times for Long Range Auditory Signals in Ascending and Descending Order for Male Subjects
Left SD Right SD Both SD
Ascending
Musician 2453.13 365.58 2531.25 206.63 2607.14 283.47 Non-mus. 2312.50 354.78 2425.00 307.32 2437.50 391.98 Descending
Musician 3531.25 426.52 3375.00 400.89 3500.00 237.17 Non-mus. 3825.00 301.62 4175.00 507.58 3862.50 430.80
A three way ANOVA for absolute times with repeated measures on two factors (Group x Side x Ascending/Descending) for males in the auditory long range time estimation task showed a significant difference between groups [F(1, 100) = 4.46, p < 0.05]. Musicians were closer to the standard stimulus than non-musicians. There was no significant difference between sides [F(2, 100) = 1.19, p = 0.27]. There
T
im
e
(
m
se
was a significant difference between ascending and descending orders [F(1, 100) = 324.57, p < 0.001]. The absolute time for ascending order was closer to the standard stimulus. There were no significant interactions between groups, sides and
ascending/descending order (for group x side [F(2, 100) = 0.04, p = 0.84], for group x ascending/descending [F(1, 100) = 0.05, p = 0.88], for side x ascending/descending [F(2, 100) = 0.09, p = 0.76], for group x side x ascending/descending [F(2, 100) = 0.05, p = 0.84]).
Fig. 5 shows the absolute difference between the subjects’ absolute response time and the standard stimulus for the auditory long range ascending and descending sequences. The ascending and descending sequences are given separately for left ear, right ear and both ears. Table 5 summarizes the absolute difference data for the long range auditory ascending and descending conditions (all numbers are in
Fig. 5The absolute difference between the male subjects’ decision and the standard stimulus (3000 msec.) for ascending and descending tone sequences.
Table 5.Absolute Differences for Long range Auditory Signals in Ascending and Descending Order for Male Subjects
Left SD Right SD Both SD
Ascending
Musician 546.88 365.58 468.75 208.63 421.88 274.98 Non-mus. 687.50 354.78 575.00 307.32 562.50 391.98 Descending
Musician 531.25 426.52 437.50 320.43 625.00 365.96 Non-mus. 825.00 301.62 1175.00 507.58 862.50 430.80
Fig. 6 shows the average of absolute differences for ascending and
descending auditory long range sequences. The averages are given separately for left ear, right ear and both ears. Table 6 summarizes the average of absolute differences for ascending and descending auditory long range sequences.
T
im
e
(
m
se
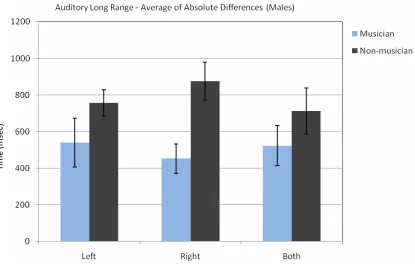
Fig. 6The average of ascending and descending sequences’ absolute difference between the male subjects’ decision and the standard stimulus (3000 msec.).
Table 6.The Average of the Absolute Differences for Ascending and Descending Auditory Long Range Sequences for Male Subjects
Left. SD Right SD Both SD
Musician 539.06 376.39 453.13 225.97 523.44 307.89 Non-mus. 756.25 227.17 875.00 325.43 712.50 398.78
A three way ANOVA for absolute differences with repeated measures on two factors (Group x Side x Ascending / Descending) for the male group indicated that there was a significant difference between musicians and non-musicians [F(1, 100) = 14.80, p < 0.001]. The absolute differences for musicians were smaller than non-musicians. There was also significant difference for ascending / descending order [F(1, 100) = 9.11, p < 0.01]. The absolute difference for the descending order was bigger than the ascending order. There was no difference for sides [F(2, 100) = 0.12, p = 0.72]. This test did not show any significant interaction between the groups, ears
T
im
e
(
m
se
and ascending or descending order (for group x side [F(1, 100) = 0.02, p = 0.87], for group x ascending/descending [F(1, 100) = 4.19, p = 0.43], for side x
ascending/descending [F(2, 100) = 1.15, p = 0.28], for group x side x ascending/descending [F(2, 100) = 0.02, p = 0.87]).
Tactile Modality - Females
Fig. 7The absolute average times (in milliseconds) at which female subjects decided that the vibrations were of equal length for ascending and descending vibratory sequences.
Table 7.Absolute Times for Long Range Tactile Ascending and Descending Order for Female Subjects
Left SD Right SD
Ascending
Musician 2468.75 339.05 2546.88 411.54 Non-mus. 2045.45 257.83 2181.82 380.64 Descending
Musician 3875.00 467.71 3839.29 562.33 Non-mus. 4062.50 438.00 4088.64 381.01
A three way ANOVA for absolute times with repeated measures on two factors (Group x Side x Ascending/Descending) for females in the tactile long range time estimation task showed no significant difference between groups [F(1, 67) = 0.10, p = 0.74]. There was no significant difference between sides [F(1, 67) = 0.41, p
T
im
e
(
m
se
= 0.52]. There was significant difference between ascending and descending orders [F(1, 67) = 331.05, p < 0.001]. The absolute time for ascending order was closer to the standard stimulus. There were no significant interactions between groups, sides and ascending/descending order (for group x side [F(1, 67) = 0.01, p = 0.89], for group x ascending/descending [F(1, 67) = 0.16, p = 0.72], for side x
ascending/descending [F(1, 67) = 0.14, p = 0.70], for group x side x ascending/descending [F(1, 67) = 0.13, p = 0.71]).
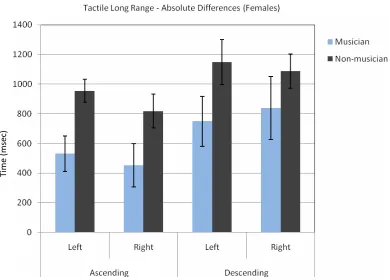
Fig. 8The absolute difference between the female subjects’ decision and the standard stimulus (3000 msec.) for ascending and descending vibratory sequences.
Table 8.Absolute Differences for Long Range Tactile Ascending Order for Female Subjects
Left SD Right SD
Ascending
Musician 531.25 339.05 453.13 411.54 Non-mus. 954.55 257.83 818.18 380.64 Descending
Musician 750.00 477.16 839.29 562.33 Non-mus. 1147.73 502.55 1088.64 381.01
Fig. 9 shows the average of absolute differences for ascending and
descending tactile long range sequences. The averages are given separately for the left hand and the right hand. Table 9 summarizes the average of absolute differences for ascending and descending auditory long range sequences.
T
im
e
(
m
se
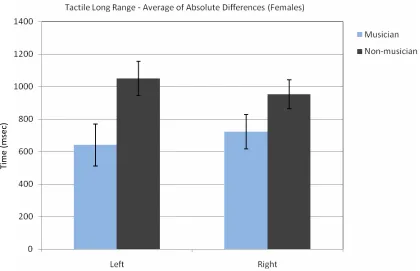
Fig. 9The average of ascending and descending sequences’ absolute difference between the female subjects’ decision and the standard stimulus (3000 msec.). Lower numbers mean better interval time discrimination.
Table 9.The Average of the Absolute Differences for Ascending and Descending Tactile Long Range Sequences for Female Subjects
Left. SD Right SD
Musician 640.63 367.10 669.64 429.56 Non-mus. 1051.14 351.13 953.41 297.60
A three way ANOVA for absolute differences with repeated measures on two factors (Group x Side x Ascending/Descending) indicated a significant difference between musicians and non-musicians [F(1, 67) = 14.04, p < 0.001]. The absolute errors for musicians were smaller than the absolute error for non-musicians. There was no significant difference between hands [F(1, 67) = 0.39, p = 0.53]. There was a significant difference for ascending / descending order [F(1, 67) = 7.27, p < 0.01]. The absolute error for descending was bigger than the one for ascending. There were
T
im
e
(
m
se
no interactions between the groups, hands and order of the sequences (for group x side [F(1, 67) = 0.25, p = 0.61], for group x ascending/descending [F(1, 67) = 0.12, p = 0.72], for side x ascending/descending [F(1, 67) = 0.35, p = 0.55], for group x side x ascending/descending [F(1, 67) = 0.05, p = 0.81]).
Tactile Modality - Males
Fig. 10 The absolute average times (in milliseconds) at which male subjects decided that the vibrations were of equal length for ascending and descending vibratory sequences.
Table 10. Absolute Times for Long Range Tactile Ascending and Descending Order for Male Subjects
Left SD Right SD
Ascending
Musician 2458.33 369.75 2618.00 276.71 Non-mus. 2150.00 332.29 2375.00 381.88 Descending
Musician 3828.13 389.24 3562.50 149.40 Non-mus. 4150.00 337.47 4125.00 493.01
A three way ANOVA for absolute times with repeated measures on two factors (Group x Side x Ascending/Descending) for males in the tactile long range time estimation task showed no significant difference between groups [F(1, 67) = 0.74, p = 0.39]. There was no significant difference between sides [F(1, 67) = 0.03, p
T
im
e
(
m
se
= 0.95]. There was significant difference between ascending and descending orders [F(1, 67) = 341.82, p < 0.001]. The absolute time for ascending order was closer to the standard stimulus. There were no significant interactions between groups, sides and ascending/descending order (for group x side [F(1, 67) = 1.11, p = 0.29], for group x ascending/descending [F(1, 67) = 1.37, p = 0.25], for side x
ascending/descending [F(1, 67) = 1.14, p = 0.63], for group x side x ascending/descending [F(1, 67) = 0.60, p = 0.44]).
Fig. 11 shows the absolute difference between the subjects’ absolute response and the standard stimulus for the tactile long range ascending and descending
Fig. 11The absolute difference between the male subjects’ decision and the standard stimulus (3000 msec.) for ascending and descending vibratory sequences.
Table 11.Absolute Differences for Long Range Tactile Ascending Order for Male Subjects
Left SD Right SD
Ascending
Musician 569.44 319.37 382.00 276.71 Non-mus. 850.00 332.29 650.00 332.29 Descending
Musician 916.67 450.69 562.50 149.40 Non-mus. 1150.00 337.47 1125.00 493.01
Fig. 12 shows the average of absolute differences for ascending and descending tactile long range sequences. The averages are given separately for the left hand and the right hand. Table 12 summarizes the average of absolute
differences for ascending and descending auditory long range sequences.
T
im
e
(
m
se
Fig. 12 The average of ascending and descending sequences’ absolute difference between the male subjects’ decision and the standard stimulus (3000 msec.). Lower numbers mean better interval time discrimination.
Table 12.The Average of the Absolute Differences for Ascending and Descending Tactile Long Range Sequences for Male Subjects
Left. SD Right SD
Musician 743.06 344.38 574.25 222.78 Non-mus. 1000.00 282.60 887.50 347.11
A three way ANOVA for absolute differences with repeated measures on two factors (Group x Side x Ascending/Descending) indicated a significant difference between musicians and non-musicians [F(1, 67) = 16.67, p < 0.001]. The absolute errors for musicians were smaller than the one for non-musicians. There was also a significant difference between hands [F(1, 67) = 5.32, p = 0.05]. The right hand had smaller absolute difference than the left hand. There was a significant difference for ascending / descending order [F(1, 67) = 16.47, p < 0.001]. The absolute difference
T
im
e
(
m
se
for descending order was bigger than the one for ascending order. There were no significant interactions between the groups, hands and order of the sequences (for group x side [F(1, 67) = 0.87, p = 0.35], for group x ascending/descending [F(1, 67) = 0.54, p = 0.46], for side x ascending/descending [F(1, 67) = 0.01, p = 0.92], for group x side x ascending/descending [F(1, 67) = 1.08, p = 0.30]).
Short Range Time Estimation
Auditory Modality - Females
Fig. 13 The absolute average times (in milliseconds) at which female subjects decided that the tones were of equal length for ascending and descending tone sequences.
Table 13.Absolute Times for Short Range Auditory Ascending and Descending Order for Female Subjects
Left SD Right SD Both SD
Ascending
Musician 371.88 50.78 396.88 58.92 385.71 24.40
Non-mus. 347.92 66.11 347.92 58.83 352.08 63.79
Descending
Musician 675.00 61.24 664.29 85.22 678.13 103.89
Non-mus. 720.83 102.71 716.67 74.87 687.50 82.92
A three way ANOVA for absolute times with repeated measures on two factors (Group x Side x Ascending/Descending) for females in the short range time estimation task showed no significant difference between groups [F(1, 112) = 0.04, p = 0.83]. There was no significant difference between sides [F(2, 112) = 0.05, p =
T
im
e
(
m
se
0.81]. There was a significant difference between ascending and descending orders [F(1, 112) = 630.27, p < 0.001]. The absolute time for ascending order was closer to the standard stimulus. There were no significant interactions between groups, sides and ascending/descending order (for group x side [F(2, 112) = 0.68, p = 0.40], for group x ascending/descending [F(1, 112) = 0.51, p = 0.33], for side x
ascending/descending [F(2, 112) = 0.61, p = 0.43], for group x side x ascending/descending [F(2, 112) = 0.22, p = 0.63]).
Fig. 14 The absolute differences between the female subjects’ decision and the standard stimulus (500 msec.) for ascending and descending tone sequences.
Table 14.Absolute Differences for Short Range Auditory Ascending and Descending Order for Female Subjects
Left SD Right SD Both SD
Ascending
Musician 128.13 50.78 103.13 58.92 103.13 38.82
Non-mus. 152,08 66.11 152.08 58.83 147.92 53.79
Descending
Musician 162.50 66.82 153.13 84.98 178.13 103.89
Non-mus. 220.83 102.71 216.67 74.87 187.50 82.92
Fig. 15 shows the average of absolute differences for ascending and
descending auditory short range sequences. The averages are given separately for left ear, right ear and both ears. Table 15 summarizes the average of absolute differences for ascending and descending auditory short range sequences.
T
im
e
(
m
se
Fig. 15 The average of ascending and descending sequences’ absolute difference between the female subjects’ decision and the standard stimulus (500 msec.).
Table 15.The Average of the Absolute Differences for Ascending and Descending Auditory Short Range Sequences for Female Subjects
Left. SD Right SD Both SD
Musician 145,31 49.97 128,13 60.78 140,63 67.40 Non-mus. 186,46 78.42 184,38 60.57 167,71 63.17
A three way ANOVA for absolute differences with repeated measures on two factors (Group x Side x Ascending/Descending) also showed that there was a
significant difference between musicians and non-musicians [F(1, 112) = 8.80, p < 0.01]. The absolute differences for musicians were smaller than the one for non-musicians. There was also significant difference between ascending and descending order [F(1, 112) = 17.28, p < 0.001]. The absolute difference for descending was bigger than the one for ascending. There was no interaction between the groups, ears,
T
im
e
(
m
se
and ascending / descending order (for group x side [F(2, 112) = 0.08, p = 0.77], for group x ascending/descending [F(1, 112) = 0.08, p = 0.78], for side x
ascending/descending [F(2, 112) = 0.01, p = 0.93], for group x side x ascending/descending [F(2, 112) = 1.45, p = 0.23]).
Auditory Modality - Males
Fig. 16 The absolute average times (in milliseconds) at which male subjects decided that the tones were of equal length for ascending and descending tone sequences.
Table 16.Absolute Times for Short Range Auditory Ascending and Descending Order for Male Subjects
Left SD Right SD Both SD
Ascending
Musician 394.44 41.04 393.75 70.39 409.38 46.17
Non-mus. 382.50 37.36 365,00 50.28 377.50 39.88
Descending
Musician 622.22 81.44 634.38 106.85 646.88 99.50
Non-mus. 647.50 75.87 675.00 71.69 690.00 87.56
A three way ANOVA for absolute times with repeated measures on two factors (Group x Side x Ascending/Descending) for males in the auditory short range time estimation task showed no significant difference between groups [F(1, 102) = 0.23, p = 0.62]. There was no significant difference between sides [F(2, 102) = 0.05,
T
im
e
(
m
se
p = 1.42]. There was a significant difference between ascending and descending orders [F(1, 102) = 416.67, p < 0.001]. The absolute time for ascending order was closer to the standard stimulus. There were no significant interactions between groups, sides and ascending/descending order (for group x side [F(2, 102) = 0.01, p = 0.97], for group x ascending/descending [F(1, 102) = 0.31, p = 0.23], for side x ascending/descending [F(2, 112) = 0.89, p = 0.34], for group x side x
ascending/descending [F(2, 112) = 0.33, p = 0.56]).
Fig. 17The absolute difference between the male subjects’ decision and the standard stimulus (500 msec.) for ascending and descending tone sequences.
Table 17. Absolute Differences for Short Range Auditory Ascending and Descending Order for Male Subjects
Left SD Right SD Both SD
Ascending
Musician 105.56 41.04 106.25 70.39 90.63 46.17
Non-mus. 117.50 37.36 135.00 50.28 122.50 39.88
Descending
Musician 122.22 81.44 134.38 106.85 146.88 99.50
Non-mus. 147.50 75.87 175.00 71.69 190.00 87.56
Fig. 18 shows the average of absolute differences for ascending and
descending auditory short range sequences. The averages are given separately for left ear, right ear and both ears. Table 18 summarizes the average of absolute differences for ascending and descending auditory short range sequences.
T
im
e
(
m
se
Fig. 18The average of the absolute differences for ascending and descending auditory short range sequences for male subjects.
Table 18.The Average of the Absolute Differences for Ascending and Descending Auditory Short Range Sequences for Male Subjects
Left SD Right SD Both SD
Musician 113.89 54.65 120.31 81.27 118.75 67.48
Non-mus. 132.50 51.44 155.00 55.03 156.25 56.90
A three way ANOVA for absolute differences with repeated measures on two factors (Group x Side x Ascending/Descending) showed that there was a significant difference between musicians and non-musicians [F(1, 102) = 5.82, p < 0.05]. The absolute differences for musicians were smaller than the one for non-musicians. There was significant difference between ascending descending order [F(1, 102) = 9.86, p < 0.01]. The absolute difference for descending order was bigger than the one for ascending order. There was no significant difference between sides [F(2, 102) =
T
im
e
(
m
se
1.13, p < 0.30]. There were no significant interactions between the groups, ears, and ascending / descending order (for group x side [F(2, 102) = 0.20, p = 0.65], for group x ascending/descending [F(2, 102) = 0.13, p = 0.71], for side x ascending/descending [F(2, 102) = 1.14, p = 0.28], for group x side x ascending/descending [F(2, 102) = 0.01, p = 0.91]).
Tactile Modality - Females
Fig. 19 The absolute average times (in milliseconds) at which female subjects decided that the vibrations were of equal length for ascending and descending vibratory sequences.
Table 19.Absolute Times for Short Range Tactile Ascending and Descending Order for Female Subjects
Left SD Right SD
Ascending
Musician 318.75 62.32 310.71 98.80
Non-mus. 300.00 68.01 309.09 76.05
Descending
Musician 740.63 87.56 771.43 74.20
Non-mus. 747.73 115.90 718.18 83.73
A three way ANOVA for absolute times with repeated measures on two factors (Group x Side x Ascending/Descending) for females in the tactile short range time estimation task showed no significant difference between groups [F(1, 66) = 0.64, p = 0.42]. There was no significant difference between sides [F(1, 66) = 0.01, p
T
im
e
(
m
se
= 0.94]. There was significant difference between ascending and descending orders [F(1, 66) = 476.18, p < 0.001]. The absolute time for ascending order was closer to the standard stimulus. There were no significant interactions between groups, sides and ascending/descending order (for group x side [F(1, 66) = 0.28, p = 0.59], for group x ascending/descending [F(1, 66) = 0.08, p = 0.87], for side x
ascending/descending [F(1, 66) = 0.03, p = 0.89], for group x side x ascending/descending [F(1, 66) = 0.91, p = 0.34]).
Fig. 20 The absolute difference between the female subjects’ decision and the standard stimulus (500 msec.) for ascending and descending vibratory sequences.
Table 20.Absolute Differences for Short range Tactile Ascending and Descending Order for Female Subjects
Left SD Right SD
Ascending
Musician 181.25 62.32 189.29 98.80
Non-mus. 200.00 68.01 190.91 76.05
Descending
Musician 240.63 87.56 271.43 74.20
Non-mus. 247.73 115.90 218.18 83.73
Fig. 21 shows the average of absolute differences for ascending and
descending tactile short range sequences. The averages are given separately for the left hand and the right hand. Table 21 summarizes the average of absolute
differences for ascending and descending tactile short range sequences.
T
im
e
(
m
se
Fig. 21 The average of ascending and descending sequences’ absolute difference between the female subjects’ decision and the standard stimulus (500 msec.).
Table 21.The Average of the Absolute Differences for Ascending and Descending Tactile Short Range Sequences for Female Subjects
Left. SD Right SD
Musician 210.94 65.95 230.36 75.30
Non-mus. 223.86 75.72 204.55 68.53
A three way ANOVA for absolute differences with repeated measures on two factors (Group x Side x Ascending/Descending) showed that there was no significant difference between musicians and non-musicians (F(1, 65) = 0.14, p = 0.71) but it showed that there was a significant difference for ascending and descending sequences [F(1, 65) = 7.02, p < 0.05]. The absolute difference for descending order was bigger than the one for ascending order. There was no significant difference between sides [F(1, 65) = 0.09, p = 0.76]. No significant interaction was found between the groups, hands and ascending / descending order (for group x side [F(1,
T
im
e
(
m
se
65) = 1.16, p = 0.29], for group x ascending/descending [F(1, 65) = 0.42, p = 0.51], for side x ascending/descending [F(1, 65) = 0.01, p = 0.92], for group x side x ascending/descending [F(1, 65) = 0.15, p = 0.69]).
Tactile Modality - Males
Fig. 22 The absolute average times (in milliseconds) at which male subjects decided that the vibrations were of equal length for ascending and descending vibratory sequences.
Table 22.Absolute Times for Short Range Tactile Ascending and Descending Order for Male Subjects
Left SD Right SD
Ascending
Musician 350,00 84.78 308,33 76.03 Non-mus. 362,50 60.38 365,00 80.10 Descending
Musician 716,67 107.53 769,44 83.65 Non-mus. 670,00 67.49 715,00 69.92
A three way ANOVA for absolute times with repeated measures on two factors (Group x Side x Ascending/Descending) for males in the tactile short range time estimation task showed no significant difference between groups [F(1, 68) = 0.19, p = 0.66]. There was no significant difference between sides [F(1, 68) = 0.69, p = 0.41]. There was significant difference between ascending and descending orders
T
im
e
(
m
se
[F(1, 68) = 411.41, p < 0.001]. The absolute time for ascending order was closer to the standard stimulus. There were no significant interactions between groups, sides and ascending/descending order (for group x side [F(1, 68) = 0.24, p = 0.61], for group x ascending/descending [F(1, 68) = 1.45, p = 0.22], for side x
ascending/descending [F(1, 68) = 1.40, p = 0.27], for group x side x ascending/descending [F(1, 66) = 0.50, p = 0.48]).