NEURAL NETWORK: COLLABORATIVE
FILTERING MODEL
Harsha Jain
Computer Science Engineering, Amity University (M.P) Gwalior, (India)
ABSTRACT
Systems are one of the business intelligence systems that provide suggestions to the active users for their items
purchase in e-commerce store. Most recommender systems use collaborative filtering (CF) or content-based or
hybrid methods to predict new items of interest for a user. Memory-based algorithms recommend according to
the preferences of nearest neighbours based on similarity, and model-based algorithms are based on
developing a model of user ratings to produce recommendations. An alternative method to collaborative
filtering recommender systems could be the use of neural networks. Neural networks have been applied to
learning tasks, such as text recognition, credit rating analysis, classification and prediction and so forth. In this
work, we present an elegant and effective framework which combines neural networks and collaborative
filtering to mine business intelligence in the form of generating recommendations. Different metrics on
real-time datasets to evaluate and compare for recommendation quality and performance have been applied. The
result from various simulations shows that the proposed system is more efficient and functional.
Keywords: Business Intelligence, Back Propagation, Clustering, Data Mining, E-Commerce,
Neural Network, Recommender System.
I. INTRODUCTION
Internet and data warehousing affects our everyday experience while searching for knowledge on a topic. To
overcome this problem, suggestions or navigation patterns from others who have more experience on the topic
is relied. Recommendation systems produce a ranked list of items on which a user might be interested, in the
context of current choice of an item [1]. These systems are developed for movies, books, communities, news,
articles etc. In general, there are five types of recommendation systems [2].They are collaborative, content
based, demographic and utility based systems.
A collaborative recommender system collects ratings of items, recognizes similarities between users based on
their ratings, and produces new recommendations based on inter-user comparisons. Content-based
recommender systems produce recommendation based on the associated features of an item: it learns a user’s
interests profile based on the features present in items that the user has rated before. A recommender system
based on demographic categorizes users based on personal attributes and finds interesting items based on
demographic classes. Utility-based systems evaluate the match between a user’s need and the set of options
available:then it recommends items based on a computation of the utility of each item for the user.
Particular user’s need. The aim of this work is to implement new neural network model for mining business
intelligence which outperform with other approaches and help in finding out the most useful information.
Neural network refers to the information processing systems or computer software system that can simulate the
structure and function of the biological brain [3]. Self-Organizing Map [4] is a kind of unsupervised learning
technique of neural networks which helps in reducing the high dimensional data into low dimensional data and
visualizes that. Based on competitive learning principles, SOM helps in clustering data together for analysis and
in clustering similar objects together. A Back-Propagation Network (BPN) is a neural network that uses a
supervised learning method and feed-forward architecture. A BPN is one of the most frequently utilized neural
network techniques for classification and prediction [5] and is considered an advanced multiple regression
analysis that can accommodate complex and non-linear data relationships [6]. It was first described by Werbos
et al. [7], and further developed by Ronald et ak,[8].
II. RELATED WORKS
This section briefly presents some of the research literature related to business intelligence recommender
systems, collaborative filtering and neural networks. Many algorithms have been proposed to generate
recommendations.
In [9] with attention to customer's profile, which is one of the important parts of a recommender system,
endeavoured to improve the customer profile and recommender system efficiency. Profile was improved using
time context and group preferences. Smoothed the elements of customer profile matrix and realized them.
A novel web usage mining approach, based on the sequence mining technique applied to user’s navigation
behaviour, to discover patterns in the navigation of websites [10]. We can apply the user’s navigation behavior records to train the BPN model. BPN model training process is highly important, since it affects the accuracy of
the IDS system.
A neural network is used to recognize implicit patterns between user profiles and items of interest, which are
then further enhanced by collaborative filtering to personalized suggestions [11]. The neural network algorithm
is trained on each user-ratings vector and a pseudo user-ratings vector is created. A pseudo user-ratings vector
contains the user’s actual ratings and neural network predictions for the unrated items. All pseudo user-ratings vectors put together form the pseudo ratings matrix, which is a full matrix.
The author [12] aim to establish a genre-based collaborative recommender system to automatically suggest and
rank a list of appropriate items (movies) to a user based on the user profile and the past voting patterns of other
users with similar tastes. The interest to the different genres is computed based on a hybrid user model. The
similarity of likeminded users according to the fuzzy distance and also Pearson correlation coefficient is
involved in a Bayesian network.
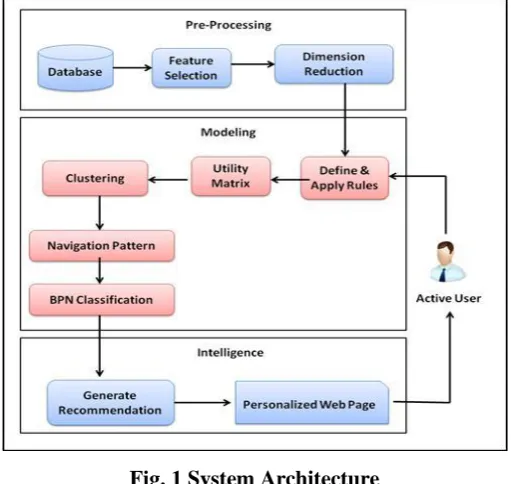
III. SYSTEM ARCHITECTURE
The proposed system architecture in this work is shown as Figure. 1. The purpose of this approach is that if
users have similar navigation patterns, then they may have similar interests for some products. For improving
competitiveness for E-commerce businesses, we built an algorithm to assess potential customer’s product
Knowledge levels and their needs, and then recommend N products to them. Thus, the approach follows the
steps to identify users’ behavioral pattern and recommends N products by using neural network learning model.
Fig. 1 System Architecture
Here the neural network is used to cluster and classify objects using SOM clustering and BPN respectively.
3.1 Methodology Description
In this method the features and users are filtered based on the knowledge of the active user such as profiles and
preferences. User item matrix is clustered using k-means clustering to identify user navigation patterns. Active
users matching cluster is identified and frequency of items purchased from the matching cluster is calculated
and sorted. The N most frequent items are listed. The items from these listed N items, which are not purchased
by the active user is recommended.
3.1.1 Pre-Processing
The data required by the process may have incorrect, irrelevant, incomplete or missing data. Erroneous data
leads to the loss of accuracy. It must be corrected or removed and missing data must be predicted. Also to
overcome the scalability problem by selection of relevant features/attributes/columns the pre-processing is
required.
Feature selection - Feature selection techniques such as step-wise forward selection, step-wise backward
elimination, combining forward selection and backward elimination can be used for selecting the relevant
features.
Dimensionality reduction - Dimensionality reduction techniques such as Principle Component Analysis (PCA),
Singular Valued Decomposition (SVD) and Decision Tree induction help overcome this problem by
transforming the original high-dimensional space into a lower-dimensionality. By selecting the relevant features
3.1.2 Model Construction
This model mainly based on the knowledge information about users profile and preferences. This knowledge
information about the user is applied in the form of rules. Users or items in the dataset are filtered based on
knowledge defined in terms of rules to identify the navigation pattern. A sample rule is in the form: (1)
(2)
These defined rules are applied on pre-processed dataset to obtain filtered relevant dataset.
Clustering - In this step the similarity between the users are calculated and similar users are grouped using
clustering technique. In general, the major clustering methods can be classified into partitioning, hierarchical,
density-based, grid based methods and model based methods. In this work model based method, especially
neural network based Self Organizing Map (SOM) is used. It clusters by mapping high dimensional data into a
2D or 3D. SOMs learn to cluster data based on similarity and topology. The basic SOM model consists of two
layers, an input layer and an output layer. When the training set is submitted to the network, the training set
values flow forward through the network to the output layer. The advantage of SOM clustering is stability and
convergence assured. The quality of this clustering can be compared with other clustering techniques for
performance evaluation.
Prediction of Best Matching Cluster (BMC) - Many classification methods have been proposed by researchers
in machine learning, pattern recognition and statistics to identify best matching of samples or objects. Neural
Network learning algorithms plays vital role in classification of objects to identify the matching classes. Several
neural network algorithms have been reported in the literature. They include various representations and
architectures and applications. Back propagation is a neural network leaning algorithm. Basically there are three
back-propagation training algorithms, Levenberg-Marquardt, Conjugate gradient and resilient back-propagation.
Resilient back-propagation algorithm is faster than the standard deepest algorithms. It requires only modest
increase in memory requirements. Also the performance of this algorithm is not very sensitive to the settings of
the training parameters. Hence in this work, resilient back propagation neural network is used to identify
matching cluster of active users.
Best matching cluster of the active user also can be calculated by finding the similarity between the active user
and clusters. The similarity of the active user is calculated with other clusters and clusters which have users with
minimum distance are identified as matching cluster. The similarity between two users is usually measured
using distance measures like Euclidean distance, Pearson correlation and cosine.
3.1.3 Intelligence
In this last phase, the recommendations are generated from matching cluster users. According to the navigation
pattern of identified cluster of users, this algorithm generates N items as recommendation. The items that have
not yet been purchased by the active user from this list is generated as final recommendation. This gives
Algorithm:
Input:
D = {s1, s2, s3,…,sns} with attributes A= {a1, a2, a3,…,anf}. // Train data
TD=AU= {s1, s2, s3,…,snts} with attributes A= {a1, a2, a3,…,antf}. //Test data
N=Potential Number of items for recommendation; The number of clusters k. Output:
A set of clusters Ck; N Recommendation List
Begin
//Phase I : Pre-processing
Feature selection ()
Dimensionality_reduction ()
//Phase II : Model Construction
//
Feature selection by formulating knowledge based rules
D`=
//Filtering of samples by formulating knowledge based rules
1 to nsr
, where ; j=1 to nss
//Clustering of users in using SOM (Self Organizing Map)
Create self organizing map by randomizing weight vectors W
Select the input
Traverse each node in the map
i. Calculate the similarity between input vector and weight vector W using Euclidean distance
ii. Find the node with smallest distance(best node)
Update the nodes weights of best node and neighbors
Repeat until converge
//Find the matching cluster of each Active User AU using BPN
Initialize all weights and biases in network
While termination condition is not satisfied
For each samples in dataset
//Propagate the inputs forward
i. For each input layer unit
ii. For each hidden or output layer unit
i. For each unit in the output layer
ii. For each unit in the hidden layers, from the last to the first hidden layer
iii. For each weight in the network
iv. For each bias in the network
Identify items of matching cluster users from
// Phase III: Generate N recommendations
Generate N recommendations for each Active User
Select top-N items
Recommend top-N items
This algorithm has been experimentally simulated and evaluated with real-time datasets with different active
users profile and preferences.
IV. EXPERIMENTAL EVALUATIONS
This section explains the method used to evaluate the performance of the proposed method. First we present the
dataset used and some measures for evaluating performance of this model. Then we present and analyze the
results of our experimentation. Active users knowledge such as user profile and preferences are consider as rules for selecting the features. Different active users profile with various types of preferences defined in terms of
rules are analysed for evaluating performance of this algorithm.
4.1 Movie Lens Dataset
MovieLens data set collected by the GroupLens Research Project is used to test the performance of this
proposed algorithm [13]. This data set consists of 100,000 ratings (1-5) from 943 users on 1682 movies. Each
user has rated at least 20 movies. The data set was converted into a user-movie matrix R that had 943 rows
(users) and 1682 columns (movies that were rated by at least one of the users).The dataset features are
normalized between 0 and 1. The dataset is divided into 80% training and 20% testing subsets. This has 5
disjoint sets with 5 fold cross validation. There are some other real-world datasets such as Jester and
e-commerce are also available on the web site for recommender systems.
4.2 Evaluation Metrics
We have evaluated the results of tests of the machine learning algorithms on the MovieLens dataset by using
evaluation metrics like Silhouette index (SI), recall, precision, and F1 Measure.
4.2.1 Clustering Evaluation Metrics
The clusters obtained using clustering techniques can be validated using various internal and external metrics.
To use external validation indexes for which a priori knowledge of dataset information is required. Internal
validity indexes do not require a priori information from dataset. Since there is no priori knowledge about the
class from the dataset in this work, external index like Silhouette Index (SI) metric is used to evaluate the
Silhouette Index (SI)
The Silhouette index [14] validates the clustering performance based on the pair wise difference of between and
within-cluster distances. In addition, the optimal cluster number is determined by maximizing the value of this
index. For a given cluster, Xj(j=1,..c), the silhouette technique assigns to the ith sample of Xj quality measure,
s(i)=(i=1,…m),known as the silhouette width[16]. This value is a confidence indicator in the member ship of the
ithsample in the cluster xjand it is defined as:
(3)
where a(i) is the average distance between the ith sample and all samples included in the same cluster Xj; b(i) is
the minimum average distance between ith sample and all samples clustered in other clusters.
4.2.2 Recommendation evaluation metrics
To evaluate recommendation we use two metrics widely used in the information retrieval (IR) community
namely recall and precision [15].
(4)
(5) The standard F1 metric that gives equal weight to recall and precision and are computed as follows:
(6) We compute F1 for each individual active user and calculate the average value to use as our metric.
V. EXPERIMENTAL RESULTS
In this section we present detailed experimental results of the proposed algorithm and compared its performance with
traditional algorithms. First the quality of clustering is analysed and validated using Silhouette Index. Second,
recommendation evaluation with precision, recall and f1 measure is presented. Finally, the results of a reasonable
comparison in the performance between the proposed method and other methods that have used the MovieLens
dataset are presented.
5.1 Clustering Quality Evaluation Results
The silhouette value for each point is a measure of how similar that point is to points in its own cluster
compared to points in other clusters, and ranges from -1 to +1.The value -1 indicates bad, 0 indicates indifferent
and 1 indicates good. The influence of various cluster number k on clustering validity is examined. The
optimum number of clusters can be determined by testing various numbers of clusters and its silhouette
measure. The figure 2 shows the comparison of SOM clustering with k-means and Fuzzy C-Means (FCM)
Fig. 2 Comparison of Different Clustering Algorithm on Quality
The SOM clustering outperformed when compared with other partition based clustering algorithms.
5.2 Recommendation Evaluation Results
Unfortunately, there is no direct analytical method to determine the optimal number of dimension so the optimal
value has to be experimentally evaluated. Figure 3 shows the result of repeated experiments with different
number of dimensions and calculated using the recall, precision and f1 measure.
Fig. 3 Number of Dimension d and f1 Measure in N Recommendation
The quality of recommendation is increased when increase in dimensions. As more and more dimensions are
increased the quality of recommendation is decreased. . Figure 4 shows the influence of number of
recommendation N ranging from 10 to 50 on Recall measure. The x-axis show the number of recommendations
Fig. 4 Number of Recommendation N vs. Recall measure
Figure 5 shows the influence of number of recommendation N on Precision measure. The x-axis show the
number of recommendations and y-axis shows the precision value.
Fig. 5 Number of Recommendation vs. Precision
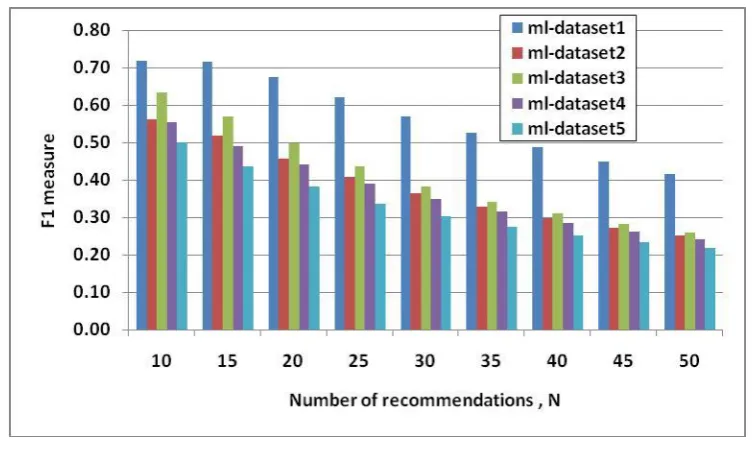
Figure 6 shows the F1 value obtained for various numbers of recommendations N. The x-axis show the number
of recommendations and y-axis shows the f1 value.
Fig. 6 Number of recommendations vs. F1 measure
The maximum mean average f1 measure is obtained in ml-dataset1 with value 0.72.This gives us 20% of
improvement in precision and 28% in f1 measure.
5.3 Evaluation with Different Recommender Systems
The proposed system is evaluated and compared with different existing recommenders systems as a
performance benchmark. The Table 1 shows the comparison of different evaluation measures recall, precision
Table 1 Recall, Precision, F1 Measures of NNBM and KBM
Evaluation
Measure Recall Precision F1Measure
k-NNBM 0.28 0.65 0.44
NNBM(SOM-
BPN) 0.73 0.85 0.72
The evaluation measure Recall, Precision and F1 Measure of k-NNBM and KBM are compared in Figure 7.
Evaluation Measures Recall, Precision and F1-Measure are show along the x-axis and value of these measures is
shown in the y-axis. The overall performance of NNBM (SOM-BPN) is better than k-NNBM method.
Fig. 7 Recall, Precision, F1 Measures of NNBM and KBM
The result from various simulations using proposed method and different existing systems is shown in figure 8.
The x-axis show the number of recommendations and y-axis shows the f1 value.
Fig. 8 Comparison of Different Recommendation Algorithms on Quality
recommender system's quality. As shown in Figure.8, the proposed knowledge filter based neural network
method performs well compared with other alternative methods [16].
VI. CONCLUSION
This proposed work is to improve the performance of mining business intelligence especially in e-commerce
recommender systems. In this paper, we presented and experimentally evaluated a new approach based on
neural networks in improving the accuracy of collaborative recommender systems by using clustering technique.
Because of the learning capability of the neural networks, this can be used to increase the capabilities of
successful recommendations. The results from various simulations using MovieLens data set shows that the
proposed algorithm performs better than other techniques. Finally, this proposed method should be tested on
other real-world datasets with different density and sparsity levels.
REFERENCES
[1]. Amit Kumar Nandanwar, Geetika S. Pandey, Content based recommendation system using SOM and
Latent Dirichlet Allocation Model, (IJCSIT) International Journal of Computer Science and Information
Technologies, Vol. 3 (3) , 2012,4210-4215.
[2]. Huihong Zhou, Yijun Liu, Weiqing Zhang, and Junyuan Xie. “A Survey of Recommender System
Applied in E-commerce”. Computer Application Research, 1(1): 8-12, 2004.
[3]. Smita.Nirkhi, Potential use of Artificial Neural Network in Data Mining, IEEE 2010.
[4]. Paola Britos, Damián Martinelli, Hernan Merlino, Ramón García-Martínez ,Web Usage Mining Using
Self Organized Maps, IJCSNS International Journal of Computer Science and Network Security, VOL.7
No.6, June 2007.
[5]. Wu, D., Yang, Z., & Liang, L. (2006). Using DEA-neural network approach to evaluate branch efficiency
of a large Canadian bank. Expert Systems with Applications, 31,108–115.
[6]. Jost, A. (1993). Neural networks: A logical progression in credit and marketing decision system. Credit
World, 81(4), 26–33.
[7]. Werbos, P. (1974). Beyond regression: New tools for prediction and analysis in the behavioral science.
Ph.D. dissertation, Committee on Applied Mathematics, Harvard University, Cambridge, MA.
[8]. Ronald, J. W., Rumelhart, D. E., & Hinton, G. E. (1986). Learning internal representations by error
propagation, Parallel distributed processing: Explorations in the microstructure of cognition (Vol. 1).
Cambridge: MIT Press/Bradford Books.
[9]. Pao-Hua Chou , Pi-Hsiang Li , Kuang-Ku Chen, Menq-Jiun Wua, Integrating web mining and neural
network for personalized e-commerce automatic service, Expert Systems with Applications 37 (2010)
2898–2910.
[10]. Ronald, J. W., Rumelhart, D. E., & Hinton, G. E. (1986). Learning internal representations by error
propagation, Parallel distributed processing: Explorations in the microstructure of cognition (Vol. 1).
Cambridge: MIT Press/Bradford Books.
[11]. D. Billsus and M. “Learning collaborative information filter.” In Proceeding 5th International conference
[12]. Smita Krishna Pati,Yogita Deepak Mane,Kanchan Rufus Dabre. An Efficient Recommender System
using Collaborative Filtering Methods with K-separability Approach, International Journal of
Engineering Research and Applications (IJERA) ISSN: 2248-9622,pp30-35.(2012).
[13]. MovieLens data set: http://www.movielens.umn.edu.
[14]. P. Rousseeuw (1987), “Silhouettes: a graphical aid to the interpretation and validation of cluster
analysis,” J. Comput. Appl. Math., vol. 20, no. 1, pp. 53–65.
[15]. Badrul Sarwar, George Karypis, Joseph Konstan, and John Riedl, Analysis of Recommendation
Algorithms for Ecommerce,ACM,EC’00,October 17-20,(2000).
[16]. Mohammad Julashokri, Mohammad Fathian, Mohammad Reza Gholamian and Ahmad Mehrbod,
Improving electronic customers' profile in recommender systems using data mining techniques,