Visual Processing in Adolescents Born Extremely Low
Birth Weight and/or Extremely Preterm
WHAT’S KNOWN ON THIS SUBJECT: Data available before the 1990s in addition to small studies with clinical populations have shown that ocular growth and development differ between extremely preterm and term-born children.
WHAT THIS STUDY ADDS: Contemporary data on long-term visual outcomes indicate that adolescents born extremely low birth weight and/or extremely preterm exhibit more visual sensory and perceptual morbidity than adolescents born at term.
abstract
BACKGROUND AND OBJECTIVES:Ocular growth and development dif-fers between preterm and term-born infants and may cause long-term negative consequences for visual function, but contemporary data on long-term visual outcomes in representative samples of the highest risk extremely low birth weight (ELBW,,1000 g birth weight)
or extremely preterm (EP, ,28 weeks’ gestation) survivors are
lacking. Our objective was to compare visual functioning between
ELBW/EP and normal birth weight (NBW, .2499 g birth weight)
control adolescents.
METHODS:Geographically determined cohort study of 228 consecutive ELBW/EP survivors born in the state of Victoria in 1991 and 1992, and 166 randomly selected NBW controls assessed between 14 and 20 years of age. Visual acuity, stereopsis, convergence, color perception, and visual perception were assessed and contrasted between groups. RESULTS:ELBW/EP subjects had significantly worse visual acuity with habitual correction in both the left and right eyes, and for the best eye (P,.001). The ELBW/EP adolescents also exhibited poorer stereopsis, odds ratio (OR) 3.22 (95% confidence interval [CI] 1.78 to 5.84), and convergence, OR 2.76 (CI 1.32 to 5.75) than controls, and more problems with visual perception, OR 3.09 (CI 1.67 to 5.71) after habitual correction.
CONCLUSIONS:Despite advances in medical care improving the sur-vival rate of high-risk ELBW/EP infants, visual morbidity is still relatively high compared with controls in late adolescence.Pediatrics2013;132: e704–e712
AUTHORS:Carly S. Molloy, PhD,a,bMichelle Wilson-Ching,
PhD,a,bVicki A. Anderson, PhD,a,cGehan Roberts, MD,b,d
Peter J. Anderson, PhD,a,cand Lex W. Doyle, MD,a,b,cfor the
Victorian Infant Collaborative Study Group
aCritical Care and Neurosciences, Murdoch Childrens Research
Institute, Melbourne, Australia;bNeonatal Medicine, Royal
Women’s Hospital, Melbourne, Australia;cUniversity of
Melbourne; anddThe Royal Children’s Hospital, Melbourne,
Australia
KEY WORDS
extremely low birth weight, extremely preterm, visual acuity, visual processing, visual perception
ABBREVIATIONS
CI—95% confidence interval ELBW—extremely low birth weight EP—extremely preterm
NBW—normal birth weight OR—odds ratio
ROP—retinopathy of prematurity
TVPS-3—Test of Visual Perceptual Skills, 3rd Edition
Dr Molloy conceptualized and designed the study, performed data acquisition, drafted the initial manuscript, performed data analysis and interpretation, and approved thefinal manuscript as submitted; Dr Wilson-Ching was involved in the
conceptualization and design of the study, performed data acquisition and interpretation of data, reviewed and revised the manuscript, and approved thefinal manuscript as submitted; Dr V. Anderson was involved in the conceptualization and design of the study and interpretation of data, reviewed and revised the manuscript, provided supervision, and approved thefinal manuscript as submitted; Dr Roberts was involved in the interpretation of data, reviewed and revised the manuscript, provided administrative and technical support, and approved thefinal manuscript as submitted; and Drs P. Anderson and Doyle were involved in the conceptualization and design of the study and interpretation of data, provided supervision, reviewed and revised the manuscript, provided administrative and technical support, and approved thefinal manuscript as submitted.
www.pediatrics.org/cgi/doi/10.1542/peds.2013-0040
doi:10.1542/peds.2013-0040
Accepted for publication May 31, 2013
Address correspondence to Carly Molloy, PhD, Critical Care and Neurosciences, Murdoch Childrens Research Institute, Flemington Road, Parkville, VIC 3052, Australia. E-mail: carly. [email protected]
Ocular growth and development differ between extremely low birth weight
(ELBW,,1000 g) or extremely preterm
(EP, gestational age ,28 weeks) and
term children and may have long-term
negative consequences for visual
function.1Although past research has
reported that preterm children have higher rates of a range of visual ab-normalities,2–6 lacking are studies
examining visual function in represen-tative samples of ELBW/EP children born since the early 1990s when im-portant advances in medical care were introduced and survival rates of the most immature and vulnerable infants rose dramatically.
Visual sensory and perceptual skills are important for a range of functions and everyday activities, such as classroom learning, overall school performance,6–9
successful social interaction, and so-cial cognition.10–12 Consequently,
un-derstanding the nature and frequency of visual deficits in ELBW/EP children is vital to inform adequate and ap-propriately targeted clinical follow-up and to increase focus on developing avenues for remediation.
Infants born ELBW/EP are susceptible to retinopathy of prematurity (ROP), and
∼5% to 10% exhibit severe brain
pa-thology, particularly within the periven-tricular white matter.13–15These perinatal
insults have been identified as risk
factors for poor visual outcome.2,16–20
The aim of this study was to compare visual functioning between ELBW/EP
and normal birth weight (NBW,.2499
g birth weight) control adolescents. It was hypothesized that ELBW/EP ado-lescents would have higher rates of
visual abnormalities in all areas
assessed compared with controls.
METHODS
Participants
The subjects were derived from a geo-graphic cohort study of all 298 surviving
ELBW or EP children born between January 1991 and December 1992,
in-clusive, in the state of Victoria,
Australia. The control cohort, enrolled at birth, comprised 262 randomly se-lected NBW infants. These cohorts have had extensive evaluations at 2,21,225,23
and 824 years of age; none of these
assessments included formal assess-ments of visual functioning, apart from visual acuity.
Written informed consent was obtained from parents of adolescents, and from the participants themselves, if they were able to provide consent. The study was approved by the Human Research Ethics Committees of the participating hospitals.
Outcome Measures
Participants were assessed between 14 and 20 years of age by a trained examiner who was blind to group membership. Visual functions were mea-sured with habitual correction (eg, glasses). Parents were asked to re-port on diagnosed visual problems, but precise refractive error data were unavailable.
Sensory
(a) Visual Acuity: The 3m Early Treatment Diabetic Retinopathy Study (ETDRS) logMAR chart test25was used to assess
visual acuity; scoring was per letter. The ETDRS logMAR chart is sensitive to the most common sources of visual im-pairment, such as refractive error, cataract, macular disease, and
ambly-opia.26 Visual acuity was measured
monocularly (ie, left and right eyes were assessed separately). As is commonly
used, logMAR equivalent scores,0.20
(Snellen equivalent 6/9) were consid-ered normal6,9,16,27 and participants
with logMAR$0.2 were determined to
be clinically impaired.
(b) Stereopsis (binocular depth per-ception): Stereopsis was assessed by the Randot Stereotest.28The test plates
viewed through polarized spectacles can identify retinal disparities ranging between 20 and 500 seconds of arc;
resolution #70 seconds of arc was
considered normal.29
(c) Convergence: Convergence was assessed with the Prentice card, and
a “dissociating prism” was used to
create vertical double vision (of a ruler, split into 2 halves with numbers and an arrow over the zero or midway point). Adolescents were asked to name the number to which the arrow appeared to point. Abnormal convergence was defined as a near point of convergence
.7 cm.30
(d) Color Perception: The Ishihara Color Perception Test was used to assess color vision; it is good for detecting red-green color vision deficiency with high sensitivity and specificity, and it can perform acceptably even with poor
il-lumination.31 The incidence of
red-green color blindness in Australia is
∼5% to 8% of males and 0.4% of
females.31–34 Three or more errors
out of 14 plates were considered ab-normal.
Visual Perception:
Five subtests from the Test of Visual Perceptual Skills, Third Edition (TVPS-3) were administered.35,36
1. Visual discrimination: Assessed
ability to distinguish 1 object from another.
2. Visual-spatial relationships: Assessed ability to identify 1 item that was dif-ferent from remaining items in terms of direction/orientation.
3. Form constancy: Participants se-lected the item that included the same shape as the reference item;
size and/or spatial orientation
varies.
4. Visual figure-ground: Participants
5. Visual closure: Participants se-lected the item that would match the reference item if all lines on the picture were connected.36
Each scale is age standardized with a normative mean of 10 (SD 3), with higher scores indicative of better per-formance; the upper age band of 18 years, 11 months was used for all subjects aged.19 years.
The raw scores of these 5 subtests were summed to form an overall visual ceptual score. To classify visual per-ceptual impairment we used a cut-off equivalent to the 10th percentile of the
control group, therefore scores #28
were considered clinically impaired.
General Intellectual Function
The Wechsler Abbreviated Scale of In-telligence assessed general intellectual function.37
Statistical Analysis
Between-group differences (ELBW/EP versus control) for dichotomous
out-come data were analyzed byx2
analy-sis and for continuous data byttests,
or Mann-Whitney U test for skewed
data. Rates of impairment across the sensory and visual perceptual mea-sures were compared between groups. Two dichotomous variables were created to depict the number of ado-lescents with 1 or more visual impair-ments and for those with 2 or more impairments across multiple areas. In ELBW/EP adolescents the effects of
severe ROP (stage 3 or higher) and se-vere brain injury on cranial ultrasound
(cystic periventricular leukomalacia
and/or grade 3 or 4 intraventricular hemorrhage) on the likelihood that ELBW/EP adolescents would have im-paired visual acuity, stereopsis, conver-gence, or color vision were assessed by logistic regression.
RESULTS
Two hundred and twenty-eight (76.5%) ELBW/EP and 166 (63.4%) control ado-lescents participated. The mean age at follow-up for the ELBW/EP group was 17.0 years (SD, 1.5; range, 14.3–20.0 years) and 17.4 years (SD, 1.6; range, 14.4–20.2) for the control group. Fig-ure 1 details the reasons for non-participation.
There were no significant differences between ELBW/EP participants and nonparticipants in perinatal variables except that nonparticipating ELBW/EP adolescents had higher rates of cystic periventricular leukomalacia (Table 1). When assessed at 8 years, nonpar-ticipants were more likely to be legally blind or deaf.38There were no
differ-ences between control participants
and nonparticipants, except there
were more female participants (56.6% vs 44.3%).
Sensory Outcomes
Five individuals from both groups did not complete the visual assessment
owing to unavailability of equipment. Of the 223 ELBW/EP adolescents who attempted the visual assessment, 12 (5.4%) were too visually impaired to complete the test of visual acuity, whereas 2 were too impaired due to cerebral palsy, and 1 due to autism. A similar proportion of control adoles-cents were too visually impaired to complete the test of visually acuity, 8 (5%), whereas 2 had neurosensory disability and were unable to under-stand the task. Vision was subsequently classified as impaired and scores were not imputed for group comparisons. More ELBW/EP adolescents wore cor-rective eyewear than controls, but this did not reach statistical significance (31.7% vs 23.6%). Other ophthalmo-logic details, as reported by the par-ticipant’s parent, were for the ELBW/ EP group: any refractive error 14 (6.3%), strabismus 2 (1%), and astigmatism 2 (1%); and for the NBW group: any re-fractive error 8 (5%) and astigmatism 1 (0.6%).
The ELBW/EP group had a worse (higher) median acuity and a greater spread of values for logMAR visual acuities of left, right, and score in the better eye after habitual correction (Fig 2). Of note, the median acuities of the ELBW/EP group were within the normal range in each condition. Sta-tistically significant differences were found between ELBW/EP adolescents and controls with habitual correction for either eye (left eye, z =24.07,P,
FIGURE 1
.001; right eye, z =25.62,P,.001), and for the best score overall (better eye,
z = 24.93, P , .001). The best eye
logMAR score with habitual correction was used for subsequent analyses de-termining impairment.39
The ELBW/EP group had higher rates of sensory visual impairment than con-trols, but the group differences only reached significance for stereopsis and convergence (Table 2). There were more ELBW/EP adolescents who
dem-onstrated difficulties in 1 or more
areas compared with the control group (Table 2).
More ELBW/EP adolescents who had a previous diagnosis of severe ROP were likely to have impaired visual acuity (42.9% vs 17.1%) and stereopsis (53.6% vs 22.4%). They were also more likely to have any visual impairment (67.9% vs 39.3%) or multiple impairments (35.7% vs 14.8%). These statistical conclusions
remained after adding severe white matter injury as a predictor of visual sensory outcomes. Only severe ROP was independently related to impaired vi-sual acuity (odds ratio [OR] 3.65; 95% confidence interval [CI] 1.57 to 8.49), with the overall model explaining 7.4% of variance. Both severe ROP (OR 4.12, 95% CI 1.79 to 9.44) and severe white matter injury (OR 3.71, 95% CI 1.45 to 9.51) were independently related to impaired stereopsis, with the overall model explaining 11.4% of variance. The models for convergence and color vi-sion were not significant.
Visual Perception
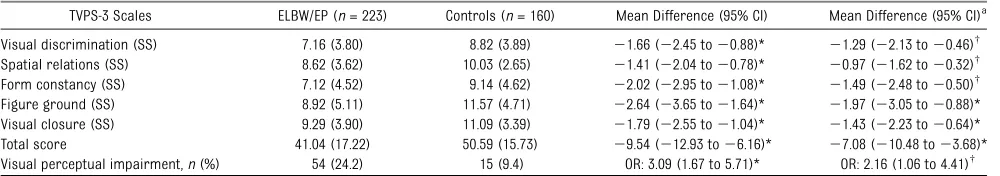
On tests of visual perception, the ELBW/ EP adolescents performed worse com-pared with the controls on each of the TVPS-3 subtests, with most differences exceeding 0.5 SD (Table 3). Consistent
with these findings, the total visual
perceptual score was significantly
lower for the ELBW/EP cohort compared with the control group. Adolescents in the ELBW/EP cohort demonstrated sig-nificantly more clinical impairments in visual perception. Excluding adoles-cents with impaired visual acuity (n= 72) or adolescents with an IQ,70 (n= 14) did not change any statistical con-clusions concerning visual perceptual outcomes.
DISCUSSION
This study demonstrates that, relative to controls, adolescents born ELBW/EP exhibit poorer outcomes in both sen-sory and visual perception measures. Of particular concern, ELBW/EP adoles-cents were approximately 4 times more likely to demonstrate impairment in multiple areas. Clinically, it is notable that ELBW/EP adolescents were more likely to exhibit difficulties across a range of visual perceptual tasks, even after excluding those with sensory or intellectual impairment. As expected, those ELBW/EP adolescents with a pre-vious diagnosis of severe ROP had more impairment across most visual sensory domains; however, ROP only explained a small proportion of the variance.
Preterm birth may have major con-sequences to the development of the visual pathway. Both ocular and brain pathology, ranging from local to diffuse, has been implicated in visual deficits in preterm children. Importantly, signifi -cant research gaps include limited understanding of the proportion of
vi-sual difficulties in adolescence and
adulthood, in geographic samples, and after the introduction of important obstetric and neonatal interventions such as antenatal corticosteroids and surfactant therapy. Consistent with previous research, which has indicated that 50% to 65% of preterm children exhibit at least 1 visual difficulty,6,19,40
the current study found that almost 32% of ELBW/EP adolescents wore
TABLE 1 Demographic Characteristics of ELBW/EP Adolescents Who Participated Versus Nonparticipants and the Term-Born Group
ELBW/EP Controls
(n= 166) Participants
(n= 228)
Nonparticipants (n= 70)
Neonatal characteristics
Male:n(%) 99 (43.4) 39 (55.7) 67 (40.4)
Gestational age at birth, wk, mean (SD) 26.6 (2.0) 27.0 (1.7) 39.2 (1.4) Birth weight, g, mean (SD) 884 (161) 899 (161) 3401 (453)
Multiple birth,n(%) 75 (32.9) 16 (22.9) 2 (1.2)
Grade III or IV IVH,n(%) 16 (7.0) 2 (2.9) 0 (0)
Cystic PVL,n(%) 9 (3.9) 9 (12.9)* 0 (0)
Antenatal corticosteroids,n(%) 162 (71.1) 55 (78.6) 2 (1.2) Postnatal corticosteroids,n(%) 73 (32.0) 25 (35.7) 0 (0) Bronchopulmonary dysplasia,n(%) 81 (35.5) 30 (42.9) 0 (0) Patent ductus arteriosus,n(%) 106 (46.5) 28 (40.0) 0 (0)
Surgery:n(%) 58 (25.4) 19 (27.1) 0 (0)
ROP stage$3 either eye,n(%) 28 (12.3) 8 (11.4) 0 (0) Neurosensory disability at 8 years
Cerebral palsy,n(%) 21 (9.4) 8 (15.7) 0 (0)†
Blinda 0 (0) 3 (4.9)* 0 (0)†
Deafb
0 (0) 2 (3)* 0 (0)
IQ,70c
13 (6) 1 (3.5) 2 (1.2)†
Social risk Higher Social Riskd
,n(%) 112/221 (50.7) 28/48 (58.3) 53/161 (32.9)†
IVH, intraventricular hemorrhage; PVL, periventricular leukomalacia; ROP, retinopathy of prematurity.
aVisual acuity worse than 6/60 in the better eye. bRequired hearing aids or worse.
cWechsler Intelligence Scale for Children, Third Edition.
dHigh social risk determined by maternal education when the child was 8 years of age.
*P,.05 versus nonparticipants.
corrective eyewear, 43% were impaired in either visual acuity, stereopsis,
con-vergence, or color vision, and ∼17%
were impaired in 2 or more of these outcomes.
In terms of specific sensory measures, the median visual acuity score of the best eye for the ELBW/EP group was within normal limits; however, it was significantly worse than the median of the control cohort. Although it is com-monly reported that preterm children have poorer visual outcomes in specific measures and higher rates of impair-ment compared with term controls, previous studies have typically repor-ted on selecrepor-ted samples with a focus on participants with severe white matter lesions and/or a previous diagnosis of ROP.2,16–20In a cohort study by Evensen
et al41of 14-year-olds free of cerebral
palsy who were born ,1500 g in the
1980s, rates of impaired visual acuity (8%) and stereopsis (8%) were lower, but rates of convergence problems (24%) were higher than the current study.
Amblyopia and refractive errors can cause the blurring of unilateral images and may therefore affect binocular vi-sion, resulting in the loss of stereoa-cuity.1,42To develop normal stereopsis
the neural development of binocular cortical cells requires clear retinal imaging during critical periods of vi-sual development, which, according to Banks et al (1975),43is between 3 and 6
months, and between 12 and 20 months. Refractive errors, strabismus, and amblyopia are often reported in preterm children9,20,44,45 whose eyes
may be susceptible to damage owing to necessary medical care and/or early visual experiences during critical pe-riods of development, which may help explain why there is a higher incidence of reduced depth perception, even in adolescence. Convergence and reduced or absent stereopsis have important implications for functional vision, such
FIGURE 2
Distribution of visual acuity scores for left, right, and best eye with habitual correction. Boxplots show the median, interquartile range (IQR; 25th and 75th percentiles; the margins of the box), outliers (up to 1.5 times the IQR), and extremes (.1.5 times the IQR).
TABLE 2 Sensory Outcomes: Visual Impairments in ELBW/EP and Control Groups
Visual Impairment ELBW/EP (n= 223) n(%)
Controls (n= 161) n(%)
Odds Ratio 95% CI PValue
Visual acuity.0.2 c 45 (20.3) 27 (16.8) 1.26 0.74 to 2.14 0.46
Stereopsis c 59 (26.2) 16 (9.9) 3.22 1.78 to 5.84 ,0.001
Convergence c 35 (15.7) 10 (6.3) 2.76 1.32 to 5.75 0.009
Color vision 7 (3.1) 1 (0.6) 5.15 0.63 to 42.30 0.18
Visual impairment$1 96 (42.7) 47 (29.2) 1.81 1.17 to 2.78 0.009 Visual impairment$2 39 (17.3) 8 (5.0) 4.01 1.82 to 8.84 ,0.001
as activities requiring motion percep-tion,46and many visual motor activities
including reaching, manipulation of objects, and the ability to guide one’s body or a vehicle in the environment.47
Motor coordination and visual motor integration impairments are reported in high numbers in preterm children,
thus thefindings that almost 16% of
ELBW/EP adolescents were impaired in the convergence task and 26% im-paired in stereopsis are clinically important. Consequently, the early identification of visual dysfunction that can lead to secondary issues with stereoacuity should be considered an important part of screening in preterm children.
ELBW/EP adolescents with a previous diagnosis of severe ROP were∼4 times more likely to have impaired visual acuity and stereopsis. Severe white matter injury on the other hand, only significantly predicted impairment in stereopsis. Not surprisingly, however, each model only explained a small proportion of the variance, suggesting these variables do not fully account for
the visual deficits demonstrated in
preterm survivors. Others have repor-ted that children with severe ROP have an increased incidence of strabismus, amblyopia, and refractive errors, in particular myopia, compared with other preterm infants and term con-trols.3,48–51Although severe white
mat-ter damage has been identified as
a risk factor for a number of visual
deficits,2,16,18 it only predicted poor
stereopsis, which is consistent with research highlighting the impor-tance of the cortical visual pathways for the development of binocular stereopsis.52,53
Interpreting reported data to guide clinical management and assessment of visual function in preterm children is hampered by variability in methods and
findings, as discussed previously.19,46,54–57
Furthermore, there is a paucity of re-search that has thoroughly examined visual perceptual outcomes in high-risk ELBW/EP children beyond school
age, although difficulties have been
noted in judgment of line orienta-tion,58perceptual matching,41and
bi-ological motion processing.59 The
current study was a unique opportu-nity to report on a contemporary and representative cohort on long-term vi-sual outcomes in preterm adolescents.
As expected, ELBW/EP adolescents
performed significantly more poorly
across the range of visual perceptual tasks, suggesting global, rather than specific, perceptual difficulties persist into adolescence. Of clinical relevance is that this ELBW/EP adolescent group had higher rates of impairment even after excluding adolescents with low IQ and sensory impairment. That diffi cul-ties with visual perception are com-mon even in ELBW/EP adolescents with normal sensory functioning suggests impaired perception can result from problems with higher order processing.
This study has a number of strengths, including a large geographic sample and prospective design with contem-poraneously recruited controls. More-over, it reports data from the oldest survivors born in the 1990s. In addition, we were able to explore outcomes from a variable-centered approach by com-paring group means on the domain or task of interest as well as by a person-centered approach by investigating patterns of functional deficits across different aspects of visual processing. Although cut-off scores are a convenient way of defining dysfunction, the choice of where to draw this line is arbitrary.60
Some studies use a more liberal cut-off, such as the 15th percentile, whereas others use a more conservative cut-off of the fifth centile. According to Fay et al,60the choice of the 10th percentile
overcomes the problem of defining too many as impaired, including the con-trol group. Importantly, although there is no consensus as to what constitutes a functional or clinically important impairment, scores that fall below the
10th percentile (ie, # 21.3 SD) are
often considered to fulfill this general criterion.61–63We also acknowledge the
limitations of this study. As noted, re-tention rates were 76% and 63% for the ELBW/EP and control groups, respec-tively, although the only difference between the participating and
non-participating ELBW/EP adolescents
was the higher rate of periventricular
leukomalacia in nonparticipants,
TABLE 3 Visual Perceptual Outcomes From the TVPS-3 for the ELBW/EP and Control Groups
TVPS-3 Scales ELBW/EP (n= 223) Controls (n= 160) Mean Difference (95% CI) Mean Difference (95% CI)a
Visual discrimination (SS) 7.16 (3.80) 8.82 (3.89) 21.66 (22.45 to20.88)* 21.29 (22.13 to20.46)† Spatial relations (SS) 8.62 (3.62) 10.03 (2.65) 21.41 (22.04 to20.78)* 20.97 (21.62 to20.32)† Form constancy (SS) 7.12 (4.52) 9.14 (4.62) 22.02 (22.95 to21.08)* 21.49 (22.48 to20.50)† Figure ground (SS) 8.92 (5.11) 11.57 (4.71) 22.64 (23.65 to21.64)* 21.97 (23.05 to20.88)* Visual closure (SS) 9.29 (3.90) 11.09 (3.39) 21.79 (22.55 to21.04)* 21.43 (22.23 to20.64)* Total score 41.04 (17.22) 50.59 (15.73) 29.54 (212.93 to26.16)* 27.08 (210.48 to23.68)* Visual perceptual impairment,n(%) 54 (24.2) 15 (9.4) OR: 3.09 (1.67 to 5.71)* OR: 2.16 (1.06 to 4.41)†
Data are mean (SD) unless otherwise indicated. SS, scaled score.
aAfter excluding participants with impaired visual acuity (logMAR$0.20) and IQ,70.
*P,.001.
suggesting that, if anything, impair-ments could be underestimated. Al-though we were able to ascertain valuable information about long-term visual outcomes after preterm birth, a more complete ophthalmologic exami-nation may have provided greater ac-count of the full range of visual functions.
CONCLUSIONS
Despite advances in medical care im-proving the survival rate of high-risk ELBW/EP infants, visual morbidity is still relatively high compared with controls in late adolescence. Notwith-standing the fact that visual acuity in most ELBW/EP adolescents is within the normal range, the current study results demonstrate support for the persis-tence of visual perceptual problems in ELBW/EP adolescents, which may lay the foundation to examine more complex relationships between visual percep-tion and other visual-based cognitive and functional outcomes. In Australia, it is not routine to screen for visual per-ceptual difficulties, neither are there intervention strategies with proven
ef-ficacy to deal specifically with these
problems. Given the potential impor-tance of visual perceptual skills to more complex tasks and academic achieve-ment, these results have important clinical relevance. Additionally, it may be important to focus future research toward identifying those ELBW/EP infants most at risk, as well as developing clinical screening instruments and appropriate intervention programs to foster achievement within this domain.
VICTORIAN INFANT STUDY GROUP
This work is published on behalf of members of the Victorian Infant Study Group, who were involved in data collec-tion at the various study sites.
Murdoch Childrens Research Institute, Melbourne, Australia: Lex W. Doyle, MD, FRACP (Convenor), Peter J. Anderson, PhD, Jeanie Cheong, MD, FRACP, Gehan Roberts, MPH, PhD, FRACP; Premature Infant Follow-up Program at the Royal
Women’s Hospital, Melbourne,
Aus-tralia: Lex W. Doyle, MD, FRACP, Catherine Callanan, RN, Jeanie Cheong, MD, FRACP, Noni Davis, FRACP, Cinzia R. De Luca, BSc, PhD, Julianne Duff, FRACP, Esther Hutchinson, BSc (Hons), Elaine Kelly, MA, Marion McDonald, RN, Gehan
Roberts, MPH, PhD, FRACP; Depart-ment of Obstetrics and Gynaecology, The University of Melbourne, Melbourne, Australia: Lex W. Doyle, MD, FRACP, Cinzia R. De Luca, BSc, PhD; Depart-ment of Paediatrics, The University of Melbourne, Melbourne, Australia: Lex W. Doyle, MD, FRACP, Gehan Roberts, MPH, PhD, FRACP; Mercy Hospital for Women, Melbourne, Australia: Elaine Kelly, MA, Gillian Opie, FRACP, Andrew Watkins, FRACP, Amanda Williamson, Heather Woods, RN; Monash Medical Centre, Clayton, Victoria, Australia: Elizabeth Carse, FRACP, Margaret P. Charlton, M Ed Psych, Marie Hayes, RN; Royal Children’s Hospital, Melbourne, Aus-tralia: Gehan Roberts, MPH, PhD, FRACP, Colin Robertson, MD, FRACP; and School of Psychology, the University of Birming-ham, United Kingdom: Stephen Wood, PhD.
The following were successful appli-cants for project grant 491246 from the National Health and Medical Research Council: Dr Doyle, Dr P. Anderson, Dr Wood, Dr Robertson, Sarah Hope, Doug Hacking, and Dr Cheong.
REFERENCES
1. Birch EE, O’Connor AR. Preterm birth and visual development.Semin Neonatol. 2001;6 (6):487–497
2. Cioni G, Bertuccelli B, Boldrini A, et al. Correlation between visual function, neu-rodevelopmental outcome, and magnetic resonance imagingfindings in infants with periventricular leucomalacia. Arch Dis Child Fetal Neonatal Ed. 2000;82(2):F134– F140
3. Darlow BA, Clemett RS, Horwood LJ, Mogridge N. Prospective study of New Zea-land infants with birth weight less than 1500 g and screened for retinopathy of pre-maturity: visual outcome at age 7–8 years.
Br J Ophthalmol. 1997;81(11):935–940 4. Downie ALS, Jakobson LS, Frisk V, Ushycky I.
Periventricular brain injury, visual motion processing, and reading and spelling abilities
in children who were extremely low birthweight.J Int Neuropsychol Soc. 2003;9 (3):440–449
5. O’Connor AR, Stephenson T, Johnson A, et al. Visual function in low birthweight children.Br J Ophthalmol. 2004;88(9):1149– 1153
6. Powls A, Botting N, Cooke RW, Stephenson G, Marlow N. Visual impairment in very low birthweight children.Arch Dis Child Fetal Neonatal Ed. 1997;76(2):82–87
7. Grisham D, Powers M, Riles P. Visual skills of poor readers in high school.Optometry. 2007;78(10):542–549
8. Maples WC. Visual factors that significantly impact academic performance.Optometry. 2003;74(1):35–49
9. Cooke RW, Foulder-Hughes L, Newsham D, Clarke D. Ophthalmic impairment at 7
years of age in children born very preterm.
Arch Dis Child Fetal Neonatal Ed. 2004;89 (3):249–253
10. Aylward GP. Cognitive and neuro-psychological outcomes: more than IQ scores. Ment Retard Dev Disabil Res Rev. 2002;8(4):234–240
11. Mitchell JP. Mentalizing and Marr: an in-formation processing approach to the study of social cognition.Brain Res. 2006; 1079(1):66–75
12. Pelphrey KA, Carter EJ. Brain mechanisms for social perception: lessons from autism and typical development.Ann N Y Acad Sci. 2008;1145:283–299
14. Inder TE, Wells SJ, Mogridge NB, Spencer C, Volpe JJ. Defining the nature of the cere-bral abnormalities in the premature infant: a qualitative magnetic resonance imaging study.J Pediatr. 2003;143(2):171–179 15. Volpe JJ. Cerebral white matter injury of
the premature infant–more common than you think.Pediatrics. 2003;112(1 pt 1):176– 180
16. Jongmans MJ, Mercuri E, Henderson S, de Vries L, Sonksen P, Dubowitz L. Visual function of prematurely born children with and without perceptual-motor difficulties.
Early Hum Dev. 1996;45(1–2):73–82 17. Jacobson L, Hard A-L, Horemuzova E,
Ham-maren H, Hellstrom A. Visual impairment is common in children born before 25 ges-tational weeks–boys are more vulnerable than girls. Acta paediatrica. 2009;98(2): 261–265
18. Kok JH, Prick L, Merckel E, Everhard Y, Verkerk GJQ, Scherjon SA. Visual function at 11 years of age in preterm-born children with and without fetal brain sparing. Pe-diatrics. 2007;119(6):1342–1350
19. Hard AL, Niklasson A, Svensson E, Hellstrom A. Visual function in school-aged children born before 29 weeks of gestation: a pop-ulation-based study.Dev Med Child Neurol. 2000;42(2):100–105
20. Schalij-Delfos NE, de Graaf ME, Treffers WF, Engel J, Cats BP. Long term follow up of premature infants: detection of strabismus, amblyopia, and refractive errors. Br J Ophthalmol. 2000;84(9):963–967
21. Doyle LW, Bowman E, Callanan C, et al; Victorian Infant Collaborative Study Group. Outcome at 2 years of children 23-27 weeks’gestation born in Victoria in 1991-92.J Paediatr Child Health. 1997;33(2):161– 165
22. Doyle LW, Bowman E, Callanan C, et al; Victorian Infant Collaborative Study Group. Improved outcome into the 1990s for infants weighing 500-999 g at birth.Arch Dis Child Fetal Neonatal Ed. 1997;77(2):F91– F94
23. Doyle LW; Victorian Infant Collaborative Study Group. Outcome at 5 years of age of children 23 to 27 weeks’gestation: refining the prognosis.Pediatrics. 2001;108(1):134– 141
24. Doyle LW, Anderson PJ; Victorian Infant Collaborative Study Group. Improved neu-rosensory outcome at 8 years of age of extremely low birthweight children born in Victoria over three distinct eras.Arch Dis Child Fetal Neonatal Ed. 2005;90(6):F484– F488
25. Taylor HR. Applying new design principles to the construction of an illiterate E chart.
Am J Ophthalmol Physiol Optom. 1977;55 (5):348–351
26. Woods RL, Wood JM. The role of contrast sensitivity charts and contrast letter charts in clinical practice.Clin Exp Optom. 1995;78(2):43–57
27. McGinnity FG, Bryars JH. Controlled study of ocular morbidity in school children born preterm.Br J Ophthalmol. 1992;76(9):520– 524
28. Julesz B. Binocular depth perception with-out familiarity cues. Science. 1964;145 (3630):356–362
29. Shah MB, Fishman GA, Alexander KR, Viana M. Stereoacuity testing in patients with retinal and optic nerve disorders. Doc Ophthalmol. 1995;91(3):265–271
30. Hayes GJ, Cohen BE, Rouse MW, De Land PN. Normative values for the nearpoint of convergence of elementary schoolchildren.
Optom Vis Sci. 1998;75(7):506–512 31. Cole BL. Assessment of inherited colour
vision defects in clinical practice.Clin Exp Optom. 2007;90(3):157–175
32. Gunkel RD. Congenital color blindness.Arch Ophthalmol. 1981;99(6):1023–1027 33. Adams AJ, Verdon WA, Spivey BE. Color
vi-sion. In: Tasman WJE, ed.Duane’s Founda-tions of Clinical Ophthalmology. 15th ed. Philadelphia, PA: Lippincott Williams & Wilkins; 2009
34. Wiggs JL. Molecular genetics of selected ocular disorders. In: Yanoff M DJ, ed. Oph-thalmology. 3rd ed. St. Louis, Mo: Mosby Elsevier; 2008: chap 1.2. pp. 10–18 35. Martin N.Test of Visual Perceptual Skills.
3rd ed. Novato, CA: Academic Therapy Publications; 2006
36. Davis DW, Burns BM, Wilkerson SA, Steichen JJ. Visual perceptual skills in children born with very low birth weights. J Pediatr Health Care. 2005;19(6):363–368
37. Wechsler D.Manual for the Wechsler Ab-breviated Scale of Intelligence. San Antonio, TX: Psychological Corporation; 1999 38. Doyle LW, Anderson PJ. Improved
neuro-sensory outcome at 8 years of age of ex-tremely low birthweight children born in Victoria over three distinct eras.Arch Dis Child Fetal Neonatal Ed. 2005;90(6):121–128 39. Rubin GS, Munoz B, Bandeen-Roche K, West SK. Monocular versus binocular visual acuity as measures of vision impairment and predictors of visual disability. Invest Ophthalmol Vis Sci. 2000;41(11):3327–3334 40. O’Connor AR, Stephenson T, Johnson A, et al. Long-term ophthalmic outcome of low birth weight children with and without retinopathy of prematurity. Pediatrics. 2002;109(1):12–18
41. Evensen KAI, Lindqvist S, Indredavik MS, Skranes J, Brubakk A-M, Vik T. Do visual impairments affect risk of motor problems in preterm and term low birth weight adolescents?Eur J Paediatr Neurol. 2009;13 (1):47–56
42. Kim SH, Plager DA. Stereopsis in children with unilateral pseudophakia. Br J Oph-thalmol. 2009;93(3):333–336
43. Banks MS, Aslin RN, Letson RD. Sensitive period for the development of human bin-ocular vision.Science. 1975;190(4215):675– 677
44. Stephenson T, Wright S, O’Connor AR, et al. Children born weighing less than 1701 g: visual and cognitive outcomes at 11-14 years. Arch Dis Child Fetal Neonatal Ed. 2007;92(4):F265–F270
45. Theng JT, Wong TY, Ling Y. Refractive errors and strabismus in premature Asian infants with and without retinopathy of prema-turity.Singapore Med J. 2000;41(8):393–397 46. Jakobson LS, Frisk V, Downie ALS. Motion-defined form processing in extremely pre-mature children. Neuropsychologia. 2006; 44(10):1777–1786
47. Coren S, Hakstian R. Screening for stereop-sis without the use of technical equipment: scale development and cross-validation.Int J Epidemiol. 1996;25(1):146–151
48. Kushner BJ. Strabismus and amblyopia associated with regressed retinopathy of prematurity.Arch Ophthalmol. 1982;100(2): 256–261
49. Nissenkorn I, Yassur Y, Mashkowski D, Sherf I, Ben-Sira I. Myopia in premature babies with and without retinopathy of prematurity. Br J Ophthalmol. 1983;67(3): 170–173
50. Quinn GE, Dobson V, Kivlin J, et al; Cryo-therapy for Retinopathy of Prematurity Cooperative Group. Prevalence of myopia between 3 months and 5 1/2 years in preterm infants with and without retinop-athy of prematurity. Ophthalmology. 1998; 105(7):1292–1300
51. Snir M, Nissenkorn I, Sherf I, Cohen S, Ben Sira I. Visual acuity, strabismus, and am-blyopia in premature babies with and without retinopathy of prematurity. Ann Ophthalmol. 1988;20(7):256–258
52. Mercuri E, Atkinson J, Braddick O, et al. Visual function in full-term infants with hypoxic-ischaemic encephalopathy. Neuro-pediatrics. 1997;28(3):155–161
infants at 3-4 years of life.Arch Dis Child Fetal Neonatal Ed. 2005;90(6)
55. Hard AL, Aring E, Hellstrom A. Subnormal visual perception in school-aged ex-preterm patients in a paediatric eye clinic.Eye. 2004; 18(6):628–634
56. Ito J, Saijo H, Araki A, et al. Assessment of visuoperceptual disturbance in children with spastic diplegia using measurements of the lateral ventricles on cerebral MRI.
Dev Med Child Neurol. 1996;38(6):496–502 57. van den Hout BM, Stiers P, Haers M, et al.
Relation between visual perceptual im-pairment and neonatal ultrasound di-agnosis of haemorrhagic-ischaemic brain
lesions in 5-year-old children. Dev Med Child Neurol. 2000;42(6):376–386
58. Isaacs EB, Edmonds CJ, Chong WK, Lucas A, Gadian DG. Cortical anomalies associated with visuospatial processing deficits. Ann Neurol. 2003;53(6):768–773
59. Pavlova M, Sokolov AN, Birbaumer N, Krageloh-Mann I. Biological motion pro-cessing in adolescents with early periven-tricular brain damage. Neuropsychologia. 2006;44(4):586–593
60. Fay TB, Yeates KO, Wade SL, Drotar D, Stancin T, Taylor HG. Predicting longitudinal patterns of functional deficits in children with traumatic brain injury. Neuropsychol-ogy. 2009;23(3):271–282
61. Heaton RK, Grant I, Matthews CG. Compre-hensive norms for an expanded Halstead-Reitan battery: Demographic corrections, research findings, and clinical applica-tions. Odessa, FL: Psychological Assessment Resources; 1991
62. Hannay HJ, Lezak MD. The neuro-psychological examination: Interpretation. In: Lezak MD, Howieson DB, Loring DW, eds.
Neuropsychological assessment. 4th ed. New York, NY: Oxford University Press; 2004: 133–156
63. Golden CJ, Purish AD, Hammeke TA. Luria-Nebraska Neuropsychological Battery: Forms I and II. Los Angeles, CA: Western Psychologi-cal Services; 1991
(Continued fromfirst page)
PEDIATRICS (ISSN Numbers: Print, 0031-4005; Online, 1098-4275).
Copyright © 2013 by the American Academy of Pediatrics
FINANCIAL DISCLOSURE:The authors have indicated they have nofinancial relationships relevant to this article to disclose.
FUNDING:Supported by the National Health and Medical Research Council (project grant 491246; Centre for Clinical Research Excellence 546519; Senior Research Fellowship 628371 to Dr P. Anderson) and the Victorian Government’s Operational Infrastructure Support Program.
DOI: 10.1542/peds.2013-0040 originally published online August 5, 2013;
2013;132;e704
Pediatrics
Anderson and Lex W. Doyle
Carly S. Molloy, Michelle Wilson-Ching, Vicki A. Anderson, Gehan Roberts, Peter J.
Services
Updated Information &
http://pediatrics.aappublications.org/content/132/3/e704 including high resolution figures, can be found at:
References
http://pediatrics.aappublications.org/content/132/3/e704#BIBL This article cites 12 articles, 7 of which you can access for free at:
Subspecialty Collections
http://www.aappublications.org/cgi/collection/pharmacology_sub Pharmacology
sub
http://www.aappublications.org/cgi/collection/fetus:newborn_infant_ Fetus/Newborn Infant
following collection(s):
This article, along with others on similar topics, appears in the
Permissions & Licensing
http://www.aappublications.org/site/misc/Permissions.xhtml in its entirety can be found online at:
Information about reproducing this article in parts (figures, tables) or
Reprints
DOI: 10.1542/peds.2013-0040 originally published online August 5, 2013;
2013;132;e704
Pediatrics
Anderson and Lex W. Doyle
Carly S. Molloy, Michelle Wilson-Ching, Vicki A. Anderson, Gehan Roberts, Peter J.
Extremely Preterm
Visual Processing in Adolescents Born Extremely Low Birth Weight and/or
http://pediatrics.aappublications.org/content/132/3/e704
located on the World Wide Web at:
The online version of this article, along with updated information and services, is
by the American Academy of Pediatrics. All rights reserved. Print ISSN: 1073-0397.