670 | P a g e
APPLICATION OF DIFFERENTIAL SEARCH
ALGORITHM TO OPTIMISE THE TURNING
OPERATIONS INPUT VARIABLES WHILE
MACHINING E0300 ALLOY STEEL
D.Ramalingam
1, Dr.M.Saravanan
2, R.Rinu Kaarthikeyen
3, T.Muthumari
41
Associate Professor, Nehru Institute of Technology, Coimbatore, India, corresponding author
2
Principal, SSM Institute of Engineering and Technology, Dindigul (India)
3
Research Associate, Manager – Engineering, TCMPFL, Chennai (India )
4
Research Associate, Nehru Institute of Engg & Tech, Coimbatore (India)
ABSTRACT
Turning process is one of the inevitable commonly applied machining operations almost in all the manufacturing industries which cover verities of operations to bring the configuration of the product to the desired shape and size. In such machining process the prime objectives are to achieve the concern dimensional accuracy in the product with the required surface quality is equally important. Surface quality is recognized as most important resultant parameter. This investigation mainly concerned with the optimisation of machining parameters to achieve the desired surface quality referring the Cutting speed, tool feed and depth of cut as the input machining variables while performing turning operations on the E0300 Alloy steel. The methodology adopted in this attempt is the Differential Search Algorithm linked with the statistical regression relationship between the parameters as the conditional platform for simulation through MATLAB R2017programming. Through the processing of simulation the optimised parameter combinations are identified for the surface roughness and generalized path of results for various combination of input variables also generated.
Key words- E0300, Turning, Regression, Differential Search Algorithm, Optimisation, Minitab,
MATLAB.
I. INTRODUCTION
In the present scenario of manufacturing attaining the right quality of product with reasonable cost and time is
highly needed approach to every manufacturer. The identification of right methodology of operations with right
selection of machining parameters combination for the selected material calls for investigation of the process
through every aspect. Turning process is the most common applied one with highly automated machining
centres nowadays. Though every care has been taken by machine tool manufacturers and the cutting tool
developers at the time of operation the selection of suitable parameter combination is getting importance in the
671 | P a g e
important outcome since because the functional property of the product concerned is dependent on this. Thesurface finish of any product is mainly associated with the materials properties and process parameters like
machining speed; tool feed rate, depth of cut, tool material and properties etc. In this present investigation the
identification of the level of influence of the cutting variables on the surface finish of the E0300 alloy material
in turning operations is carried out. Differential Search Algorithm is employed for identifying such parameter
combination and the suitability of the algorithm is assessed for further applications. Statistical regression
relationship between the process parameters is chosen as an additional support to get the improved results.
II. RELATED LITERATURE
Alakesh Manna and Sandeep Salodkar [1] have made an attempt in turning of E0300 alloy material and
analysed the outcome of the observation with Dynamic programming and Anova technique. They have
developed a mathematical model for surface roughness height, Ra and proposed for proper selection of the turning parameters. The developed model can aid directly to evolutes the Ra value under different machining combination during turning. Wang et al. [2] have conducted experiment, optimized the machining variables with
the aid of the deterministic approach and suggested to choose the cutting conditions economically in single pass
turning operation. Puertas Arbizu and Luis Perez [3] have identified through their experiment that the effect of
the machining input parameters feed rate and the depth of cut as the adverse effect on the surface finish through
employing factorial design. Tekiner and Yesilyurt [4] have examined on the appropriate process parameters in
the turning operations AISI 304 austenitic stainless steels. Muthukrishnan et al. [5] have assessed on the
application of ANN as well as ANOVA analysis for optimization of machining parameters in turning AlSiC
composites and declared that both ANOVA and ANN modeling offer an organized and efficient method on
optimization. Chang [6] declared in their study that the tool geometry too cause for the vibration on the machine
tool during operations related to other parameters. Feng [7] has investigated through the fractional factorial
experimentation method that the machining speed, cutting tool feed rate, the tool geometry and the properties of
the work material have a significant influence on the surface quality of the product. Basavarajappa et al. [8]
have revealed the influence of speed and feed on drilling of hybrid metal matrix composites through Taguchi
techniques through their experimental investigation. Tosun [9] has declared his findings regarding the
application of grey relational analysis to optimise the drilling process parameters for surface roughness and the
burr height is introduced. That attempt particularly notified for grey relational analysis approach successful
application to other operations in which presentation is resolute by several parameters at many quality requests.
Yang JL & Chen JC [10] have stated that the surface roughness, Ra can be presented through the mathematical
relationship.
In this attempt the analysis and forecasting on the optimized parametric combination is carried out through
Differential Search Algorithm by MATLAB programming. Based on the fitness of the regression equation
developed in Minitab, as a new approach of feeding the regression equation relationship as input instead of
672 | P a g e
III. EXPERIMENTAL PLAN AND OBSERVED DATA
E0300 alloy steel was selected as work-piece material and experiment conducted in the Kirloskar Centre Lathe.
The cutting tool used for this process was PVD coated with an identical thin coating (Ti Al and Si) N imparted
via a low voltage arch process of specification DNMG15608EF, grade 8030 (nose radius 0.8mm) single point
cutting tool.
Table 3.1 Input machining parameters level selection
Turning parameters Units Level 1 Level 2 Level 3
Cutting Speed (m / min) 40 100 160
Feed (mm / rev) 0.16 0.32 0.48
Depth of cut (mm) 0.50 0.75 1.0
The input parameters are cutting speed (m / min), feed (mm / rev), and depth of cut (mm) where the output
parameter chosen for investigation was the surface quality. Three levels of input parameters selection was
mentioned in the Table 3.1. The surface quality of the machined surface was measured at three different
positions through the TSK Surfcom 130A, surface texture measuring instrument and the average value was
taken for investigation. Then arrived observed experimental data are mentioned in the Table 3.2
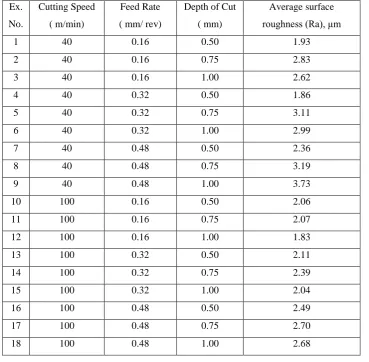
Table 3.2 Experimental observed data set
Ex.
No.
Cutting Speed
( m/min)
Feed Rate
( mm/ rev)
Depth of Cut
( mm)
Average surface
roughness (Ra), μm
1 40 0.16 0.50 1.93
2 40 0.16 0.75 2.83
3 40 0.16 1.00 2.62
4 40 0.32 0.50 1.86
5 40 0.32 0.75 3.11
6 40 0.32 1.00 2.99
7 40 0.48 0.50 2.36
8 40 0.48 0.75 3.19
9 40 0.48 1.00 3.73
10 100 0.16 0.50 2.06
11 100 0.16 0.75 2.07
12 100 0.16 1.00 1.83
13 100 0.32 0.50 2.11
14 100 0.32 0.75 2.39
15 100 0.32 1.00 2.04
16 100 0.48 0.50 2.49
17 100 0.48 0.75 2.70
673 | P a g e
19 160 0.16 0.50 1.10
20 160 0.16 0.75 1.13
21 160 0.16 1.00 1.62
22 160 0.32 0.50 1.65
23 160 0.32 0.75 1.40
24 160 0.32 1.00 1.88
25 160 0.48 0.50 2.93
26 160 0.48 0.75 1.73
27 160 0.48 1.00 2.19
IV. MATHEMATICAL MODELLING
With the Minitab17 software the influence of the input machining parameters (speed, feed and depth of cut) on
the output parameter (surface roughness) are analysed by statistical regression relationship. The second order
regression relationship between the variables shows higher level significance than the first order regression
through the values of the R – sq. Both the first and second order statistical values of R-sq can be viewed from
the Table 4.1.
Table 4.1 Regression model comparison for surface roughness
Parameter Regression S R-sq R-sq(adj) R-sq(pred) Durbin - Watson
Df 1
st order 0.373373 70.32% 66.45% 56.88% 2.40514
2nd order 0.354473 80.23% 69.76% 41.89% 2.36162
The second order regression equations through the Minitab17 for the surface roughness parameter in terms of
input parameter combination are
Surface roughness = (0.60) + (0.0034*Cutting speed) – (1.58*Feed Rate) + (3.93*doc) – (0.000008*Cutting
speed^2) + (5.06*Feed Rate^2) – (0.92* doc ^2) + (0.0095*Cutting speed*Feed Rate) – (0.33*Feed Rate* doc)
– (0.01767*Cutting speed* doc) (4.1)
674 | P a g e
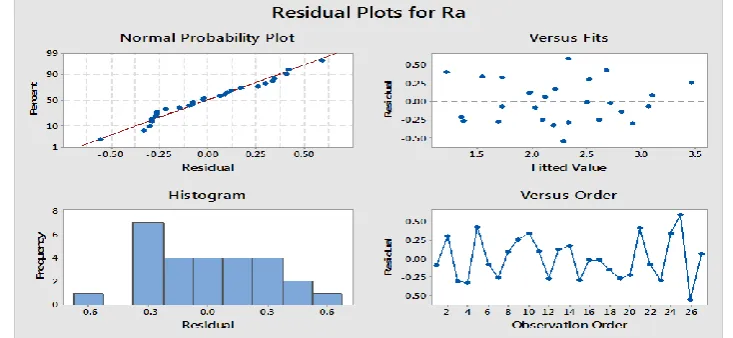
The residual plots through Minitab analysis for the surface roughness are depicted in Figure 4.1. Throughperforming the best subset regression analysis the parameter depth of cut registered the higher level influence on
the surface roughness. The second level of influence on the surface roughness is given by speed comparing to
feed rate.
V. OPTIMISATION METHODOLOGY
Optimization of the parameters in the present investigation is carried out with the application of Differential
Search Algorithm. Forecasting of the optimized Surface roughness in the turning process on the E0300
specimen was carried out by way of taking the prime objective as minimum surface roughness as the result. To
analyze the influence of the cutting speed and the feed on the surface roughness through DSA, MATLAB
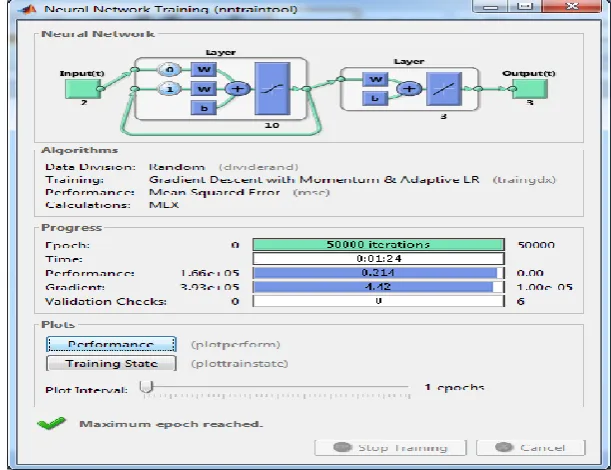
R2017 platform with the Elman Back Propagation approach is applied. The number of iterations initiated for
this simulation is 50000 turns. The suitability of the DAS methodology is assessed through the accuracy level in
computation which is from the error rate as the indicator. Figure 5.1 shows the progress of the training data in
MATLAB.
Figure 5.1 Data training progress of 50000 iterations
The accuracy level of the DSA was 5.28 x 10 -5 whilecomputationwas effected by taking the experimental
observed output parameter values as the input to the programme. Later the regression relationship is added in
the programme instead of taking random selection of input parameters combination and the accuracy level is
noticed as 3.64 x 10 -5 which indicated the improvement in the simulation. Finally the regression values
calculated through the programme referring to the input parameter combination fed in the programme and
processed. The result recorded was 2.31 x 10 -5 error value. After confirming the steady improvement stage by
stage in computation, in order to draw a smooth path of the process outcomes the parameters selected was sub
divided with the step value 10 m / min in speed, 0.004 step value in feed and 0.10 mm step value in depth of cut.
The computed results of the surface roughness through this approach for all combination of the parameter input
675 | P a g e
Table 5.1 Ra for the speed 40 m /min Vs all combination of feed and depth of cut
Speed 40 m / min
DOC Feed 0.16 Feed 0.20 Feed 0.24 Feed 0.28 Feed 0.32 Feed 0.36 Feed 0.40 Feed 0.44 Feed 0.48
0.50 1.90 2.03 2.07 2.12 2.03 2.27 2.37 2.48 2.89
0.60 2.23 2.50 2.28 2.33 2.39 2.47 2.58 2.69 3.23
0.70 2.26 2.31 2.47 2.52 2.59 2.67 2.62 2.91 3.11
0.80 2.61 2.87 2.65 2.69 2.76 2.84 2.93 3.42 3.32
0.90 2.45 2.78 2.81 2.85 2.92 3.14 3.29 3.45 3.58
1.00 2.90 2.80 3.01 3.01 2.90 3.05 3.14 3.17 3.19
Table 5.2 Ra for the speed 50 m /min Vs all combination of feed and depth of cut
Speed 50 m / min
DOC Feed 0.16 Feed 0.20 Feed 0.24 Feed 0.28 Feed 0.32 Feed 0.36 Feed 0.40 Feed 0.44 Feed 0.48
0.50 1.97 1.99 2.03 2.08 2.04 2.55 2.34 2.79 2.82
0.60 2.48 2.19 2.22 2.28 2.34 2.43 2.53 2.65 3.15
0.70 2.46 2.36 2.40 2.45 2.52 2.60 2.52 2.79 2.98
0.80 2.43 2.52 2.56 2.61 2.67 2.76 2.86 3.38 3.28
0.90 2.65 2.67 2.70 2.75 2.78 2.99 3.13 3.28 3.42
1.00 3.12 2.88 2.96 2.90 2.85 3.01 3.11 3.15 3.15
Table 5.3 Ra for the speed 60 m /min Vs all combination of feed and depth of cut
Speed 60 m / min
DOC Feed 0.16 Feed 0.20 Feed 0.24 Feed 0.28 Feed 0.32 Feed 0.36 Feed 0.40 Feed 0.44 Feed 0.48
0.50 1.92 1.95 1.98 2.04 1.98 2.49 2.32 2.75 2.77
0.60 2.41 2.12 2.16 2.22 2.30 2.39 2.49 2.61 3.05
0.70 2.31 2.29 2.33 2.38 2.45 2.54 2.44 2.68 2.87
0.80 2.44 2.43 2.47 2.52 2.59 2.68 2.78 3.32 3.23
0.90 2.53 2.55 2.59 2.64 2.67 2.87 2.99 3.12 3.26
1.00 2.64 2.84 2.90 2.83 2.81 2.96 3.07 3.12 3.12
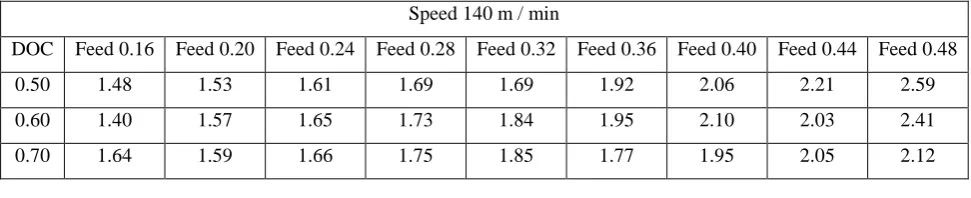
Table 5.4 Ra for the speed 140 m /min Vs all combination of feed and depth of cut
Speed 140 m / min
DOC Feed 0.16 Feed 0.20 Feed 0.24 Feed 0.28 Feed 0.32 Feed 0.36 Feed 0.40 Feed 0.44 Feed 0.48
0.50 1.48 1.53 1.61 1.69 1.69 1.92 2.06 2.21 2.59
0.60 1.40 1.57 1.65 1.73 1.84 1.95 2.10 2.03 2.41
676 | P a g e
0.80 1.54 1.59 1.66 1.75 1.85 1.96 2.29 2.33 2.37
0.90 1.52 1.58 1.64 1.47 1.83 1.94 2.07 2.41 2.37
1.00 1.49 1.54 1.61 1.69 1.79 2.14 2.19 2.30 2.42
Table 5.5 Ra for the speed 160 m /min Vs all combination of feed and depth of cut
Speed 160 m /min
DOC Feed 0.16 Feed 0.20 Feed 0.24 Feed 0.28 Feed 0.32 Feed 0.36 Feed 0.40 Feed 0.44 Feed 0.48
0.50 1.35 1.41 1.50 1.59 1.69 1.83 1.98 2.14 2.54
0.60 1.35 1.42 1.49 1.59 1.70 1.97 1.84 1.83 2.31
0.70 1.49 1.40 1.48 1.57 1.68 1.69 1.85 1.93 1.99
0.80 1.31 1.37 1.44 1.54 1.64 1.96 1.99 2.07 2.15
0.90 1.26 1.31 1.39 1.44 1.59 1.71 1.85 2.26 2.21
1.00 1.19 1.25 1.32 1.41 1.51 1.86 1.90 2.02 2.17
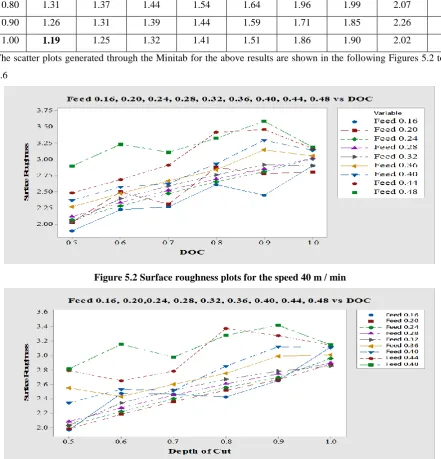
The scatter plots generated through the Minitab for the above results are shown in the following Figures 5.2 to
5.6
Figure 5.2 Surface roughness plots for the speed 40 m / min
677 | P a g e
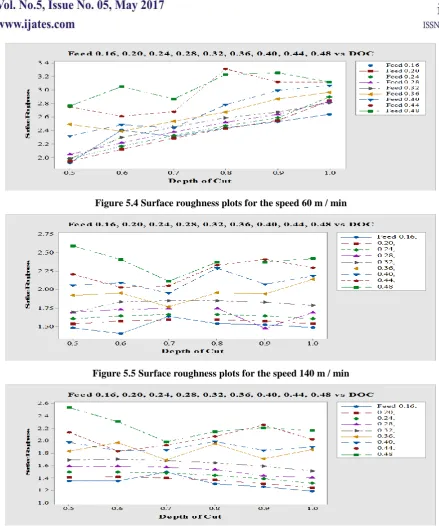
Figure 5.4 Surface roughness plots for the speed 60 m / min
Figure 5.5 Surface roughness plots for the speed 140 m / min
Figure 5.6 Surface roughness plots for the speed 160 m / min
VI. RESULTS AND CONCLUSION
Turning experiment conducted on the E0300 alloy material. Cutting Speed (m / min), Feed (mm / rev), depth of
cut (mm) are taken as input variables and the Surface roughness (µm) is taken as output variable for
investigation. As the 2nd order regression relationship between the input , output variables are significant
statistically it was taken as the input for the programme. DSA was employed in MATLAB platform towards
optimizing. On replacing with the random process with regression relationship, feeding the regression computed
values as input the accuracy level in computation is tune to the finest level for the set of values. By selecting the
678 | P a g e
cut registered the higher level influence on the surface roughness. The second level of influence on the surfaceroughness is given by speed which subsequently followed by tool feed rate.
The optimum value of Surface roughness Ra is 1.60 μm for the speed 160 m / min, with 0.60 mm / rev feed, 1.0
mm depth of cut combination. The plotted graphs generated for the reference to the processing manufacturers,
with respect to the end product quality requirement. Further subdivision of input parameters may give further
more smooth curves which will be useful to the processing industry. Nominating the regression values and the
regression relationship as the input boundary conditions to the programme to be taken care of based on the
statistical significance.
REFERENCES
[1] Alakesh Manna, Sandeep Salodkar. 2008. Optimization of machining conditions for effective turning of
E0300 alloy steel. Journal of Materials Processing Technology. 203, 147-153.
[2] Wang. J, Kuriyagawa. T, Wei. X.P, Guo. D.M. 2002. Optimization of cutting condition for single pass
turning operation using a deterministic approach. Int. J. Mach. Tools Manuf. 42, 1023-1033.
[3] Puertas Arbizu I, Luis Perez CJ. 2003. Surface roughness prediction by factorial design of experiments in
turning processes. J Mater Process Tech. 143-144, 390–396.
[4] Tekiner. Z, Yesilyurt. S. 2004. Investigation of the cutting parameters depending on process sound during
turning of AISI 304 austenitic stainless steel. Mater Des. 25, 507-513.
[5] Muthukrishnan. N, Murugan. M, Prahlada Rao. K. 2008. Machinability issues in turning of AlSiC(10p)
metal matrix composites. Int.Journal of Adv. Mfg.Tech. 39, 211-218.
[6] Chang. F.X. 2001. An Experimental Study of the Impact of Turning Parameters on Surface Roughness.
Proceedings of the Industrial Engineering Research Conference, Paper No. 2036, GA.
[7] Feng. C.X. 2001. An experimental study of the impact of turning parameters on surface roughness. In:
Proceedings of the Industrial Engineering Research Conference, Paper No. 2036. Dallas, TX.
[8] Basavarajappa. S, Chnadramohoan. G, Paulo Davim. J. 2008. Some studies on drilling of hybrid metal
matrix composites based on taguchi techniques. Journal of Materials Processing Technology. 196, 332-338.
[9] Nihat Tosun. 2006. Determination of optimum parameters for multi-performance characteristics in drilling
using grey relational analysis. Int. J. Adv. Mfg. Tech. 28, 450- 455.
[10]Yang. J.L & Chen. J.C. 2001. A systematic approach for identifying optimum surface roughness