T
h
e
Tipping Point
I
n
s
t
i
t
u
t
e
Improving Customer Experience
110930-1645
CS00D
Opportunities for improving Sydney’s suburban rail service
Discusson Paper
Tipping Point
I
n
s
t
i
t
u
t
e
Table of Contents
Forward 3 Executive Summary 5 Preamble 6 Introduction 8Sydney’s Rail Network Today 10
Improving Customer Experience Today 12 Rolling stock may not be the Constraint 15
Operating the Additional Services 16
New Metrics 18
Operational Metrics 20
Realising the Long-Term Improvement 22 References 24 Appendix A: New Service Enhancements 25 Appendix B: Spatial Rail Network Metrics 36 Review of International Metro Networks Spatial Metrics 37 Review of Internaitonal Suburban Networks Spatial Metrics 45 Review of The London Underground’s Spatial Metrics 53
About The Tipping Point Institute 63
© The Tipping Point Institute Pty Ltd (TTPI) 2011. All rights reserved.
The estimates, assumptions and other information has been developed by TTPI from its independent research, general
knowledge of the industry and consultation with third parties to produce this report. TTPI does not assume responsibility or make representations on behalf of the third parties as to the adequacy, accuracy or completeness of such information.
TTPI has prepared this document for the sole use of the NSW Business Chamber. No other party should rely on this document without the prior written consent of TTPI. TTPI undertakes no duty, nor accepts any responsibility, to any third party who may rely upon or use this document. This document has been prepared based on the NSW Business Chamber’s description of its requirements and TTPI’s experience. TTPI may also have relied upon information provided by third parties to prepare this document, some of which may not have been verified. Subject to the above conditions, this document may be transmitted, reproduced or disseminated only in its entirety.
FOREWORD
Every day the businesses of NSW rely on our public transport system to move over two million people to their workplace. On the rail network, over 900,000 people catch a train every working day.
Right from the first moment a potential employee meets an employer for an interview, questions about transportation become a factor in determining if an employee takes the job. In some areas of Sydney the absence or unreliability of public transport has seen many businesses find it difficult to attract or indeed keep staff.
Public transport not only impacts on the decision of potential staff about where they will work, it also impacts business every day through the costs of congestion.
Public transport is a business issue – and a critical one.
I believe that our public transport system in NSW could be so much better.
In the NSW Business Chamber’s 10 Big ideas to Grow NSW released in 2010 we argued that the first step in improving decision making in transport was to integrate the work of the fifteen different and autonomous transport authorities in NSW. The creation of Transport for NSW by the O’Farrell Government ensures we can make better decisions in transport and improving the customer experience on public transport is central to that mission.
We believe the sector has to become more innovative and customer focused. Those that run our trains, buses and ferries should have the same passion for improving customer experience as the great transport brands of the world do.
This excellent paper, prepared by the Tipping Point Institute for NSW Business Chamber, is meant to be a debate starter about how we can improve the customer experience for those who travel the rail network, how we can orientate decision making towards customer focus metrics and how we can improve existing capacity in our public transport network.
Our hope is that this paper will contribute to decisions that make our rail network faster, more reliable and more enjoyable. If it does, commuters, businesses and indeed, the wider community will all benefit.
Yours sincerely
Stephen Cartwright Chief Executive Officer
Improving Customer Experience
5
4
The Tipping Point Institute
T
h
e
Tipping Point
I
n
s
t
i
t
u
t
e
In targeting customer experience as the key performance measure for Sydney’s transport network, the NSW Government has both
understood the needs of the commuting public and entered into uncharted territory. This new target represents a significant shift from a past where the focus has been on measuring the operator’s ability to run services – an outcome that is management focused rather than customer focused.
To deliver on this customer experience promise the Government will need to manage some key issues. The suburban rail network is the backbone of Sydney’s public transport system. The near decade of stagnation in network capacity enhancement means that today, it is under servicing demand, is progressively less reliable, and does not reach areas of Sydney that were planned around rail transport availability. Solving these problems will involve the delivery of multi-year, multi-billion dollar infrastructure projects. Yet, conversely, other options exist today because the network is not yet being utilised at full capacity.
Focusing on improving the customer experience now, several “no new infrastructure” options are available that collectively:
• increase peak services by almost 10%, including four new express services from Western Sydney;
• lower congestion on the services most susceptible to causing unreliability across the network;
• lower congestion on Central and Town Hall Stations’ platforms and concourses; and
• improve journey times for customers whose journeys include an interchange between train services.
Key to implementing these options now, and planning the right options for the future is measurement. The current metrics guiding the delivery of public transport are not yet customer focused. In order to address the expectations of the travelling public the governing metrics will need to directly target customer experience while also informing Transport for NSW on operational and planning targets.
A review of international best practice within and outside of public transport provides a set of seven metrics; the first five target network operations and the last two, target policy and planning:
1. Overall Passenger Journey Time 2. Passenger Journey Time Reliability 3. Seating Availability
4. Service Frequency
5. Perceived Passenger Security
6. Ratio of population within 800m of a rail system station
7. Network-wide seat availability wait time The refocusing of public transport services on customer experience is an important first step. Implementing the available “no new infrastructure options” today, and achieving the desired
improvements tomorrow, is dependant on the careful framing of relevant performance metrics.
The Federal Government has recently published its
Our Cities, Our Future national urban policy. This
policy strongly focuses on transport infrastructure as a core enabler of a prosperous Australia, and viewed across the priorities of productivity, sustainability and liveability. The policy indicates that for public transport a chasm exists between the current state of affairs and the necessary future.
The National and State themes of a growing and ageing population, the end of ‘cheap’ energy and the pricing of carbon all point towards increased demand for public transport. In fact, these factors point to society fundamentally shifting its choices regarding land and transport use.
In considering Sydney’s rail network over the past forty years, it is an important reflection that while Sydney’s population has doubled, the capacity of the train services on the rail network has only increased by 37%. Almost all of this increase came from the introduction of the Eastern Suburbs line in 1979 and the corresponding increases in train services on the Illawarra, East Hills, and ultimately, Campbelltown lines. This comparative under-development of the rail network has only been viable due to the shift away from rail to private cars that occurred in the 1960s and 1970s. In a growing Sydney, the bias for private cars is
unsustainable. This observation points to the possibility of returning to the network use of the 1950s if the network adequately served the metropolitan area - a shift that equates to a near 50% increase in demand over and above the reference growth rates.
Preamble
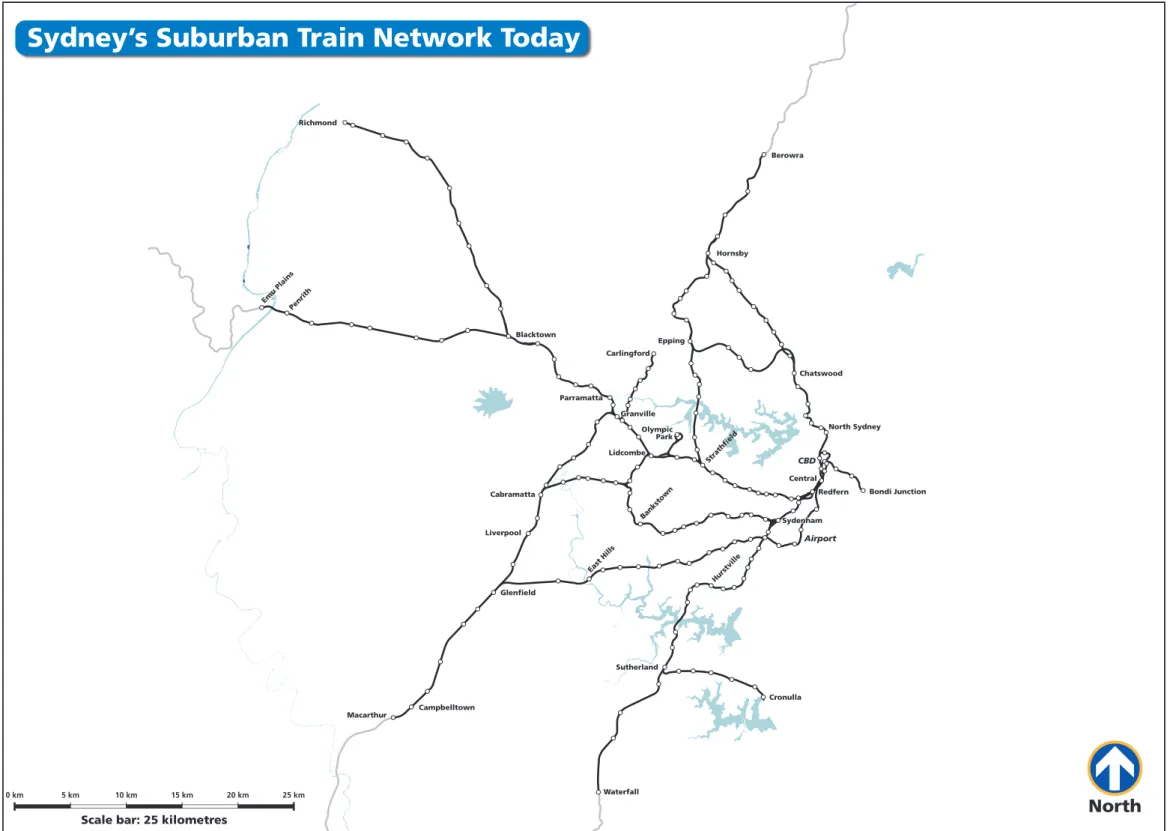
Richmond Cronulla Hurstville Airport Bondi Junction Lidcombe Strathfield Blacktown Hornsby Penrith Sutherland Chatswood Epping Carlingford Parramatta Berowra North Sydney Glenfield Campbelltown Macarthur Emu Plains Cabramatta Liverpool Olympic Park Waterfall Sydenham Sydenham Granville Granville East Hills East Hills Bankstown Bankstown Central Central Redfern Redfern CBDSydney’s Suburban Train Network Today
Scale bar: 25 kilometres
North
5 km
0 km 10 km 15 km 20 km 25 km
Capability Statement
9
8
The Tipping Point Institute
planning in the past, will generate fundamentally better operational approaches and service outcomes. New South Wales is now gearing up to undertake a level of investment in transport infrastructure not seen in almost a century. This focus is a great opportunity to shift Sydney’s transport onto a sustainable path where it once again enables rather impedes the State’s economy. However, utilising this opportunity means dramatic action and the ill-fated Sydney CBD Metro is a public example of the downside risks. The real cost of that project – in the misdirection of the limited pool of skilled resources and the industry’s lost confidence in public sector procurement – unfortunately far exceeds the $500+ million cost to Treasury.
The long lead times, financial scale and mutually-exclusive nature of transport infrastructure alternatives, mandates the need for a very clear strategic target and for clarity about how performance is then measured against that target. A clear set of measures for performance at appropriate settings for each part of the service can then enable an improved customer experience.
Customer centric design is the current focus of business. In Australia, the large service based corporations are rebuilding their processes around the customer experience – so too is Transport for NSW. Since 19 April 2011, the department has been re-structuring around Customer Experience – including establishing a Deputy Director General to lead a team targeted to “define what the NSW transport system has to deliver from a customer perspective in order to increase customer satisfaction and usage of the system”.
The rebuilding in the private sector has started from a base where business had already been customer focused. In the public sector it is far less clear if the customer has been the prime stakeholder. Actions such as the 2004 slowing down of the timetable to improve its performance suggests that RailCorp, as an organisation, has not had a customer focus. There is clearly a significant journey in shifting to a target of improving customer experience.
This paper aims to inform debate on the planning and operation of public transport in Sydney in the context of this journey. Focusing on rail as the core element, options to improve the customer experience today and initiatives to drive long term improvement are proposed.
Sydney’s rail network is now congested to a point where it is impeding the State’s economy. The common approach to addressing this ‘problem’ has been one or more multi-year, multi-billion dollar infrastructure projects. This solution need not
necessarily be the only option. The Government’s focus on customer experience provides a genuine opportunity for improving the services provided by public transport operators through shifting the approach to the ‘problem’. Doing so requires, at the very least, measurement of customer experience at a granular level – granular enough to optimally guide decisions on present infrastructure and the evaluation of future options.
Once measured, and preferably constantly measured in a ‘big data’ fashion, it is possible to re-target to a set of new metrics. The power of metrics should not be under-estimated. An overly strong bias on metrics such as journey time can drive counter-intuitive planning such as the timetabling of services that stop at too few stations – not actually fill with passengers before reaching the CBD. Paradoxically, today’s singular focus on “on-time” running can drive service compromising responses such as adding the insult of skipping timetabled stations to the inconvenience of late running, so as to return the service to on-time operation. This outcome is no accident. Every part of the customer experience is realised from the service provider’s focus on the metrics that govern their performance.
Crucially, sub-optimal customer experience can emerge from each component of the service – from demand analysis through project definition, operational planning, service modelling, operation and finally legacy management. A better set of metrics, that differ from those which guided
Introduction
Improving Customer Experience
9
Customer experience for the Sydney CityRail service, operated by RailCorp, is primarily measured by on-time-running and seating capacity. They are defined as:
• A service is not on time when less than 92% of services arriving in the peak direction at Central are within 5 minutes and 59 seconds of their timetabled arrival time; and
• There isn’t sufficient seating capacity once the train is 135% loaded, meaning that the number of standing passengers is equal to 35% of a fully-seated load.
The question is what do these two metrics, by definition, really tell us about the service that customers are actually experiencing? Just as importantly, is there clear guidance as to how to improve that experience based on the metric and how was it calculated?
The disconnection between the goals of RailCorp and customer experience results in a service that contains a number of unintentional inefficiencies. The complexity of operating the network means that these inefficiencies have crept in over time and are now a daily source of customer frustration.
Take the AM peak cross platform interchange from Inner-West Services to North Shore services that occur at Central from platforms 17 to 16 as an example. There are currently a considerable number of passengers who need to change between these services to get from the Inner-West Line to the North Shore.
The Inner-West services arrive at Central platform 17 approximately every 15 minutes and trains crossing the bridge operate almost every 3 minutes. The problem is that the first North Shore train arriving on Platform 16 that Inner-West passengers could change onto is usually only proceeding to North Sydney.
The next train that will proceed through to St Leonards and Chatswood is then usually so full that nobody can change onto it – resulting in service delays due to a long dwell time in the platform. The next train is then an opportunity to squeeze on and continue to Chatswood, but not before another long dwell time at Central, which is again repeated at Town Hall when that same service arrives there and more passengers must swap past each other to alight and board. The overall delay for a passenger at Central can be as much as 9 or 10 minutes before the interchange has been achieved. Services proceeding to the North Shore are often delayed by as many as 6 additional minutes due to extended dwell times at both stations.
This problem could be partially remedied by reconfiguring the arrival times of the Inner-West Trains (on Sector 2) to ensure that they arrive at Central just before the more lightly loaded “Slow West” services which should themselves be extended to operate through to Gordon (not terminate at North Sydney). This would alleviate most of the passenger delay and reduce the platform dwell time of the previously affected services.
Notably, this is a minor change not greatly impacting the operations or the costs of service delivery and the fact that it hasn’t been implemented is not due to a failure in planning. Simply, the inconvenience it addresses is not measured and ‘you cannot count on what you do not measure’.
This is only one interchange point of one service combination on the network. Given the right metric, similar analysis would be conducted at a number of service delay points around the network to determine if such timetabling adjustments would improve service efficiencies and enhance the customer experience.
This is only the tip of the iceberg. The lack of relevant metrics means that many potential service enhancements are not being implemented. Measures such as refining stopping patterns and speeding up run times to reduce crowding on overloaded services, or adding additional services, could both be introduced to supplement capacity. The overall result of the timetable analysis would be less crowded services and an increase in the number of fast services during peaks.
Customer experience is not only constrained because it is not the focus of improvements, but also because retaining it when real-time operational disruptions occur is also overlooked. Take a late running train, to improve the results for on time running RailCorp makes real time operational adjustments such as skipping stops and not running the service to the
end of line. These actions, in the name of meeting performance targets, actually lower the customer experience. Most of the on-time running the action creates applies to empty trains heading against the direction of demand – and perceivably have little impact. However, this is not the case as perceived by the individual passengers affected.
It is material that RailCorp does not have the capacity to measure actual passenger loading on each service. This means the metric is fundamentally qualitative and opaque. The nature of a suburban rail service means the loading of any given train at a station is volatile, with detail hidden by diluting them into averages. That is, by mixing the loading figures of popular but overcrowded trains with the figures for lightly used services that stop at less popular stations on the same line – the real and observed over-crowding can vanish in the current metric. This uneven congestion is evident on Sydney’s network in what is known as “poor load balance” – a situation where overcrowded services are immediately followed by half empty ones.
In Sydney, despite the potential validity of seating capacity or over-crowding metrics, the current methodology results in poor outcomes. Potentially, even the same metric, developed so as to not obscure the network behaviour, would instead support achieving a better load balance between all services on all lines and provide an improvement in service quality for many customers.
Capability Statement
13
12
The Tipping Point Institute
Sydney’s rail network is not operating at capacity. At the same time – it is congested to a level that forces customers to use alternative means of transport. The network does not serve large parts of Sydney and becomes highly unreliable across much of the network from single – apparently minor – events. There would appear a broad range of potential for improving the network’s performance.
In fact there have been too many proposals to improve the service outcomes for customers, each with their benefits, costs and negative impacts.
Recent Proposed Enhancements
• Speeding up the timetable to provide services that achieve similar run-times to those some 8 years ago [That is, back to before services were slowed to achieve better “on-time-running”];
• Introduction of additional fast services that are dependent on new infrastructure [A dependence meaning the cost started now with the benefit not present for many years in the future];
• Re-signalling significant proportions of the network to safely permit increasing the frequency of services [This being proposed each time without the analysis of the impact on journey times];
• Duplicating the rail crossing of the Harbour [A proposal that does not consider the operational interface so as to improve customer experience].
This paper recommends that a more pragmatic approach to customer service improvements should be fully investigated. An approach that examines the network’s full potential to deliver service enhancements using the infrastructure already available today. This is not to say that network expansion is not required to facilitate forecast growth. Rather, it is suggested that the network should be optimised before the additional trains from the proposed new lines can be accommodated. Any investigation should start with assessing spare capacity. There is currently some spare line capacity in the city circle and at Central’s terminating
platforms. Unfortunately, the source of the network’s current congestion problems is not on the services that can access this capacity. The key to utilising this spare capacity is to leverage the complexity of the network to its own advantage. The network has multiple paths that a train can take to get from one origin to a destination and at many stations on the network a customer has more than one train service that serves their destination. That is, the suburban rail network is flexible and can respond to demand in more than one way.
An examination of the options to utilise this spare capacity provides three opportunities that could allow up to an additional 10 trains per hour – all without investment in additional track infrastructure:
1. Four additional express trains on the Western Line
2. Four additional semi-fast trains from
Liverpool/Cabramatta via the Bankstown Line 3. Two additional fast services from
Campbelltown/Macarthur via the East Hills Line and Sydenham.
Improving Customer Experience Today
Improving Customer Experience
13
12
The Tipping Point Institute
Star City Pyrmont Bay Convention Exhibition Centre Paddy’s Markets Capitol Square John St Square Hawthorne Leichhardt NorthLilyfield
Rozelle BayJubilee Park Glebe Wentworth ParkFish Market
Marion Taverners Hill Dulwich Grove Arlington Waratah Mills St James Circular Quay Wynyard Town Hall BondiJunction Edgeclif f Kings Cross Martin Place Central Redfern Museum Erskineville St Peters Sydenham Macdonaldtown Newtown Stanmore Petersham Lewisham Summer Hill Ashfield Homebush Flemington Auburn Croydon Burwood Strathfield Eastwood Denistone West Ryde Meadowbank Rhodes Concord West North Strathfield Olympic Park Green Square Mascot Woonona Bulli Thirroul Austinmer Coledale Wombarra Scarborough Coalcliff Stanwell Park Otford Helensburgh Bellambi Port Kembla
Port Kembla North Cringila Lysaghts
Albion ParkDapto
Kembla Grange RacecourseUnanderra Coniston
Wollongong
North WollongongFairy Meadow TowradgiCorrimal Bomaderry (Nowra) Berry Gerringong Kiama Bombo Minnamurra Dunmore (Shellharbour) Oak Flats Wolli Creek Oatley Waterfall Heathcote Engadine Loftus Sutherland Jannali Como Mortdale Penshurst Hurstville Allawah Carlton Kogarah Rockdale Banksia Arncliffe Milsons Point North Sydney Waverton Wollstonecraft St Leonards Artarmon Chatswood Roseville Lindfield Killara Gordon Pymble Turramurra Warrawee Wahroonga Waitara Cronulla Woolooware Caringbah Miranda Gymea Kirrawee Marrickville Dulwich Hill Hurlstone Park Canterbury Campsie Belmore Lakemba Wiley Park Punchbowl Bankstown Yagoona Birrong Lidcombe Turrella Bardwell Park Bexley North Kingsgrove Beverly Hills Narwee Riverwood Padstow Revesby Panania East Hills Holsworthy Camellia Rosehill Rydalmere Dundas Telopea Carlingford Liverpool Cabramatta Warwick Farm Glenfield Campbelltown Macarthur Clyde Narara Niagara Park Lisarow Ourimbah Tuggerah Wyong Warnervale North Warnervale Wyee Morisset Dora Creek Gosford Woy Woy Hornsby Berowra Fassifer n
BooragulTeralbaCockle CreekGlendale
Cardif f Kotara Adamstown Broadmeadow HamiltonWickham Civic Newcastle Edm onds on Pa rk Leppington Falconbridge Linden Woodford Hazelbrook Lawson Bullaburra Wentworth Falls Leura Katoomba Medlow Bath Blackheath Mount Victoria Bell Zig Zag Lithgow Doonside Rooty Hill Mount Druitt St Marys Werrington UWS Kingswood Penrith Emu Plains Quakers Hill Schofields Riverstone Vineyard Mulgrave Windsor Clarendon East Richmond Richmond North Ryde Macquarie Park MacquarieUniversity Granville Blacktown Harris Park Parramatta Westmead Wentworthville Pendle Hill Toongabbie Seven Hills Marayong Waratah Warabrook (University) Sandgate Hexham Tarro Beresfield Thornton Metford Victoria Street East Maitland High Street Maitland Telarah Mindaribba Paterson Martins Creek Hilldale Wallarobba Wirragulla Dungog Springwood Bathurst Kelso Raglan Yetholme Meadow Flat Mount Lambie Wallerawang Lapstone Glenbrook Blaxland Warrimoo Valley Heights Domestic Airport International Airport Picton Douglas Park Menangle Menangle Park Yerrinbool Bargo Tahmoor Sefto n Ches ter H ill Leig hton field Villa wood Carra mar Yennora Guildford Merrylands Fairfield Canley Vale Cheltenham Beecroft Pennant Hills Thornleigh Normanhurst Casula Leumeah Minto Ingleburn Macquarie Fields Epping Tempe Colo Vale Hill Top Balmoral Buxton Couridjah Thirlmere Mittagong GoulburnMarulan TallongWingello PenroseBundanoon
ExeterMoss Vale
BurradooBowral Burrawang Robertson Awaba Blackalls Park Toronto Branxton Singleton Muswellbrook Aberdeen Scone Lochinvar Greta
AsquithMount Colah Mount Kuring-gai
Direct services operate during special events only
CowanHawkesbury RiverWondabyne Koolewong Tascott Point Clare Berala Regents Park Diesel service
South West Rail Link
(under construction)
Diesel service
Some Southern Highlands services operate directly to and from Central
Station access fee applies at these stations Advance booking
required for travel on this bus service
Advance booking required for travel on this bus service
Diesel service
Dulwich Hill Tram Line (under construction)
Peak hours only
Peak hours only
Weekends and some weekday services only
Sydney Metropolitan Area
City Circle Central Coast Hunter Newcastle Southern Highlands Illawarra Southern Tablelands South Coast Blue Mountains Central Tablelands Hawkesbury River Sydney Harbour Botany Bay
South Pacific Ocean
Lake Illawarra Port Hacking Parramatta River Georges River
Copyright Netzplan June 2011
North
Olympic Park Sprint & Special Events Services
Direct services during special events only
Carlingford Line
Carlingford to Clyde via Rydalmere
Northern Line
Hornsby to Epping via Town Hall
Western Express Line
Emu Plains to Central via Strathfield
Peak Hours Only
Central Coast to City via Chatswood
North Shore & Western Line
Berowra to Emu Plains or Richmond via Granville
South Line
Campbelltown to Museum via Granville
Peak Hours Only
Macarthur to Town Hall via Sydenham
Airport & East Hills Line
Macarthur to Town Hall via Airport
Cumberland Line
Campbelltown to Blacktown via Liverpool
Inner West Line
Homebush to Museum via Strathfield
Bankstown Line
Lidcombe or Liverpool to Town Hall via Sydenham
Eastern Suburbs & Illawarra Line
Waterfall or Cronulla to Bondi Junction
Newcastle & Central Coast Line
Newcastle to Central via Strathfield
Blue Mountains Line
Lithgow to Central via Strathfield
Southern Highlands Line
Goulburn to Campbelltown (or to Central via East Hills)
Weekends/Some Weekday Services
South Coast Line to Bondi Junction
South Coast Line
Bomaderry or Port Kembla to Central via Hurstville
Under Construction
South West Rail Link to Leppington
Under Construction
Lilyfield Line extension to Dulwich Hill
Hunter Line
Scone or Dungog to Newcastle via Maitland
Lilyfield Line
Central to Lilyfield via Star City (separate fares apply)
Toronto to Fassifern Bus Bathurst to Lithgow Bus Bowral to Picton (Loop Line) Bus South Coast to Southern Highlands Bus
Train Interchange
Sydney Suburban Train Lines
Intercity Train Lines
Regional Train Lines
Tram Line
Symbols Rail Bus Services
with Western Express
Key to Lines & Symbols
Greater Metropolitan
Train Network
The improved customer service of this set of services is not limited to the added capacity and faster service they provide to the parts of the network they directly serve. In fact the greatest benefit is provided by customers switching from their current service to these new preferred services. The switch away from the current service reduces congestion for that service. The current services of these switching customers are overcrowded and this overcrowding is to a point that is causing extended dwell times at stations as customers jostle passed each other alighting and boarding a full train. Extended dwell times are the main cause of unreliability of the CityRail service.
The benefits of these new services are network wide: • Extra capacity on the through services heading
to the North Shore from The West;
• Improved reliability of services sensitive to the extended dwell times currently experienced; • Spare capacity on the South services running
through Fairfield, Merrylands, Granville, Auburn and Lidcombe;
• Additional capacity on the Bankstown Line in the form of new express services from Liverpool via Sydenham; and
• Spare capacity on the Airport Line as more Campbelltown passengers are diverted onto the faster route via Sydenham.
This type of service and passenger flow redistribution is a standard solution to network overcrowding on the Suburban Rail Systems of Europe. It represents the simplest and cheapest way to provide immediate capacity relief whilst also offering additional faster services. It is recommended that these options to optimise the network’s operating efficiency are investigated prior to considering the value of proposed infrastructure upgrades for improving customer experience.
RailCorp is constrained in optimally utilising the network due to a lack of rolling stock given the current operational plan, timetable implementation and controlling metrics. The shift to the new target of customer experience changes the plan, timetable and metrics – and as a result changes the rolling stock dynamics.
A common approach in operating suburban rail networks is to retain some rolling stock stabled across the network, to provide replacement services when the scheduled rolling stock cannot run the required services. Calculations of the optimal amount of retained rolling stock respond to the performance measure placed on RailCorp. The issue is compounded when services require specific rolling stock such as the services via the Epping Chatswood Rail Link and the outer-suburban services.
Nevertheless, given a different performance measure, more or less rolling stock would be retained.
There is a lack of survey data regarding the preferences of Sydney’s commuting public. It is therefore not currently possible to evaluate if running services at a higher rolling stock utilisation rate to help alleviate congestion – but at the cost of slightly increased service cancellations – would deliver a better customer experience or not. It is recommended that studies be made to provide guidance to such key service planning considerations.
In any case, the only barrier to delivering this alternative is the performance measure that the operator is targeted to achieve.
Notwithstanding all the efforts to improve rolling stock utilisation and availability, for the next few years at least, rolling stock constraints will prevent expansion of service before infrastructure constraints do. In this circumstance, the key to delivering improved customer experience is the consideration of the metrics at a granular service and line segment level.
The performance of the service is not equal across the network. A transport network’s higher order goal to support economic vitality suggests that certain levels of congestion are to be avoided at the cost of increasing congestion elsewhere. This is particularly the case where the congestion begins to impact safety. A fine grain monitoring of metrics provides the capacity to robustly inform policy formation on optimising train services for Sydney.
Capability Statement
17
16
The Tipping Point Institute
16
The Tipping Point Institute
Analysis of the current Standard Working Timetable of the Sydney CityRail Network has revealed that a number of opportunities exist to introduce additional faster services on some lines running to some city destinations. If these services are implemented they will represent a significant service improvement for passengers who choose to use them instead of the existing overcrowded services that will continue to service the current destinations. By diverting these passengers onto the additional services, space will be freed-up to relieve overcrowding and accommodate some additional patronage growth.
“No new infrastructure” West Express Services
Four additional fast services for the West
A redistribution of Fast West Suburban and West Intercity services on the Main West Line will facilitate the operation of up to 4 additional Express Suburban services from Penrith via Blacktown, Westmead, Parramatta, Strathfield and into Central Terminal. These new Express Suburban services will be up to 3 minutes faster into Central, offering an attractive alternative for passengers heading there when compared to the existing overcrowded services running through the CBD to the North Shore. In the morning peak, more than 5,000 passengers disembark services from the West at Redfern and Central. The new faster services heading to those two destinations provide a preferred service for these customers. The switch made by these customers to the new services frees-up capacity on the existing services from their stations of origin in western Sydney right through the CBD and over the Harbour Bridge to the North Shore. Notably, this represents a similar passenger service outcome as that expected from the multi-billion dollar “Western CBD Relief Line” proposed by the previous NSW Government without the cost of, or the wait for, the new infrastructure.
200% increase in fast services for Liverpool
Four additional fast services for Liverpool via Bankstown
Analysis of the service patterns on the Bankstown Line has also indicated that an improvement in the stopping patterns on this line will facilitate the speeding up of all services on the line and will also allow up to 4 additional fast services from Liverpool to be slotted in-between the local services. The net result will be 4 additional faster services to the City from Liverpool/Cabramatta, faster services all along the Bankstown Line and the corresponding relief of overcrowding on the existing South Line services running via Fairfield, Granville and Auburn.
50% increase in fast services for Macarthur
Two additional fast services for Macarthur via Sydenham
A redistribution of services on the East Hills line after the completion of the Kingsgrove to Revesby clearways project will allow the operation of two additional fast services an hour from Macarthur/ Campbelltown to the City via Sydenham. This will also allow either 2 additional local services via the Airport line to be commenced at Revesby, or, existing services from Campbelltown via the Airport to be relieved of overcrowding as passengers move over to the additional faster services via Sydenham.
The net outcome will be two additional faster trains for the Campbelltown line plus approximately two train loads worth of spare capacity on the Airport line during the peak periods. This is an improvement on the current situation where Airport passengers with baggage struggle to board overloaded city-bound trains originating out of Campbelltown. The adjoining diagram demonstrates how these additional services would “fit” into the timetable blueprint, known as a train plan. Further details regarding these service redistributions and capacity enhancements on the existing network are contained in Appendix A.
Operating the Additional Services
Accessing the capacity with “no new infrastructure”
No morning peak period Cumberland Line services from Blacktown to Liverpool
3 1 1 2 3 4 1 2 4 2, 3 1 4 5 7 1 3 1 2 1 or 2 3 12 4 3 4 6 1 3 4 0 1 3 4 1 1 3 7 11 5 3 1 24 16 17 18 20 21 1 2 5 4 6 1 2 3 2 1 6 5 4 3 1 2 2 1 5 4 1 2 1 1 2 1 2 3 3 1 2 3 1 2 2 1 3 4 4 Bankstown Lidcombe Homebush Strathfield Sydenham Wolli Creek Airport Sutherland Waterfall Cronulla Macarthur Campbelltown Glenfield Liverpool Revesby Kingsgrove
from Southern Highlands
Epping
Parramatta
North Sydney
from South Coast
Ashfield Cabramatta Blacktown Olympic Park Redfern Town Hall Wynyard Riverstone Richmond St Marys Penrith/ Emu Plains Chatswood St Leonards Hornsby Berowra Hurstville from Blue Mountains Museum St James Bondi Junction Martin Place Circular Quay Clyde Carlingford Granville
from Central Coast
Gordon Quakers Hill Central (terminating) (terminating) (terminating) (terminating) Westmead Seven Hills from Newcastle
peak direction services (varying times at Central)
maximum hourly
Starting services Number of services, by CityRail line, on each peak direction track
4 4 4 4 4 8 8 4 4 4 3 5 4 4 2 4 2 4 4 4 10 5 14 4 4 2 164 14 10 4 44 8 6 6 16 4 2 2 3 4 4 2 2 2 4 6 4 6 4 4 4 4 8 2 4 10 6 6 4 10 4+4 6 6 2 4 4 4 2 2 6 2 6 6 6 4 4 6 6 4 16 16 4 162 2 16 16 2 4 16 4 16 6 6 6 14 14 6 6 6 4+4+2 6 4 8 8 4 4 6 6 10 10 10 2 2 (from city) 4 4 8 4 4 12 8 412 4 4 4 2 10 4 4 4 46 4 +4 12 4 4 14
Train services shown as immediately adjacent lines of different colours share the same tracks. Train services shown as separated coloured lines are on separate tracks. 6 2 4 2 2 10 4 (terminating) 2 4 6 6 4 4 10 4
Eastern Suburbs and Illawarra Line Bankstown Line
Inner West Line Cumberland Line (to Blacktown) Airport and East Hills Line South Line
North Shore Line and Western Line Northern Line
Carlingford Line Olympic Park Sprint Intercity Lines
For simplicity, train stopping patterns are generally not shown in this diagram, and the train services do not necessarily stop at all the stations shown on their routes.
2012
(Max with
4 spare
for SWRL)
1 5 3 4 1 2Proposed 2012 timetable without SWRL, weekday morning peak
6 6 6 6 1 2 5 1 2 4
Improving Customer Experience
17
16
The Tipping Point Institute
Figure 3: 2012 AM Peak One-Hour Train Plan (Inbound Only) for the Sydney Suburban Train Network including 4 Western Express Services, 2 Additional Fast Services from Macarthur via Sydenham, and 4 Additional Fast Services from Liverpool via Bankstown.
Metrics are powerful tools. Since the beginning of Industrialisation, measurement of performance has defined the customer experience. In Sydney, the suburban rail network is measured first by safety and then by “on-time-running”. Safety as a metric has limited utility as safety systems are only truly measured on failure. In contrast, “on-time-running” is a metric that can be dynamically measured and is within the control of the stakeholders. Measuring “on-time-running” is relatively simple, and setting such a target is relatively easy to do and to communicate. The question is: “Does better “on-time-running” really provide what customers want?” Most passengers do not care if the train they catch is late so long as it does not affect their own journey time. If the same train runs every ten minutes, does it matter if it runs ten minutes late? Not to the passenger – but it does if the service is only measured by an “on-time-running” metric.
If, to remedy that problem the operator chooses to skip stops to get the train back on time then this will have a more significant impact on the passengers left behind than allowing the trains to continue running ten minutes late. It may be missing the point to measure on-time running where the customer’s experience is all about their journey time.
The risk involved in ill-conceived metrics is that the service provider can appear to be achieving good performance yet fail to deliver a good customer experience or improve passenger focused outcomes. In Sydney, this risk became a reality because
“improving” the performance of the rail network was achieved by slowing journey times and removing services to achieve better ‘on-time-running’. Therefore, linking the policy goal of improving customer experience to the planning and governance of the service is dependant on choosing the right performance to measure and the metric that it represents. The metric must be carefully defined to ensure that it is systematically measurable, that it is correlated to how well the service is meeting its intended outcomes, and that it is relevant to the customers it was intended to serve.
In exploring which performance metrics are able to measure different outcomes, it is helpful to categorise those outcomes. One approach is to categorise them into three core groups:
1. Customer Experience outcomes; 2. Economic outcomes; and
3. Management Proficiency outcomes.
New Metrics
The Key to Improving Customer Experience
This approach seeks to address the issue that a single metric may be viewed in more than one way. “On-time-running”, for example, can be viewed either as a metric for passenger experience or alternatively, for management proficiency. To date, in Sydney’s rail network, this metric has only been viewed in terms of Management Proficiency, implemented as a metric of train movements against a timetable. In contrast, on time running could be implemented as a metric concerning the on time arrival of passengers and therefore be viewed in terms of Customer Experience. These approaches may appear to provide clear guidance to policy and governance in transport, but consider the metric “route kilometres travelled out of service” (or “dead running”). On the one hand it is a guide to efficiency and lends itself to both economic and management proficiency outcomes. Yet as it is a result of the interaction of the train plan with the constraint of stabling at the start and end of services, improving it unilaterally will typically result in fewer services. However, to improve customer experience, without impacting proficiency, involves investment in infrastructure that impacts economic outcomes. Hence, the metric is not providing clear guidance.
Each metric informs each stakeholder differently. It is important to take each one in context and acknowledge how each is interpreted. The selection of the metrics, and more particularly the target values for each metric, is a matter for policy and a strategic choice for Government. Take, for example, the metric for the ratio of trips that include public transport. If the policy and strategy is to demonstrate good performance and improve the morale of public transport’s frontline staff, then the target will be set as a value close to today’s observed value. In contrast, if the target is part of a policy to address the economic costs of congestion, then it might be set at twice the current observed value.
The announcement that the new Integrated Transport Authority in NSW is focusing on customer experience indicates a fresh approach. Turning this new approach into a new reality for transport services will need new metrics.
Capability Statement
21
20
The Tipping Point Institute
In reviewing the reporting by rail network operators serving more than twenty metropolitan cities across the globe, it is clear that service performance is not proactively reported by operators or governments. This is not to say that metrics are not reported in annual reports or that private sector operators do not have contractual performance metrics. The gap is that the metric is not targeted to inform the customer of their likely experience, reflect the experience they can personally recall, or be evaluated frequently enough to have relevance.
The review suggests cultural bias for the importance of reporting by public transport operators and a negative correlation between transport as a socio-political topic and the reporting. That is, the more that public transport was seen as performing, the less prevalent the reporting of metrics. Surprisingly, the review indicates that there are metrics that can be directly applied to Sydney’s rail network that will drive change to improve the customer experience. One potential was the ‘Lost minutes’ metric used by Transport for London (TfL). On first glance, it would appear a useful metric. However, the method for its calculation is not transparent and incorporates qualitative judgements, for example, references to ‘normal congestion’. As a time series the metric is useful in informing the customer of improvement trends, but what exactly does having a service with “4 lost minutes” mean? Does this mean customers can expect to consistently have a trip 4 minutes longer than it should be? Or that if they use the network over the reporting cycle period they will be delayed 4 minutes and how often?
The conclusion is that rather than providing direct guidance as to what to measure Sydney’s transport
network by, the international experience informs us what the metric needs to integrate together in order for it to be widely adopted and make a difference to customer experience.
In considering the ‘Lost minutes’ metric, the complexity in its formulation is such that it can’t inform planning by the operator or by policymakers as to what actions will improve it. Thus, the review of this metric provides two key lessons. Firstly, metrics need to mean something to the target audience without education and more importantly, a metric will only be effective if the methodology of how it is calculated is able to provide guidance for actions to improve it.
Seeking to foster discussion, a set of metrics is proposed. In some form or other, the international railways that are recognised for their customer service quality including the London Underground, the Paris RER, the Zurich S-Bahn and the Long Island Rail Road (NY) collectively have metrics that align into the following:
1. Overall Passenger Journey Time (where shorter is better)
2. Passenger Journey Time Reliability (where predictability is better). This is not the on-time running of trains
3. Seating Availability (where utilisation rates are targeted towards 110% to assist reliability) 4. Service Frequency (where more is better until
8 trains or more per hour are offered) 5. Perceived Passenger Security (where
on-board staff improve the perceived safety of the service)
Line length, station spacing and service frequency all contribute to service journey time. Journey time influences the need for seating availability. Understanding the
geographic differences between “Metro” and “Suburban” railway networks is the key to unlocking how to plan the
best operational response, select the best rolling stock, and define the right metrics to govern the service. It is no coincidence that the networks with larger geographic spread have branched lines, mixed stopping patterns and double-deck trains.
Operational Metrics
An International Review
20
The Tipping Point Institute
Richmond Cronulla Hurstville Airport Bondi Junction Lidcombe Strathfield Blacktown Rouse Hill Hornsby Penrith Sutherland Chatswood Epping Carlingford Parramatta Berowra North Sydney Glenfield Campbelltown Macarthur Emu Plains Cabramatta Liverpool OlympicPark Waterfall Sydenham Sydenham Granville Granville Leppington
Leppington East HillsEast Hills
Bankstown Bankstown Central Central Redfern Redfern CBD Castle Hill
Sydney Suburban Train Network
Scale bar: 25 kilometres
Sydney North 5 km
0 km 10 km 15 km 20 km 25 km Paris
North with Paris Metro Overlay
Richmond Cronulla Hurstville Airport Bondi Junction Lidcombe Strathfield Blacktown Rouse Hill Hornsby Penrith Sutherland Chatswood Epping Carlingford Parramatta Berowra North Sydney Glenfield Campbelltown Macarthur Emu Plains Cabramatta Liverpool Olympic Park Waterfall Sydenham Sydenham Granville Granville Leppington
Leppington East HillsEast Hills
Bankstown Bankstown Central Central Redfern Redfern CBD Castle Hill
Sydney Suburban Train Network
Scale bar: 25 kilometres
Sydney North 5 km
0 km 10 km 15 km 20 km 25 km HK
North with Hong Kong Metros Overlay
Richmond Cronulla Hurstville Airport Bondi Junction Lidcombe Strathfield Blacktown Rouse Hill Hornsby Penrith Sutherland Chatswood Epping Carlingford Parramatta Berowra North Sydney Glenfield Campbelltown Macarthur Emu Plains Cabramatta Liverpool OlympicPark Waterfall Sydenham Sydenham Granville Granville Leppington Leppington East Hills East Hills Bankstown Bankstown Central Central Redfern Redfern CBD Castle Hill
Sydney Suburban Train Network
Scale bar: 25 kilometres
Sydney North 5 km
0 km 10 km 15 km 20 km 25 km Singapore North with Singapore Metro Overlay
Richmond Cronulla Hurstville Airport Bondi Junction Lidcombe Strathfield Blacktown Rouse Hill Hornsby Penrith Sutherland Chatswood Epping Carlingford Parramatta Berowra North Sydney Glenfield Campbelltown Macarthur Emu Plains Cabramatta Liverpool OlympicPark Waterfall Sydenham Sydenham Granville Granville Leppington
Leppington East HillsEast Hills
Bankstown Bank stown Central Central Redfern Redfern CBD Castle Hill
Sydney Suburban Train Network
Scale bar: 25 kilometres
Sydney North 5 km
0 km 10 km 15 km 20 km 25 km Paris
North with Paris RER Overlay
Richmond Cronulla Hurstville Airport Bondi Junction Lidcombe Strathfield Blacktown Rouse Hill Hornsby Penrith Sutherland Chatswood Epping Carlingford Parramatta Berowra North Sydney Glenfield Campbelltown Macarthur Emu Plains Cabramatta Liverpool Olympic Park Waterfall Sydenham Sydenham Granville Granville Leppington
Leppington East HillsEast Hills
Bankstown Bankstown Central Central Redfern Redfern CBD Castle Hill
Sydney Suburban Train Network
Scale bar: 25 kilometres
Sydney North 5 km
0 km 10 km 15 km 20 km 25 km Zurich
North with Zurich S-Bahn Overlay
Richmond Cronulla Hurstville Airport Bondi Junction Lidcombe Strathfield Blacktown Rouse Hill Hornsby Penrith Sutherland Chatswood Epping Carlingford Parramatta Berowra North Sydney Glenfield Campbelltown Macarthur Emu Plains Cabramatta Liverpool OlympicPark Waterfall Sydenham Sydenham Granville Granville Leppington Leppington East Hills East Hills Bankstown Bankstown Central Central Redfern Redfern CBD Castle Hill
Sydney Suburban Train Network
Scale bar: 25 kilometres
Sydney North 5 km 0 km 10 km 15 km 20 km 25 km 157.84 R R R NYC North with NY Long Island Overlay
Figure 4: Geographic Network Overlays, Sydney with various Metros and Suburban Networks. Please refer to Appendix B for more detailed analysis.
Single-Deck – Metro Networks (in Red)
Double-Deck – Suburban Networks (in Red)
Improving Customer Experience
21
It is clear from this initial investigation that selecting high-level metrics is key to the success of the new customer experience focus. Improving the performance of the service against these metrics is dependant on how each metric is utilised across the service delivery lifecycle and should include:
• developing transparent and empirical methodologies to enumerate the metrics; • designing the process of the metric to clearly
inform the Integrated Transport Authority of approaches for improvement;
• embedding the measurement process into operational procedures; and
• setting targets for the metrics at levels representing genuine improvement for the customer experience.
Notably, the metrics considered earlier are operational metrics. There are limits on how well modelling and forecasting of policy and planning choices can provide comparative performance on such a set of metrics. The challenge is that a proposed infrastructure project or alternative train plan will have a mix of influences on the operational metrics, an outcome that shifts the analysis to be overly qualitative. Selecting the ‘better’ option can then become a battle of perception and open to influences not targeted on the best outcome for customers. This suggests there is considerable value for improving the customer experience in metrics that target policy and planning. These metrics still need to be measureable on the existing infrastructure and current network operations. The metrics also need to reflect the impact that new and/or improved infrastructure provides to the service. Two additional metrics meet these criteria:
6. Ratio of population within 800m of a rail system station
7. Network-wide seat availability wait time The first is relatively straight forward with
improvements available from land use changes that increase urban density in the proximity of stations or new transport infrastructure that adds service to locations not currently served by rail. The second is less straight forward but far more useful.
The customer experience metric – Network-Wide Seat Availability Wait Time
Seat wait time is the period from arriving at the station to the availability of a seat on the service. This metric combines the congestion on the service and its frequency. Importantly, the metric differentiates between a lack of seats on short trips from services that are so congested that customers must stand for long periods or are unable to board and must wait for the next service. Further, the metric does not reward frequency without a corresponding demand for the increased seat availability the frequency provides – that is, running empty trains on-time does not offset poor peak performance.
Considering the discussion earlier, it is clear that the metric can be understood without education and that improvements are easily noticed by customers. Importantly, improving seat wait time can stem from all parts of service delivery life-cycle. Starting from policy providing added capacity, to network operational planning balancing demand across service patterns, and even to customer information systems shifting usage patterns, each part of the service’s delivery participates in the network’s seat wait time.
Understanding how metrics affect the operational outcomes on difficult railway networks is sometimes best demonstrated graphically. The following graph shows how “Metro” Railways occupy a very difficult geographical and market niche as compared to “Suburban” Railways. The graph clearly shows that Metro Railways have shorter line lengths and closer station spacing – well-suited to dense inner-city
areas, whereas Suburban Railway lines are much longer with more widely spaced stations – better suited to longer and faster journeys from the lower density suburbs. Double-deck rolling stock then plays an important role in ensuring seating availability on these longer journeys.
Realising Long-Term Improvement
Making Metrics Drive Improved Customer Experience
0 0.5 1 1.5 2 2.5 0 10 20 30 35 40 50 60 Paris Metro London’s B, C, P lines Berlin U-bahn
Hong Kong Metro Madrid Metro
London Northern Line Singapore Metro London’s Metropolitan & District lines
Berlin S-bahn Melbourne Suburban
Zurich S-bahn Long Island RR
& Sydney Suburban
Paris RER Hong Kong’s Suburbans
(includes Airport Express)
Suburban railways usually have their
metrics in this Orange zone
Double Deck Suburban Railways Metros usually
have their metrics in this Green zone
A ve . S tatio n Sp ac in g in k m
Ave. Network Line Length from CBD in km
Suburban Railways longer than this are well-suited to double deck operation (due to long journey times). Railways shorter than
this are well-suited to single deck operation.
Urban Rail Metrics: Metro and Suburban Zones
Figure 5: A Graph Comparing the Core Metrics of Metro Networks and Suburban Rail Networks – Demonstrating the Delineation Boundaries as “Zones” on the graph. It becomes clear that metro railways occupy a very different zone to that of suburban railways, and this fact can be used to better plan the services provided on both network types. Please refer to Appendix B for more detailed analysis.
24
Capability Statement
The Tipping Point Institute
24
References
Frumin, MS 2010, ‘Automatic data for applied railway management: Passenger demand, service quality
measurement, and tactical planning on the London Overground network’, Master’s thesis, Massachusetts Institute of Technology.
Garbutt, P 1989, World metro systems, Capital Transport, Middlesex.
StateRail Rail Development 2001, An introduction to State Rail planning processes for future rail operations in the Greater Sydney metropolitan region, Catalyst Communications, Sydney.
Transit Cooperative Research Program 2003, A guidebook for developing a transit performance-measurement system, Transportation Research Board, Washington DC.
Transport for London 2011, Annual report and statement of accounts 2010/11, Mayor of London, London.
Wikipedia 2011, Commuter Rail, Wikimedia Foundation, accessed 22 August 2011, <http://en.wikipedia.org/wiki/ Commuter_rail>.
I n s t i t u t e
Appendix A: New Service Enhancements
Sydney’s Suburban Rail Service:
Operational Details of Service Enhancement Opportunities
Operational Analysis supporting three zero-infrastructure service enhancements:
1. No-New-Infrastructure West Express;
2. Fast Liverpool via Bankstown Services;
3. Fast Macarthur Services via Sydenham.
T h e
Tipping Point
I n s t i t u t e
Appendix A: New Service Enhancements – Operational Details | August 2011 26
Operational Analysis of Line Capacity and Demand on
the Western Line, Liverpool via Bankstown Line, and Macarthur via Sydenham Line
The following diagrams demonstrate the existing line capacity and service enhancement potential on the Western Line, Liverpool via Bankstown Line and Macarthur via Sydenham Line.
• The first two diagrams are “Network Train Plans” and they show how these extra fast services would fit into the network on the existing lines.
• The next two diagrams are CBD “Track Utilisation Diagrams” which show how these extra services would fit on the available track in the CBD.
• The final three graphs show how demand on each line is matched by the proposed service supply. These are projected out to 2031 to demonstrate how this strategy can be expanded (with subsequent additional infrastructure post 2014) to accommodate the increasing forecast demand from each line.
Although these diagrams do not represent new timetables they demonstrate how the network has the capacity to accommodate these extra services. New timetables would need to be developed to show where these extra services would “fit” between the existing services on each line.
I n s t i t u t e
The existing Sydney Railway network has some spare capacity, if used
carefully, that can allow some additional fast rail services to operate during peak times to selected destinations.
Spare capacity on the Main West tracks into Central Terminal will allow up to 4 extra Fast West (or West Express) services per hour to operate to Central. Spare capacity in the City Circle via Sydenham will allow extra fast services via both the Bankstown and East Hills Lines to operate from Liverpool and/or Macarthur.
Spare space is preserved for SWRL services once they are needed.
Existing Sydney
Network in 2012
This network train plan shows Sydney’s existing rail network in 2012. It includes 4 new “West Express” services, 2 new “Fast Liverpool” via Bankstown services and 2 new “Fast Macarthur” via Sydenham services.
No morning peak period Cumberland Line services from Blacktown to Liverpool
3 1 1 2 3 4 1 2 4 2, 3 1 4 5 7 1 3 1 2 1 or 2 3 1 2 4 3 4 6 1 3 4 0 1 3 4 1 1 3 7 11 5 3 1 24 16 17 18 20 21 1 2 5 4 6 1 2 3 2 1 6 5 4 3 1 2 2 1 5 4 1 2 1 1 2 1 2 3 3 1 2 3 1 2 2 1 3 4 4 Bankstown Lidcombe Homebush Strathfield Sydenham Wolli Creek Airport Sutherland Waterfall Cronulla Macarthur Campbelltown Glenfield Liverpool Revesby Kingsgrove
from Southern Highlands
Epping
Parramatta
North Sydney
from South Coast
Ashfield Cabramatta Blacktown Olympic Park Redfern Town Hall Wynyard Riverstone Richmond St Marys Penrith/ Emu Plains Chatswood St Leonards Hornsby Berowra Hurstville from Blue Mountains Museum St James Bondi Junction Martin Place Circular Quay Clyde Carlingford Granville
from Central Coast
Gordon Quakers Hill Central (terminating) (terminating) (terminating) (terminating) Westmead Seven Hills from Newcastle
peak direction services (varying times at Central)
maximum hourly
Starting services Number of services, by CityRail line, on each peak direction track
4 4 4 4 4 8 8 4 4 4 3 5 4 4 2 4 2 4 4 4 10 5 14 4 4 2 164 14 10 4 44 8 6 6 16 4 2 2 3 4 4 2 2 2 4 6 4 6 4 4 4 4 8 2 4 10 6 6 4 10 4+4 6 6 2 4 4 4 2 2 6 2 6 6 6 4 4 6 6 4 16 16 4 162 2 16 16 2 416 4 16 6 6 6 14 14 6 6 6 4+4+2 6 4 8 8 4 4 6 6 10 10 10 2 2 (from city) 4 4 8 4 4 12 8 412 4 4 4 2 10 4 4 4 46 4 +4 12 4 4 14
Train services shown as immediately adjacent lines of different colours share the same tracks. Train services shown as separated coloured lines are on separate tracks. 6 2 4 2 2 10 4 (terminating) 2 4 6 6 4 4 10 4
Eastern Suburbs and Illawarra Line Bankstown Line
Inner West Line
Cumberland Line (to Blacktown) Airport and East Hills Line South Line
North Shore Line and Western Line Northern Line
Carlingford Line Olympic Park Sprint Intercity Lines
For simplicity, train stopping patterns are generally not shown in this diagram, and the train services do not necessarily stop at all the stations shown on their routes.
2012
(Max with
4 spare
for SWRL)
1 5 3 4 1 2Proposed 2012 timetable without SWRL, weekday morning peak
6 6 6 6 1 2 5 1 2 4
T h e
Tipping Point
I n s t i t u t e
Appendix A: New Service Enhancements – Operational Details | August 2011 28
The existing Sydney Railway network has more spare capacity, if usedcarefully, that can allow some additional fast rail services during the peaks as well as SWRL services to operate.
Spare capacity on the Main West tracks into Central Terminal will allow up to 4 extra Fast West (or West Express) services per hour to operate to Central. Spare capacity in the City Circle via Sydenham will allow extra fast services via both the Bankstown and East Hills Lines to operate from Liverpool and/or Macarthur.
Spare space previously preserved for SWRL services is now utilised by these services.
This network train plan shows Sydney’s existing rail network in 2012. It includes 4 new “West Express” services, 2 new “Fast Liverpool” via Bankstown services, 2 new “Fast Macarthur” and 4 SWRL via Sydenham services.
No morning peak period Cumberland Line services from Blacktown to Liverpool
3 1 1 2 3 4 1 2 5 1 2 1 2 4 2, 3 1 4 5 7 1 or 2 3 4 3 4 6 1 3 4 0 1 3 4 1 1 3 4 7 11 5 3 1 24 16 17 18 20 21 1 2 5 4 6 1 2 3 2 1 6 5 4 3 1 2 2 1 5 4 1 2 1 1 2 3 3 1 2 3 1 2 2 1 4 Eastwood Bankstown Lidcombe Homebush Strathfield Sydenham Wolli Creek Airport Sutherland Waterfall Cronulla Liverpool Revesby Kingsgrove
from Southern Highlands
Epping
Parramatta
North Sydney
from South Coast
Ashfield Cabramatta Blacktown Olympic Park Redfern Town Hall Wynyard Riverstone Richmond St Marys Penrith/ Emu Plains Chatswood St Leonards Hornsby Berowra Hurstville from Blue Mountains Museum St James Bondi Junction Martin Place Circular Quay Clyde Carlingford Granville
from Central Coast
Gordon Quakers Hill Central (terminating) (terminating) (terminating) Westmead Seven Hills from Newcastle
Proposed 2014 timetable with SWRL, weekday morning peak
peak direction services (varying times at Central)
maximum hourly
Starting services Number of services, by CityRail line, on each peak direction track
4 4 4 4 4 8 8 4 4 4 3 5 4 4 4 2 4 2 4 4 4 10 5 14 4 4 2 164 14 10 4 44 8 6 6 16 4 2 2 3 4 4 2 4 2 4 4 4 4 8 4 4 10 6 6 4 10 4+4 6 6 2 4 6 6 6 6 4 4 2 2 6 4 2 2 2 8 8 4 4 8 10 2 16 16 2 162 2 16 16 2 416 416 8 6 6 810 10 8 8 6 6 4+4+2 2 8 8 8 4 10 10 10 (from city) 4 4 8 4 4 12 8 412 4 4 4 10 4 4 4 46 4 +4 12 4 4 14
Train services shown as immediately adjacent lines of different colours share the same tracks. Train services shown as separated coloured lines are on separate tracks. 6 2 4 2 10 4 (terminating) 2 4 6 6 4 4 10 4
Eastern Suburbs and Illawarra Line Bankstown Line
Inner West Line
Cumberland Line (to Blacktown) Airport and East Hills Line South Line
North Shore Line and Western Line Northern Line
Carlingford Line Olympic Park Sprint Intercity Lines
For simplicity, train stopping patterns are generally not shown in this diagram, and the train services do not necessarily stop at all the stations shown on their routes.