(will be inserted by the editor)
Fine-grained Dutch Named Entity Recognition
Bart Desmet · V´eronique HosteReceived: date / Accepted: date
Abstract This paper describes the creation of a fine-grained named entity annotation scheme and corpus for Dutch, and experiments on automatic main type and subtype named entity recognition. We give an overview of exist-ing named entity annotation schemes, and motivate our own, which describes six main types (persons, organizations, locations, products, events and mis-cellaneous named entities) and finer-grained information on subtypes and metonymic usage. This was applied to a one-million-word subset of the Dutch SoNaR reference corpus. The classifier for main type named entities achieves a micro-averaged F-score of 84.91%, and is publicly available, along with the corpus and annotations.
Keywords Named entity recognition· Annotation ·Classifier ensembles · Subtype classification
1 Introduction
Named Entity Recognition (NER) is the task of automatically identifying names in text and classifying them into a pre-defined set of categories. These categories are application-dependent, and will therefore differ across domains. In the biomedical domain, for example, proteins, genes and chemical sub-stances are common named entities. General-domain NER is typically con-cerned with finding names of persons, locations and organizations, and some-times also dates and amounts (Nadeau and Sekine, 2007). Originating as a
B. Desmet
Groot-Brittanni¨elaan 45, 9000 Ghent, Belgium Tel.: +32-9-2249753
E-mail: [email protected] V. Hoste
Groot-Brittanni¨elaan 45, 9000 Ghent, Belgium Tel.: +32-9-2249717
subtask for information extraction at the Sixth Message Understanding Con-ference (MUC-6) (Grishman and Sundheim, 1996), NER has been an active field of study in the past 15 years.
Finding named entities in text is often an essential preprocessing step for NLP applications. Systems for information retrieval and question answering are usually designed to process information related to named entities. Some opinion mining tasks are focused on monitoring or summarizing the sentiment expressed about specific entities, such as companies, products or services (Liu, 2010). Named entity information can also be helpful for other NLP problems. In coreference resolution systems, for example, it is commonly included in feature representations (Rahman and Ng, 2009). For machine translation, NER is helpful to find chunks of text that should not be translated (Babych and Hartley, 2003).
Named entity recognition on English newswire text has reached near-human performance (Zhou and Su, 2002) for the detection of person, organi-zation and location mentions. State-of-the art systems use supervised machine learning, where a model is trained on an annotated corpus that provides gold standard instances to learn from, the size of which is essential to achieve good performance. Such corpora are available for heavily researched languages such as English, but are scarce or small for most minority languages, such as Dutch. Furthermore, many named entity corpora consist of texts from a single genre (mostly newswire for general-domain NER). This causes robustness problems: systems that have been trained on one particular genre tend to perform worse on unseen genres (Poibeau and Kosseim, 2001). The corpus presented in this paper aims to resolve these problems for Dutch: at one million words manually annotated for general-domain NER, it is the largest corpus to date, consisting of texts from different genres, as described in Section 4.
One of the future challenges for NER research is to classify named enti-ties into a hierarchy of subtypes instead of the coarse main type categories. Named entities of main typelocation could, for example, be further classified as pertaining to the subtypescontinent orcountry. Such subtype classification would be especially valuable for applications that involve question answering, information retrieval or the automatic construction of ontologies (Lee et al, 2006). Another alley of future research is that of metonymic usage detection (Markert and Nissim, 2002). The literal reading of a named entity may differ from its intended reading, when metonymy is present. Names of countries, for example, may be used to represent the national sports team. This kind of information is relevant for other tasks, such as coreference resolution, in-formation extraction and question answering. Our corpus was annotated with newly developed guidelines that describe fine-grained named entity subtypes, and metonymic usage.
The resulting corpus was used for machine learning experiments on main type and subtype NER. For main type NER, three different machine learn-ing algorithms were used that had previously been successfully applied to the NER problem: memory-based learning (De Meulder et al, 2002), support vec-tor machines (Asahara and Matsumoto, 2003) and conditional random fields
(Mccallum and Li, 2003). We also experimented with classifier ensembles, using genetic algorithms to find a good ensemble composition, as proposed in Ekbal and Saha (2010). These experiments resulted in a robust and state-of-the-art main type NER system for Dutch. Experiments on subtype classification showed that only subtypes that occur frequently in the training data could be learned.
The remainder of this paper is structured as follows: in Section 2, we pro-vide an overview of related work. Section 3 presents the annotation scheme and Section 4 the corpus we developed. In Section 5, an overview is given of the methods used, Section 6 and 7 describe the experiments and results for main type and subtype NER, respectively. Finally, Section 8 concludes this paper.
2 Related work
An extensive literature exists on main type named entity recognition (Nadeau and Sekine, 2007). Early approaches developed for the MUC-7 competition were predominantly rule-based (Chinchor, 1998). These required manually cre-ating rules, a time-consuming process which hinders porting to new domains or languages. However, rule-based systems are still useful today for tasks where training material is unavailable (e.g. Sekine and Nobata, 2004). Rules are of-ten combined with gazetteers, where candidate names are looked up in lists of names belonging to a given category.
More recent systems typically use supervised machine learning, which rely on an annotated training corpus, from which a learning algorithm infers pat-terns associated with named entities, based on morphological, syntactic, lexical and contextual features. Supervised systems have been built that attain per-formances on the English MUC shared task datasets similar to that of human annotators (Zhou and Su, 2002). Given these results, the NER problem, as it was defined for the MUC competitions for English, could almost be consid-ered solved. However, because of the acquisition bottleneck for large annotated corpora, some work has focused on unsupervised and semi-supervised NER.
In a typical unsupervised approach, named entities are clustered based on contextual similarity (e.g. Alfonseca and Manandhar, 2002). Another unsuper-vised technique exploits the simultaneous occurrence of named entities in news sources, allowing the detection of rare or new named entities (Shinyama and Sekine, 2004). These kinds of entities are often missed by supervised systems, making the two approaches complemental.
In semi-supervised NER, a small supervised set of seeds is used to start the learning process. The system looks up sentences that contain these seeds, tries to identify contextual rules for them, and then looks for words occurring in similar contexts to expand the seed list. When repeated, this bootstrapping technique eventually yields a large number of hits, with a performance that rivals baseline supervised approaches (Nadeau et al, 2006).
In summary, supervised methods currently yield the best performance, but an annotated corpus is a prerequisite. Among the named entity resources available for English are the manually annotated datasets from the MUC-7 Named Entity Task (Chinchor 1998, 162,692 tokens) and the CoNLL-2003 shared task (Tjong Kim Sang and De Meulder 2003, 301,418 tokens), and the BBN Pronoun Coreference and Entity Type Corpus (Weischedel and Brun-stein, 2005), which provides a named entity and coreference annotation layer for the Penn Treebank corpus of Wall Street Journal texts (1,173,766 tokens). For Dutch, however, the data from the CoNLL-2002 shared task (Tjong Kim Sang, 2002a), containing 309,686 tokens from four editions of the Belgian news-paperDe Morgen of 2000, constitute the only corpus annotated with named entity information that is readily available at present.
The CoNLL corpora were annotated with four main type named entities: persons, locations, organizations and miscellaneous entities. Because of the importance of shared tasks for the NER field, this CoNLL typology is a stan-dard for main type NER, along with those developed for the MUC confer-ences (Chinchor, 1997) and ACE (LDC, 2008). LDC (2008), Sekine and No-bata (2004) and Weischedel and Brunstein (2005) described hierarchies for fine-grained classification into subtypes, with up to 200 categories. For the annotation of metonymy in named entities, guidelines have been proposed by LDC (2008) and Markert and Nissim (2002). We developed guidelines that attempt to synthesize these systems into one, which can be applied to Dutch and other languages. A notable difference between Dutch and English that is addressed in the guidelines, is the fact that Dutch compounds are written in one word. As a result, named entities may be embedded in longer strings that, as a whole, are not a named entity. The resulting guidelines are discussed and motivated in detail in Section 3.
Whereas coarse-grained NER is well-researched, fine-grained classification of named entities into subtypes has not been so widely studied. Fleischman (2001) introduces a system that categorizes locations into 8 subtypes. First, instances are classified using context word unigrams, bigrams and trigrams as features. Then, each instance is given the class that occurs most frequently with that instance. This second step ignores the possibility that identical instances may have different classifications (e.g. Washington the state, and Washington the city). The system is enhanced in Fleischman and Hovy (2002), for subtype classification of persons into 8 professions. Instead of using surface forms from the context, each context position is represented as the likelihood that it co-occurs with any of the 8 subtypes. Eight topic signatures are used to convey semantic information about the overall context, and eight more that have been expanded using WordNet. Classification performance is good on validation data, but on held-out test data it is hampered by the automatic training data collection, which was compiled using high-confidence classifications from an initial classifier trained on seeds.
More recent work on fine-grained NER has focused mainly on extending the number of classes and linking entities to existing concept hierarchies such as those found in Wikipedia or the People Ontology. Notable examples are
the work of Ponzetto and Navigli (2009), who enrich WordNet synsets using a taxonomy of fine-grained category-tagged instances from Wikipedia (amongst which many named entities), Ling and Weld (2012), who propose a NER sys-tem capable of doing multi-label prediction from 112 tags, and Hoffart et al (2013), who present YAGO, a knowledge base that links factual information (such as time and place information) to nearly 10 million entities. However, such systems that focus on ontology population or knowledge base enrichment do not tackle fine-grained tagging of all the entities encountered in a given doc-ument. Ekbal et al (2010) describe a tentative system for open-domain fine-grained NER for persons, using a maximum entropy classifier with features that describe context words, affix, POS and chunk information, capitalization, word length and frequency, presence of non-alphanumeric characters and the class of the previous word.
In this paper, we present experiments on subtype classification for all main types that have subtypes (persons, locations, organizations, products and events), in order to test its feasibility on our dataset, and to provide a baseline for further research.
To our knowledge, the only NER system available for Dutch is the one integrated in Frog1
(van den Bosch et al, 2007). This system looks up persons, organizations and locations using the gazetteers described in De Meulder et al (2002), and other lists of names harvested from Teletext. It has recently been replaced by a NER system trained on the data described in this paper.
3 Annotation
In this section, we describe previous work on named entity annotation guide-lines, and lay out and motivate differences with our annotation guidelines (Desmet and Hoste, 2010)2
, followed by examples. Figure 1 gives a schematic overview of the possible annotations.
3.1 Main types and subtypes
In 1995, the first widely-used named entity annotation guidelines were devel-oped for the MUC shared tasks, which were aimed at information extraction from text. Three kinds of annotation were proposed: entities (persons, orga-nizations and locations), times (dates and times) and quantities (monetary values and percentages). These were known asenamex,timex andnumex an-notations. The enamex category is the one that is typically associated with named entities in the strict sense of proper names.
For the CoNLL NER shared task of 2002, only enamex entities were consid-ered, and a fourthmiscellaneous category was added for proper names falling outside the original 3 enamex groups.
1
http://ilk.uvt.nl/frog/
2
PER
PERSONPRO
PRODUCTMISC
MISCELLANEOUS • literal • metonymic • as PRO (misc) • as name • as human • as LOC (+ subtype) • as PRO (+ subtype) • as EVE (+ subtype) • as name • as human • as PRO (misc) • as EVE (+ subtype) • as name • as human • as EVE (+ subtype) • as name • as name • none (default) • PER (noun denoting origin) • human • natural • cosmos • water • continent • country • region • population centre • line • point • fictionalORG
ORGANIZATIONEVE
EVENT • governmental • commercial • miscellaneous • share • language • miscellaneousLOC
LOCATION • sports • politics • clergy • business • arts • science • army • law • fiction • other • literal • metonymic • literal • metonymic • literal • metonymic • literal • metonymicFig. 1 Annotation scheme for named entities, with categories for main type, subtype, usage and metonymic roles. Examples of each subtype are provided in Table 3.
The ACE guidelines for entities also expanded the enamex typology. They introduce categories for geo-political entities or GPEs (geographical regions defined by political or social groups, such as nations) which were previously annotated as locations, facilities (man-made structures such as buildings or bridges) which subsume some entities from the types location and organization,
vehicles andweapons. Furthermore, they describe subtypes for most categories
(e.g. locations can have subtypeaddress, boundary, celestial, water-body,
land-region-natural, region-international or region-general). The ACE guidelines
also define two forms of metonymy annotation, which are discussed below. Brunstein (2002) describes the categories and guidelines assembled by BBN. It has two levels, with 29 main types and 64 subtypes, and further expands the hierarchy proposed for ACE. Weapons and vehicles become sub-types under the main type product, and the following new main types are added: NORP (nationality, religions, political and other named entities de-scribing affiliation),events, plants, animals, substances, diseases, works of art,
laws, games, languages andcontact information. It also includes and expands
the timex and numex categories (date, time, percent, money, quantity, ordinal
The most elaborate typology is the one described in Sekine and Nobata (2004). It consists of hierarchies for namex, timex and numex expressions. In the namex hierarchy, organization, location, facility, product, event, natural
object, title and unit have subtypes, whereas person, vocation, disease, god,
ID number, color and name-other do not. For some types, the hierarchy is
more than two levels deep: subtypes can have subtypes, e.g.natural object > living thing>animal >invertebrate>insect.
The timex category was further elaborated in Ferro et al (2005). Because of the availability of spatiotemporal information in our corpus (see Section 4), a timex category would have been redundant in our annotation scheme. The annotation scheme we propose is solely focused on expressions from the enamex category.
The typology we developed aims to strike a balance between granular-ity, learnability and task independence. Whereas the level of detail in MUC and CoNLL may be too limited for some applications, Sekine’s rule-based ap-proach suggests that his typology is too detailed to be learned automatically. We therefore made a relatively coarse-grained structure consisting of six main types, with subtypes that capture the granularity of the more elaborate ty-pologies. One example is location, which incorporates facility as a subtype, along with celestial, water-body, etc. We chose not to have main types that are tailored to a specific task, such as the weapons andvehicles categories in ACE.
The six main type categories are as follows:
– PER: names of persons, fictitious characters, gods, artist names and gen-erational suffixes; e.g.Elizabeth Bennet, Vishnu, Sting, George Bush Sr.
– ORG: names of organizations, including organizational suffixes; e.g. Euro-pean Parliament, Google Inc.
– LOC: names of locations, and derived adjectives; e.g.Paris, Mount Everest, Japanese
– PRO: names of products, awards, works of art and languages; e.g.Office 2007, Academy Award, Pride and Prejudice, Sanskrit
– EVE: names of events; e.g.World War II, Katrina
– MISC: miscellaneous names of species, substances, periods etc.; e.g. Meso-zoic, CO2
Subtypes are available for all main types, except for MISC:
– Persons are categorized into 9 fields: sports (such as athletes and coaches), politics (such as heads of state and members of parliament), clergy (such as priests and saints), business (such as CEOs), arts (such as painters, singers and actors), science (such as doctors and researchers), army and law enforcement (such as privates or police officers), law (such as judges and lawyers) and fictional characters. If a person entity does not fit into any of these categories, or the field cannot be determined from the context, the “other” class is assigned.
– Organizations can be classified as governmental (public institutions), com-mercial (companies) or miscellaneous (such as schools and theater groups)
– Locations are divided into continents, countries, regions (such as provinces and natural regions), population centres (such as cities and neighbour-hoods), lines (such as streets and highways), points (facilities such as build-ings and parks), water bodies (such as seas and rivers), extraterrestrial lo-cations (such as planets and galaxies) and fictional lolo-cations (e.g.Narnia)
– Products are classified as shares (on the stock market), languages or mis-cellaneous (such as works of art)
– Events are labeled as either human (such as wars and sports events) or natural (such as natural disasters)
3.2 Metonymic usage
Some entities can be hard to annotate because of ambiguity between main types, such aslocations,GPEs andorganizations. Such entities can often take on different roles, according to their usage. Consider Sentence 1:
(1) The White House opted for modern works of art, including a Rothko.
Cases likeWhite House being classified as location rather than organiza-tion are a common confusion (Nothman et al, 2009). Similarly, Rothko can be considered a person or product entity. This ambiguity can be solved by annotating metonymy, in which one expression is used to refer to the referent of a related one.
The ACE guidelines describe two forms of metonymy. Nickname metonymy occurs when the name of one entity is used to refer to another entity, such as a capital city referring to a government, or a location name denoting a sports team. Cross-type metonymy occurs when multiple aspects of an entity are referenced at the same time, such as organizations and the facilities they occupy (e.g. They will be visiting the White House tomorrow).
Markert and Nissim (2002) argue that although metonymic readings are potentially open-ended and can be innovative, there is a regularity to the metonymic usage of word groups. Therefore, given a semantic class (e.g. loca-tion), several regular metonymic patterns (e.g. place-for-event) can be spec-ified that instances of the class are likely to undergo. They describe three patterns for locations (place-for-people, place-for-event andplace-for-product) and five patterns for organizations (members, product, org-for-facility, org-for-stock-index and org-for-event), along with some general pat-terns that may apply to all semantic classes (object-for-representation and
object-for-name, when a name is used as a mere signifier, or other-metonymy
for metonymy that does not fit a common pattern) (Nissim and Markert, 2005).
We adapted this approach, by describing metonymic patterns for all main types exceptmiscellaneous. By marking whether a named entity is used liter-ally or metonymicliter-ally, we can consistently label named entities for theirliteral
main and subtype, and use metonymic roles to point to their intended main and subtype. This is exemplified in Sentence 2:
(2) The [White House]LOC.point.meto.humanopted for modern works of art, including
a [Rothko]P ER.meto.P RO.misc. The painting was bought for US$ 1.7 million.
Because it is often impractical to determine whether a named entity is used metonymically as PER or as ORG, we combined them in the intended type
human. White House might refer to a person, namely the U.S. president, or
to an organization-like group of people such as the White House staff. Marking metonymy does not only do away with confusable main types, it should also benefit other NLP tasks such as coreference resolution. For example, a coreferential resolution algorithm could link an inanimate noun phrase likethe paintingtoRothkoin Sentence 2 if it has access to named entity classifier output that does not only mark “Rothko” literally as an (animate) person, but also metonymically as a product. This in turn allows information extraction and question answering applications to link the selling price of 1.7 million toRothko.
The addition of metonymy annotations further contributes to the experi-mental value of the corpus, as automatic metonymy resolution is a valuable field of study in itself.
3.3 Guideline evaluation
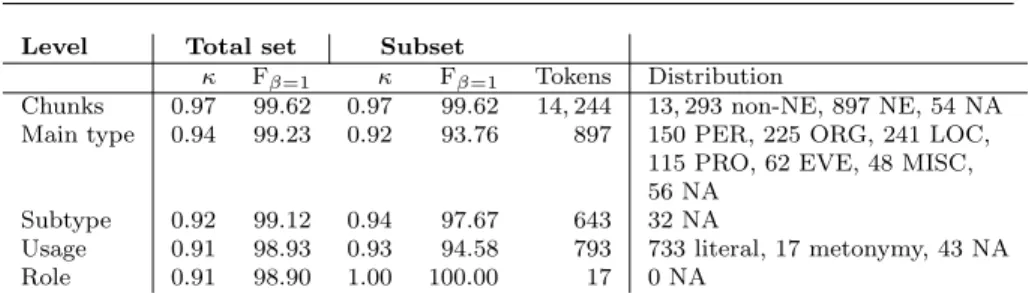
In order to evaluate the guidelines, two linguists annotated a set of eight randomly selected texts from the corpus, containing 14,244 tokens in total. Two evaluation metrics were used: Kappa (Carletta, 1996) and F-score (β = 1) (Van Rijsbergen, 1979). F-scores were calculated by taking one annotator as the gold standard and scoring the annotations of the other for precision and recall. This yields the same results as averaging the precision or the recall scores of both annotators, when using the other as a gold standard.
Scores were calculated on 5 levels: chunks (whether a word is annotated as a named entity or not), main type, subtype, usage and metonymic role. For each level, scores were calculated on the entire set, and on a subset contain-ing only those tokens (i) on which both annotators agreed on the preceding
level, and (ii) which can receive annotation on the current level (MISC and
PER, for example, are not included in the subset for subtype, because they cannot receive subtype annotation). We present these subset results in order to have scores that are not influenced by annotations that are irrelevant at the considered level. The results can be found in Table 1.
The results show high agreement scores for all levels: Kappa scores above 0.80 are characterized as almost perfect agreement. We can conclude that annotation can be carried out consistently.
Level Total set Subset
κ Fβ=1 κ Fβ=1 Tokens Distribution
Chunks 0.97 99.62 0.97 99.62 14,244 13,293 non-NE, 897 NE, 54 NA Main type 0.94 99.23 0.92 93.76 897 150 PER, 225 ORG, 241 LOC,
115 PRO, 62 EVE, 48 MISC, 56 NA
Subtype 0.92 99.12 0.94 97.67 643 32 NA
Usage 0.91 98.93 0.93 94.58 793 733 literal, 17 metonymy, 43 NA Role 0.91 98.90 1.00 100.00 17 0 NA
Table 1 Inter-annotator agreement scores per level (expressed as Kappa and as F-measure withβ=1), token count and distribution (NA = no agreement).
4 Dataset
The annotation scheme described in Section 3 was applied to a part of the STEVIN3
-funded SoNaR corpus4
. SoNaR is a reference corpus of written Dutch that comprises a wide variety of texts, including traditional text types (such as newswire, manuals, autocues, fiction and reports) as well as new me-dia (such as blogs, forums, chat and SMS), for a total of 500 million words (Oostdijk et al, 2008).
A diverse 1-million-word subset (SoNaR 1) has been manually annotated with named entity information. The diversity in text types, which was lacking in the Dutch CoNLL-2002 dataset, should allow for a more robust classifier and better cross-corpus performance (Nothman et al, 2009). It should also make SoNaR 1 an interesting corpus for research on domain adaptation. The possibility to train a robust classifier was essential, because the NER system trained on SoNaR 1 was used to automatically label the remainder of SoNaR. SoNaR 1 does not only contain named entity information, it has also been provided with a number of other manually corrected annotation layers. The corpus has been syntactically annotated, and there are four semantic layers: named entities, coreference relations, semantic roles and spatiotemporal ex-pressions (Schuurman et al, 2009).
SoNaR 1 and its annotation layers are to be released along with the other SoNaR deliverables, including the main type named entity classifier described below, and will be freely available for academic use. The Dutch Human Lan-guage Technology Agency (HLT-agency)5
is responsible for distribution.
4.1 Corpus annotation
Manual annotation was done using the MMAX2 annotation tool (Muller and Strube, 2006). For the named entity task, six annotation layers were created
-3
http://taalunieversum.org/taal/technologie/stevin/
4
http://lands.let.ru.nl/projects/SoNaR/
5
The Dutch-Flemish agency for management, maintenance and distribution of Dutch digital language resources. See http://www.tst-centrale.org
one per main type. Per text, each annotation layer is stored as a standoff XML file, the content of which is defined by a scheme file. These scheme files contain the possible attributes for every annotation, such as the available subtypes, the choice between literal and metonymic usage, and the metonymic role, if applicable.
Annotation speed averaged around 3,500 words per hour. Taking into ac-count the verification of the annotations by a second annotator, the actual annotation speed was close to 2,000 words per hour.
4.2 Corpus statistics
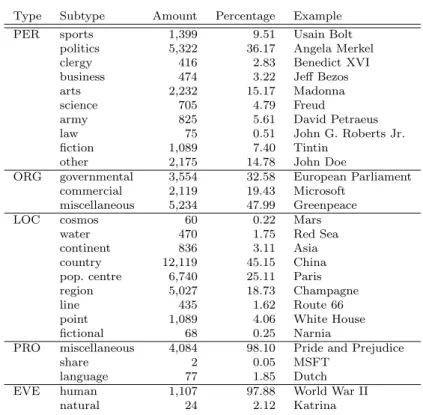
The distribution of main named entities, subtypes and metonymic usage in the corpus is described in Table 2, 3 and 4, respectively.
SoNaR CoNLL
Type Amount Percentage Amount Percentage
Person 14,712 23.45 6,517 32.75 Organization 10,907 17.38 3,650 18.34 Location 26,844 42.78 4,461 22.42 Product 4,163 6.63 Event 1,131 1.80 Miscellaneous 4,988 7.95 5,273 26.50 Total NE chunks 62,745 19,901 Tokens in NE chunks 91,103 9.08 28,770 9.30 Tokens outside NE chunks 912,773 90.92 280,436 90.70
Total tokens 1,003,876 309,206
Table 2 Main type distribution in the SoNaR and the CoNLL-2002 shared task corpora.
Nearly 10 percent of the tokens in the SoNaR corpus are part of a named entity chunk. Locations are the most prevalent main type, followed by per-sons and organizations. For every six named entities, five pertain to one of these three categories. Miscellaneous entities and products are uncommon, and events are rare.
This distribution is comparable to that in the Dutch datasets for the CoNLL-2002 shared task, which is also presented in Table 2. The frequency of named entities (9.30%) is nearly identical. Persons are more frequent in the CoNLL data, locations less frequent, and organizations about equally frequent. The high proportion of locations in the SoNaR data can be explained because nouns and adjectives derived from locations (such as French or Frenchman) are annotated as LOC in SoNaR, and as MISC in CoNLL. Consequently, MISC annotations are more frequent in CoNLL than in SoNaR. We can conclude that the named entity frequencies in the SoNaR corpus do not violate expectations based on another corpus.
The subtype distribution is skewed for most main types, except organiza-tions. Person entities in our corpus typically belong to the fields of politics or arts, which together represent more than half of the entities. Around 15 per
Type Subtype Amount Percentage Example PER sports 1,399 9.51 Usain Bolt
politics 5,322 36.17 Angela Merkel clergy 416 2.83 Benedict XVI business 474 3.22 Jeff Bezos arts 2,232 15.17 Madonna science 705 4.79 Freud
army 825 5.61 David Petraeus law 75 0.51 John G. Roberts Jr. fiction 1,089 7.40 Tintin
other 2,175 14.78 John Doe
ORG governmental 3,554 32.58 European Parliament commercial 2,119 19.43 Microsoft
miscellaneous 5,234 47.99 Greenpeace
LOC cosmos 60 0.22 Mars
water 470 1.75 Red Sea continent 836 3.11 Asia country 12,119 45.15 China pop. centre 6,740 25.11 Paris region 5,027 18.73 Champagne
line 435 1.62 Route 66
point 1,089 4.06 White House fictional 68 0.25 Narnia
PRO miscellaneous 4,084 98.10 Pride and Prejudice
share 2 0.05 MSFT
language 77 1.85 Dutch EVE human 1,107 97.88 World War II
natural 24 2.12 Katrina
Table 3 Subtype distribution and examples
cent of the annotations did not pertain to any of the fields, or could not be disambiguated from the context. For locations, countries make out almost half of the annotations, followed by population centres (e.g. Madrid) and regions (e.g.Alabama). The remaining location subtypes occur with some frequency, although fictional (e.g.Azkaban) and extraterrestrial locations (e.g.Mars) are rare.
Especially for products and events, the skewness of the data is high: out of 2352 product annotations, there are 77 instances with subtype language, and only 2 with subtype share. This can in part be explained by the nature of the data, which does not include financial news, for which the share subtype is in-tended. For events, only 24 have subtype natural (e.g.Alex, Zuidwesterstorm), as opposed to 1107 with subtype human, which is to be expected given the low number of named natural events.
Metonymy occurs with almost one in twenty named entities in the corpus. It is most frequent in organizations and locations, which are often used to signify humans. Out of 2610 metonymically used named entities, 223 have an
other metonymic role, meaning that 91.46% of the entities (2387) follow a
Literal Metonymic Percentage Type of metonymy
PER 14,425 287 1.95 194 as-pro, 5 as-name, 88 other ORG 9,636 1,271 11.65 1107 as-human, 116 as-loc, 31 as-pro,
9 as-name, 7 as-eve, 1 other LOC 25,857 987 3.68 725 as-human, 128 other, 91 as-eve,
26 as-pro, 17 as-name PRO 4,102 61 1.47 53 as-human, 2 as-eve, 2 other
EVE 1,127 4 0.35 4 other
Overall 54,994 2,610 4.53
Table 4 Usage distribution. The type of metonymy is either the intended type (e.g. PER as-pro is a person named entity used metonymically as a product entity, such asa John le
Carr´e, being a book by that author), orotherif the metonymy does not follow any of the
predefined patterns.
5 Methods
In this section, we describe the methods used for the main type and subtype classification experiments. We discuss the various classification frameworks that were used (5.1), the methods used for ensembling classifiers (5.2), ex-tracted features (5.3) and evaluation metrics (5.4).
5.1 Classification frameworks
The main type classification experiments in this paper were done with three families of supervised learning algorithms: memory-based learning, support vector machines and conditional random fields. The subtype classification ex-periments were done with memory-based learning. We briefly describe each classification framework below.
5.1.1 Memory-based learning
Memory-based learning (MBL) algorithms are called lazy learners because they perform no generalization on the instance base they are trained on (Daele-mans and van den Bosch, 2005). All the instances are stored in memory, and new instances are classified by comparing them to the instance base, for ex-ample with ak-nearest neighbour algorithm. When ak-value of 1 is used, the classifier labels an unseen instance with its closest neighbour in the instance base. Various distance and feature weighting metrics can be used to determine which neighbour is closest. For larger values ofk, some voting mechanism has to be applied to choose one class label from the nearest neighbours set.
We experimented with TiMBL6
, version 6.2.1 (Daelemans et al, 2009). 6
5.1.2 Support Vector Machines
A Support Vector Machine (SVM) is a learning classifier capable of binary classification. It learns from the training instances by mapping them to a high-dimensional feature space, and constructing a hyperplane along which they can be separated into the two classes. New instances are classified by mapping them to the feature space and assigning a label depending on its position with respect to the hyperplane. SVMs are said to have a robust generalization ability (Vapnik and Cortes, 1995).
For multiclass classification problems, separate SVMs have to be built. With the pairwise approach, one SVM is trained for every pair of classes. Another method is one vs rest, where one SVM is built for each class to distinguish it from all other classes.
The SVM implementation used in our experiments is YamCha7
, version 0.33 (Kudo and Matsumoto, 2003), with pairwise multiclass classification.
5.1.3 Conditional Random Fields
A Conditional Random Field (CRF) is a probabilistic classifier that is used to segment and label sequential data, which makes it especially apt for natural language processing tasks like named entity recognition. CRFs take an input sequenceX with its associated features, and try to infer a hidden sequenceY, containing the class labels. They are as such comparable to Hidden Markov Models (HMMs) and Maximum Entropy Markov Models (MEMMs). However, CRFs, unlike HMMs, do not assume that all features are independent, and they can take future observations into account using a forward-backward algorithm, unlike MEMMs, thus avoiding two fundamental limitations of those models (Lafferty et al, 2001).
For our main type experiments, CRF++8
version 0.53 was used. CRF++ is a sequence tagger, which requires a template file that specifies the combi-nations of features it needs to consider.
5.2 Classifier ensembles and genetic algorithms
The standard way to improve NER classification performance is by optimizing a single classifier. This may involve finding the most informative features, and discarding the uninformative ones (feature selection, Isozaki and Kazawa (2002)) or finding the right settings for a specific algorithm (parameter tuning, De Meulder and Daelemans (2003)). An alternative research direction is that of combining several classifiers into an ensemble, and combining their output using a voting procedure (Wang et al, 2008). The assumption is that combining a diverse set of classifiers improves the generalization accuracy, provided that
7
http://chasen.org/ taku/software/yamcha/
8
the ensemble’s members have sufficient individual performance and their errors do not entirely overlap.
The output of the individual classifiers in an ensemble can be combined using the following voting procedures:
– Normal majority voting: every classifier casts a vote for a class tag, and the tag with the highest score wins. In case of a tie, the most frequent class is chosen. This is an unweighted voting system: all classifiers have an equal amount of influence on the outcome of the vote.
– Globally weighted voting: the weight of a classifier’s vote is determined by its overall F-score on the dataset. Classifiers that perform well globally thus have a bigger influence in every vote.
– Class weighted voting: a classifier’s vote for one particular class is weighted by its F-score on that particular class. The weight of a classifier thus de-pends on its performance on the class it is voting for.
– Smoothed class weighted voting: the same principle as class weighted vot-ing, but a classifier’s F-score per class is divided by the average F-score of all classifiers for that class, such that above-average performers get a weight of more than 1, and vice versa. This levels the difference in weight between classes. Without smoothing, a number of (relatively speaking) confident votes for a class that is hard to predict would easily be outweighed by fewer votes for a class that is easier to predict.
Finding a good combination of classifiers for an ensemble is not a trivial search problem: for n candidate classifiers, there are 2n
−(n+ 1) possible ensemble combinations.
Genetic algorithms provide an efficient way to select a near-optimal ensem-ble. They operate on a representation of the search space, called the genome, which in the case of constructing an ensemble from a set of n classifiers can be a binary string of length n, in which every bit represents a classifier. The technique is inspired by evolutionary biology, borrowing evolutionary concepts such as selection (well-adapted orfit individuals are more likely to survive), inheritance (the genetic material is passed on to later generations), mutation (new generations introduces some random variation in the genetic material) and crossover (new genetic material is formed by combining the material of parents). The technique is applied to a population of possible solutions, in order to find the solution that is most fit to a problem (Whitley, 1994).
The search space defined by the genome is explored as follows:
1. An initial populationP(0) is created, containing|P|randomly instantiated genomes, called chromosomes.
2. For each chromosome, a fitness score is calculated. This is done by having the classifier ensemble, as encoded by the chromosome, vote on the class tag of every instance in the dataset, and then evaluate the resulting tags against the gold standard solution.
3. The next step is to select chromosomes that will populate the interme-diate population. With rank selection, the chromosomes are ordered by fitness and assigned a selection weight: 1 for the least fit chromosome, 2
for the second least fit, and so forth, and|P| for the fittest chromosome. Afterwards, the intermediate population is populated with chromosomes that are sampled with a probability relative to their selection weight. The fittest chromosomes thus have the highest probability of being sampled multiple times in the population.
4. When selection is complete, recombination on the intermediate population can be performed to create the next generationP(1). This can be done using Single Point Crossover, where the genetic code of two chromosomes is swapped from one point onwards. Afterwards, each chromosome has a chance of being mutated, whereby its values are changed randomly. In the case of bits, Flip Mutation is used, which flips a value from 0 to 1 or vice versa.
5. Steps 2 to 5 are repeated until a predefined number of generations has been evaluated. The individual with the highest fitness score in the last generation is considered the optimal classifier ensemble found by the GA. In Section 6.1, we describe how the genetic algorithm approach was applied to our classifier ensemble selection problem. Our system used Pyevolve9
, a Python implementation of genetic algorithms.
5.3 Feature representation
Supervised machine learning algorithms require that the information present in a training corpus is presented as a collection of instances, each of which has to be classified into a predefined set of classes based on a vector of features describing its attributes.
In the case of main type named entity recognition, every token from the corpus is represented by an instance, which has a class indicating whether the token is a named entity, and if so, which type. IOB2 notation (Tjong Kim Sang, 2002b) is used to represent named entity chunks, whereO stands for
outside a chunk (not a named entity),B forbegin (start of a NE chunk) and
I forinside a chunk.
The subtype classification systems are main type specific (e.g. locations only), and are presented with instances representing named entities of that main type, with the subtype as the class to be predicted.
We extracted a range of features to describe instances, many of which are commonly used in the field (Tjong Kim Sang, 2002b; Nadeau and Sekine, 2007) or have been studied for Dutch before (Bogers, 2004). For the main type experiments, the following features were used:
– Basic information: the original token, its POS tag, which was obtained by preprocessing the data with the Memory-Based Shallow Parser (Daele-mans and van den Bosch, 2005), and a binary feature indicating if the word is in sentence-initial position.
9
– Orthographic information: non-exclusive binary features capturing or-thographic characteristics of the token: whether it has capitalization (first letter, entire word, letters inside the word, none), whether it is hyphen-ated, and whether the token is made up in part or entirely of numbers, or punctuation marks.
– Word shape: a symbolic feature that tests for the same orthographic char-acteristics as the binary features described above, outputting one of the fol-lowing labels:allLowercase, allCaps, firstCap, capPeriod, onlyDigits, con-tainsDigitAndAlpha, allCapsAndPunct, firstCapAlphaAndPunct,
alphaAnd-Punct, onlyalphaAnd-Punct, mixedCase or other. This feature was added to force
feature conjunction in case a classifier fails to generalize over combinations of multiple binary features.
– Patterns: binary features indicating whether the token matches regular expressions that test if it resembles an initial (defined as strings with up to five capitalized letters separated with periods) or a URL (taken to be strings starting withhttp).
– Word length: the number of characters in the token.
– Character ngrams: the first and the lastncharacters of the token.
– Function word: a binary feature indicating whether the token occurs in a list of 641 Dutch function words, as described in Bogers (2004).
– Chunks: a symbolic feature with a base phrase chunk tag, obtained with the Memory-Based Shallow Parser.
– Class tag: the correct classification is taken from the annotations, and is represented by one of 13 possible class tags: B-EVE, EVE, B-LOC, I-LOC, B-MISC, I-MISC, B-ORG, I-ORG, B-PER, I-PER, B-PRO, I-PRO
for the six named entity types (see 4) orO if the token is not part of a named entity.
For the experiments on subtype, these features were used:
– Token: the named entity of which the subtype has to be determined. Mul-tiword named entities are concatenated with underscores.
– Context: the three tokens preceding and following the named entity to be classified.
– Character ngrams: 6 string features containing the first and the last 2, 3 or 4 characters of the named entity. These features should allow gener-alization of common prefixes and suffixes in named entities. In multiword named entities for example, one token is often indicative of the subtype, such as the noun phrase in a noun phrase-prepositional phrase combination (e.g.Ministry of Defence).
– Decompounding: in Dutch, compounds are written in one word. Decom-pounding was applied to extract the final element of the compound, which is usually indicative of the named entity subtype (e.g.Hudsonbaai, would be decompounded intoHudson andbaai (bay)).
5.4 Evaluation
For main type classification, we evaluate performance using micro-averaged F-score. In micro-averaging, an overall F-score is computed globally over all instances (thus giving higher weight to frequent classes), whereas in macro-averaging, F-scores are first computed for each class under consideration, and then averaged (such that each class has an equal weight in the final score). We use the conlleval.pl script10
made available for the CoNLL shared tasks, which was written to work with IOB notation, counting NE chunks as one.
For subtype classification, both micro-averaged and macro-averaged F-scores are reported.
Because of the computational requirements of the experiments, a smaller corpus was selected from SoNaR 1 as the development corpus, that had been entirely annotated and double-checked at the time of the experiments. This development corpus consisted of 99 autocue scripts for news shows on Dutch public television (205,040 tokens). It was used for the main type and subtype classification experiments. Evaluation on this corpus was done with threefold cross-validation.
After development, the best-performing main type NER system was re-trained on the entire corpus. We report tenfold cross-validation performance on this corpus.
6 Main type classification
6.1 Experimental setup
The main type named entity recognition is a sequence labeling task: each sentence is a sequence of tokens, which needs to be assigned a sequence of IOB labels. Context information is relevant: if one token starts aPerson chunk (B-PER), it is likely that the next token may also be in that chunk (I-PER). CRF is designed as a sequence labeling machine learner, which tries to find an optimal sequence of labels for the given input sequence. In order to provide context information to the MBL and SVM learners as well, the instances were windowed. Experiments with different window sizes on the development set indicated that a left context of 3 and a right context of 1 yielded the best results. All features were windowed in this fashion.
We experimented with a manual and an automatic approach to find the best-performing combination of features and learning algorithm.
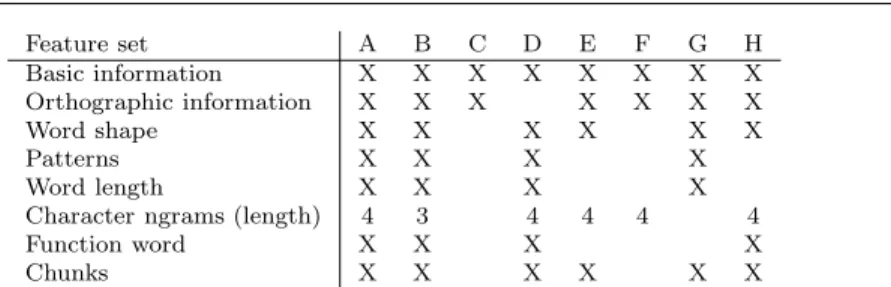
First, we manually combined the features described in Section 5.3 into 8 different feature sets, shown in Table 5. Basic information (original token, POS tag and position in the sentence) was deemed indispensable, and is included in every feature set.
These feature sets were tested with 3 configurations of the classification frameworks:
10
Feature set A B C D E F G H Basic information X X X X X X X X Orthographic information X X X X X X X Word shape X X X X X X Patterns X X X X Word length X X X X
Character ngrams (length) 4 3 4 4 4 4
Function word X X X X
Chunks X X X X X X
Table 5 Composition of the 8 feature sets for main type classification.
– TiMBL with default settings: the IB1 (k-nearest neighbour) algorithm with ak-value of 1, overlap as the distance metric and gain ratio feature weight-ing.
– CRF++ with the standard feature template.
– YamCha, using a pairwise multi-class strategy.
These configurations were combined with the 8 feature sets, and tested using threefold cross-validation on the development corpus.
Secondly, we tested whether better performance could be achieved by com-bining classifiers into an ensemble. These ensemble selection experiments were done automatically, using genetic algorithms to find an optimal classifier en-semble, an approach similar to the one proposed by Ekbal and Saha (2010), where GAs are used to construct a classifier ensemble out of 19 Maximum En-tropy classifiers. We hypothesized that ensembling different types of classifiers would benefit the ensemble performance, assuming that each classifier type makes different kinds of errors (Hastie et al, 2001).
The genetic algorithm setup used to find the best classifier ensemble was configured as follows (we refer to Section 5.2 for a description of the various settings). A 24-bit genome was used to represent the search space. Every bit in the genome represents the presence (1) or absence (0) of 1 of the 24 classifiers in order, and the combination of those bits determines which classifiers are combined into an ensemble. The chromosome 111111110000000011111111, for example, represents an ensemble in which all TiMBL and all YamCha classi-fiers are used, and none of the CRF++ classiclassi-fiers. The population size|P|was 50. Single Point Crossover occurred with a probability of 0.90, and Flip Mu-tation with a probability of 0.02, so that every bit in the chromosome had a 2 percent chance of being flipped. We stopped the evolution after 40 generations. The selection and mutation types and probabilities are Pyevolve’s default pa-rameters. We used the same population size and number of generations as used in the experiments described in Ekbal and Saha (2010).
Finally, we used the results from the individual and ensemble experiments to construct a system trained on the entire 1-million-word corpus, and report results using tenfold cross-validation.
6.2 Results and discussion
6.2.1 Individual classifiers
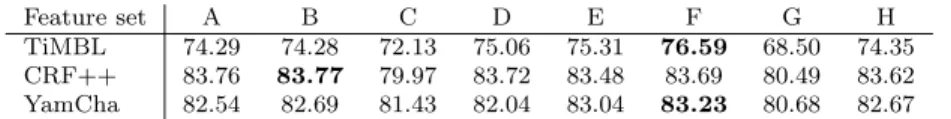
The performance of each combination of a feature set and a classifier configu-ration is reported in Table 6.
Feature set A B C D E F G H
TiMBL 74.29 74.28 72.13 75.06 75.31 76.59 68.50 74.35 CRF++ 83.76 83.77 79.97 83.72 83.48 83.69 80.49 83.62 YamCha 82.54 82.69 81.43 82.04 83.04 83.23 80.68 82.67
Table 6 Overall F-scores (in percent) for each individual classifier, using threefold cross-validation on the development corpus.
It shows that the CRF classifiers present in the pool perform best on av-erage. The best individual classifier is the CRF classifier trained with feature set B, which contains all features (with character ngrams of length 4).
6.2.2 Ensemble classifiers
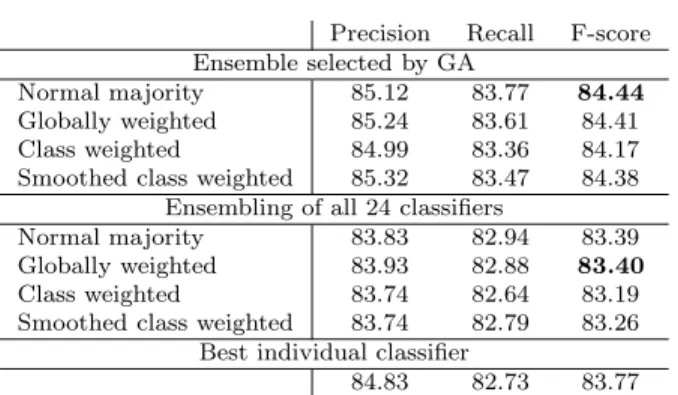
Table 7 presents the outcome of the ensemble selection experiments for each voting mechanism. The genome describes which of the 24 classifiers are in-cluded in the ensemble. The precision, recall and F-scores of these ensembles, the ensembling of all classifiers and the best individual classifier are presented in Table 8.
Voting mechanism Genome
Normal majority 00010100 11001001 01000100 Globally weighted 00000100 01010001 01001100 Class weighted 00010100 11011000 01001100 Smoothed class weighted 00010100 01011101 11000100
Table 7 Best-performing classifier ensembles per voting mechanism. The first 8 bits rep-resent the TiMBL classifiers, ordered per feature set, followed by 8 CRF++ en 8 YamCha classifiers.
It can be observed in Table 7 that the best-performing classifier ensem-bles, regardless of the voting mechanism used, consist of classifiers from all three classification frameworks. Of particular interest is the occurrence of the TiMBL classifiers trained on feature sets D and F, present in all but one and all classifier ensembles, respectively. These classifiers achieve an individual F-score of 75.06 and 76.59, respectively, well below the F-F-scores of the selected CRF and SVM classifiers. This observation may corroborate that combining different types of learning algorithms in a classifier ensemble can lead to better generalization performance of an ensemble.
Precision Recall F-score Ensemble selected by GA
Normal majority 85.12 83.77 84.44
Globally weighted 85.24 83.61 84.41 Class weighted 84.99 83.36 84.17 Smoothed class weighted 85.32 83.47 84.38
Ensembling of all 24 classifiers
Normal majority 83.83 82.94 83.39 Globally weighted 83.93 82.88 83.40
Class weighted 83.74 82.64 83.19 Smoothed class weighted 83.74 82.79 83.26
Best individual classifier
84.83 82.73 83.77
Table 8 Overall precision, recall and F-scores (in percent) on the development corpus.
A first observation to be made in Table 8 is the influence of the chosen voting mechanism, used for combining the class tags of each individual classi-fier in an ensemble. In our experiments, the results with class weighted voting consistently trail the other results. We had hypothesized that this could be caused by the higher weight it gives to majority classes, and anticipated the problem with smoothed class weighting. The results confirm that smoothing has a positive effect. Performance differences between the three best voting mechanisms are small, but overall, a simple voting strategy such as normal majority or globally weighted voting can be recommended.
All best-performing classifier ensembles outperform the ensembles consist-ing of all classifiers by a significant margin. The difference in F-score between the best-performing classifier ensemble (normal majority voting, 84.44) and the best-performing individual classifier (CRF++ trained on feature set 2, 83.77) is 0.67 percentage points. This difference was found to be statistically significant.
For the calculation of statistical significance of the F-score, we applied the bootstrap resampling test (Noreen, 1989; Yeh, 2000) to the output of the classifier, a significance test that has been used earlier in the framework of the CoNLL shared task on NER (Tjong Kim Sang and De Meulder, 2003). Instances are randomly drawn with replacement from the classifier output, forming a so-called bootstrap sample. From the output of each system, 1000 such bootstrap samples were taken, and the distribution of the F-scores on these samples is assumed to be the distribution of the performance of that system. We used these F-scores to calculate the average F-score, the standard error and the upper and lower boundary of the center 90% distribution.
If the bootstrap-sampled averaged F-score of systemX is outside the 90% center of system Y, the performance difference between these systems is con-sidered to be statistically significant.
The results confirm that genetic algorithms can be successfully applied to the task of finding a classifier ensemble that outperforms the best individual classifier. However, the performance gains measured in our experiments are not as large as the ones reported in Ekbal and Saha (2010), where improvements
of up to 12.88 F-score percentage points are reported. One possible explana-tion for this is that the base classifiers used in their experiments were not as strong as the ones used in our experimental setup, leaving a bigger margin for improvement.
6.2.3 Ensembles versus tuning
Because of the observation that ensembling did not bring large performance gains, we wanted to test whether an optimized individual classifier could im-prove on the best ensemble’s performance. In a further experiment, we tried to enhance the feature set of the best-performing CRF classifier by including the features of the second-best classifier it did not already have, namely prefixes and suffixes of length 4. This classifier achieved an F-score of 84.91 on the dataset, thus outperforming both the best individual classifier and the best ensemble classifier by 1.14 and 0.47 percentage points, respectively.
This may suggest that optimizing a single classifier (e.g. with feature se-lection or parameter optimization) can lead to better performance than using a classifier ensemble approach. This dilemma is consistent with findings for other tasks, such as word sense disambiguation. In the third Senseval compe-tition, for example, a highly optimized single classifier outperformed classifier ensemble systems on the challenge data (Decadt et al, 2004). More recent work by Brody et al (2006) and Navigli and Ponzetto (2012), on the other hand, present successful word sense disambiguation approaches with classifier ensembles.
An important factor to consider in the trade-off between ensemble selec-tion and classifier optimizaselec-tion is the computaselec-tional cost. For large search spaces (e.g. when there are many possible ensemble combinations, features or parameter settings to consider), the cost of evaluating a single combination determines how fast the space can be searched, either with a grid search or a genetic algorithm. In the case of ensemble combination, this cost is relatively small, because evaluation consists of combining (known) outputs of individual classifiers, applying a voting strategy, and calculating a performance measure. For classifier optimization, on the other hand, evaluation consists of training a classifier, generating test output, and calculating performance. Lazy learners, such as TiMBL, are forgiving to such an approach, because they can be trained very quickly. However, the time required to evaluate a single greedy classifier, such as CRF++, can quickly make optimization computationally infeasible without grid computing infrastructure.
6.2.4 Feature selection
As it has been shown in previous work that lazy learning approaches like TiMBL are more vulnerable to bad features than greedy ones such as SVM and CRF (Daelemans and Hoste, 2002; Hoste, 2005), we did feature selection for TiMBL using a genetic algorithm. SVM and CRF are more robust because of their inherent feature weighting. CRF++ for example was not harmed by bad
features: it delivered the best-performing classifier when it had every feature at its disposal (see Table 6).
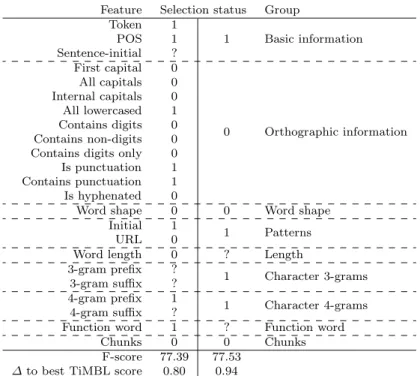
Gallop (Desmet et al, 2013), a genetic algorithm toolbox for optimizing learning algorithms, was used for feature selection on two levels: feature groups and individual features. For feature group selection, a 9-bit genome encoded the presence or absence of any of the 8 feature groups described in Section 5.3, with character ngrams divided into two groups (trigrams and four-grams). For individual feature selection, every feature was represented in a 23-bit genome. Evolution was set to run for 100 generations of 10 individuals each (mu-tation rate 0.3, crossover rate 0.7). The selected features and resulting scores are presented in Table 9.
Feature Selection status Group Token 1 1 Basic information POS 1 Sentence-initial ? First capital 0 0 Orthographic information All capitals 0 Internal capitals 0 All lowercased 1 Contains digits 0 Contains non-digits 0 Contains digits only 0 Is punctuation 1 Contains punctuation 1 Is hyphenated 0
Word shape 0 0 Word shape Initial 1
1 Patterns URL 0
Word length 0 ? Length 3-gram prefix ? 1 Character 3-grams 3-gram suffix ? 4-gram prefix 1 1 Character 4-grams 4-gram suffix ?
Function word 1 ? Function word Chunks 0 0 Chunks
F-score 77.39 77.53 ∆to best TiMBL score 0.80 0.94
Table 9 Results of individual feature and feature group selection. Multiple individuals ranked best with an identical score. Features or groups that are selected in all those indi-viduals have a selection status of 1; status ? indicates selection in some indiindi-viduals, status 0 in none. F-scores for the best individuals are given, and the performance gain over the best TiMBL classifier in Table 6 (76.59 F-score, feature set F).
In our experiment, feature selection yields a performance gain of close to 1% F-score. Feature group selection performs somewhat better than individual feature selection, which may be due to its reduced search space and better chance for an optimal solution, but both feature selection approaches largely agree on which features are useful for NER with TiMBL.
Unsurprisingly, the original token and POS tag are useful, although the inclusion of the sentence-initial feature appears to be unnecessary. It may be irrelevant because TiMBL has access to a window of 2 tokens on either side of the target token, and infers positional information there.
Orthographic features remain largely unselected, even with individual fea-ture selection. Only the All lowercased and punctuation features are chosen. We hypothesize that the other features are either irrelevant, or redundant because of e.g. character ngram features. The word shape features is also dis-carded.
Of the pattern features, the detection of name initials is useful, whereas URLs do not need a separate feature. Name initials detection is likely to help classification (as person) rather than detection.
Word length is not relevant to NER. Character ngram information, on the other hand, is. With feature group selection, both trigrams and four-grams are selected. The individual feature selection shows that four-gram prefixes are the most informative.
The function word feature is selected individually, but its presence does not seem to make a difference for feature group selection. Finally, chunking information is not selected in either selection approach.
These experiments show that feature selection is worthwhile for TiMBL classifiers. However, it clearly does not close the gap in performance compared to CRF and SVM.
6.2.5 System evaluation
For the development of the publicly released NER system, the best-performing CRF++ classifier using all features was trained on the 1-million-word SoNaR 1 corpus. It was then used to automatically tag the remainder of the entire 500-million-word SoNaR corpus. We report results using tenfold cross-validation on SoNaR 1 in Table 10, and a confusion matrix in Table 11.
Precision Recall F-score PER 82.61 87.08 84.79 ORG 76.29 74.44 75.35 LOC 87.72 90.68 89.18 PRO 62.76 37.98 47.32 EVE 87.86 55.71 68.18 MISC 68.68 59.80 63.93 Overall 81.70 79.75 80.71
Table 10 Per-type and overall precision, recall and F-score (in percent), using tenfold cross-validation on the entire SoNaR 1 corpus.
The overall F-score of 80.71 is 3.80 percentage points lower than the overall F-score on the development set. This drop in performance is to be expected, given that the classifier was optimized for performance on the development set. Overall, precision is slightly higher than recall, but both metrics are balanced.
System output
O PER ORG LOC PRO EVE MISC
G o ld st a n d a r d O 901,102 351 483 283 829 20 693 PER 408 12,681 168 708 174 2 150 ORG 348 572 7,613 678 207 4 467 LOC 425 682 515 23,807 180 11 351 PRO 610 605 298 451 1,609 24 258 EVE 60 46 132 93 38 627 107 MISC 692 222 882 632 196 34 4,595 Table 11 Confusion matrix of classification results on the entire SoNaR 1 corpus with tenfold cross-validation. Tokens that are not part of a named entity are marked asO.
The results per main type are consistent with the amount of training data available in the corpus: location, the most frequent type, has the highest F-score, followed by person and organization. For these types, precision and recall are balanced. For products, events and miscellaneous entities, however, precision is higher than recall. Recall is low for products in particular, which are most often incorrectly tagged as not-an-entity or as persons.
We see two possible causes for the lower scores for these three types. The variance of the contexts in which persons, organizations and locations may occur is more limited than that for miscellaneous entities and products, thus making it easier to infer patterns from them. The lower availability of training instances for the less frequent types is also a hindrance to performance.
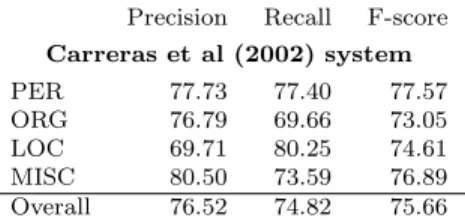
These results cannot directly be compared to output from other systems, but it is worthwhile to consider them alongside results on the Dutch shared task dataset from CoNLL-2002. In Table 12, we present the results achieved on this dataset with the system of Carreras et al (2002). To our knowledge, no work has been published that beat this system’s performance for Dutch.
Precision Recall F-score
Carreras et al (2002) system PER 77.73 77.40 77.57 ORG 76.79 69.66 73.05 LOC 69.71 80.25 74.61 MISC 80.50 73.59 76.89 Overall 76.52 74.82 75.66
Table 12 Per-type and overall precision, recall and F-score (in percent) of the Carreras et al (2002) system, on the Dutch CoNLL-2002 shared task development set.
We compare the best shared task results on the development set to our results from 10-fold cross-validation on the entire corpus (Table 10), which provides a similar difficulty (the test set is not entirely unexpected: in the case of CoNLL, it was the development set, in the case of SoNaR, 10-fold cross-validation was used).
It would be unfair to compare these results directly, because of differences in annotation scheme and dataset. Furthermore, the CoNLL-2002 shared task
focused on multilingual named entity recognition (in this case, for Spanish and Dutch). In general, however, we can observe a few parallels between the results. Overall precision and recall are well-balanced, and overall F-score is roughly comparable at around 80 per cent. Per-type precision and recall shows the same trends: better precision than recall for ORG and MISC, better recall than precision for LOC. The per-type scores on the CoNLL data have a smaller spread than those on the SoNaR data, where F-scores for PER and ORG are considerably higher, and for MISC (and PRO and EVE) considerably lower than the overall F-score.
7 Subtype classification
In this section, we describe experiments on automatic subtype prediction of named entities, after their main type has been determined.
7.1 Experimental setup
We approach subtype classification as a pure classification task, where a named entity needs to be given one of the subtypes that its main type allows. We therefore developed five separate classifiers, one for each main type that has subtypes, i.e. all main types except miscellaneous.
The input for each of these systems consisted of all named entities from the development corpus of the correct main type. In a real world setting, a subtype classification system would have to rely on imperfect main type classification for its input, with error percolation and lower performance as a result. We include an end-to-end evaluation at the end of this section.
We tested different combinations of the features described in Section 5.3, using TiMBL with k=1. CRF++ and YamCha, as opposed to TiMBL, are sequence taggers that are unsuitable for a task where instances should be classified without influence of preceding or following instances. We evaluate using threefold cross validation and report micro- and macro-averaged F-score. It is not infrequent that word forms occur multiple times, and both in the training and the test fold (e.g. countries or continents). When they have the same subtype label, their classification is trivial. However, duplicates are not necessarily redundant: more instances provide more context to generalize from, and some word forms have multiple subtype labels (e.g.Washington the state and the city). This is why we report scores over all instances (measuring overall performance), over instances already seen in training (measuring performance on possibly ambiguous word forms), and over instances not seen in training (measuring generalization performance).
We include scores for two baseline systems. The first is a na¨ıve frequency baseline that assigns the subtype label that occurs most often in training to all test instances. The second baseline is a classifier that only uses the word form as a feature, and is only capable of looking it up in the training data and
assigning the most frequent corresponding label. It can therefore be viewed as an informed lookup baseline. On unseen data, these baselines will perform identically, because the lookup baseline falls back on the most frequent class when no match is found.
7.2 Results and discussion
7.2.1 Persons
The results for subtype classification on persons are presented in Table 13. No decompounding features were used for person subtype classification, because the head of a person’s name should not be indicative of his profession. Each column in the table represents a classifier. The presence or absence of features used for each classifier is indicated with 1 or 0 in the upper section of the table. The score of the best-performing classifier per metric or subtype is boldfaced. Relative frequencies are given next to each subtype, and subtypes are ordered according to frequency.
For all instances, the classifier with all features performs best. However, for rare subtypes such as business, science, army and fiction, the lookup baseline cannot be beaten. On seen instances, all classifiers that have access to character ngram information perform best. On unseen instances, the three most frequent subtypes (politics, sports and arts) can be modeled with some success, using all features. Law and clergy entities perform well, considering their frequencies. This is due to common context words, such asadvocaten(lawyers) in the case of law entities.
7.2.2 Organizations
Table 14 presents the results for organization subtype classification. Overall, the systems with more features perform better. For all instances, the best results are achieved with all features, although leaving out decompounding in-formation has little influence on performance. Both baselines are easily beaten. For seen instances, the lookup baseline performs well, as should be ex-pected. Because of ambiguous word forms, no perfect score is achieved. For commercial and miscellaneous entities, the ambiguity is handled slightly better when ngrams and decompounding are added.
For unseen instances, decompounding hurts performance for governmental and miscellaneous organizations: the classifier with token, context and ngram information performs better. Decompounding does help for detecting com-mercial organizations. For miscellaneous organizations, the frequency baseline performs best, so no effective learning occurs. This is likely due to the hetero-geneous nature of the category.
fr eq u en cy b a se li n e lo o k u p b a se li n e Token 1 1 1 0 Context 1 0 1 0 Character ngrams 0 1 1 1 All instances (2377) Micro F-score 65.00 78.80 72.44 80.94 81.95 80.94 Macro F-score 8.75 52.32 39.19 56.66 57.63 56.66 politics 0.65 78.79 86.05 84.14 90.48 91.03 90.48 sports 0.11 0.00 57.14 46.71 63.97 68.41 63.97 arts 0.08 0.00 36.82 35.10 49.21 51.55 49.21 clergy 0.06 0.00 79.82 63.64 83.46 82.84 83.46 business 0.05 0.00 60.77 41.21 56.30 58.92 56.30 army 0.02 0.00 50.98 33.96 44.83 44.83 44.83 science 0.01 0.00 54.17 30.77 46.67 47.46 46.67 fiction 0.01 0.00 45.16 17.14 35.00 38.89 35.00 law 0.01 0.00 0.00 0.00 40.00 34.78 40.00 Seen instances (1597) Micro F-score 77.58 98.12 86.47 98.94 98.94 98.94 Macro F-score 10.92 94.54 56.36 95.85 95.85 95.85 politics 0.78 87.38 98.96 92.87 99.44 99.44 99.44 sports 0.07 0.00 99.08 60.66 98.20 98.20 98.20 clergy 0.06 0.00 92.86 74.88 96.55 96.55 96.55 business 0.04 0.00 96.49 61.22 98.28 98.28 98.28 arts 0.03 0.00 92.63 50.98 93.88 93.88 93.88 army 0.01 0.00 86.67 66.67 86.67 86.67 86.67 science 0.01 0.00 89.66 57.14 89.66 89.66 89.66 fiction 0.00 0.00 100.00 42.86 100.00 100.00 100.00
law 0.00 n/a n/a n/a n/a n/a n/a
Unseen instances (780) Micro F-score 39.23 39.23 43.72 44.10 47.56 44.10 Macro F-score 6.26 6.26 18.76 25.30 27.40 25.30 politics 0.39 56.35 56.35 58.45 61.03 62.47 61.03 sports 0.21 0.00 0.00 35.38 38.26 47.28 38.26 arts 0.18 0.00 0.00 27.00 26.85 33.04 26.85 business 0.09 0.00 0.00 21.78 16.39 22.40 16.39 clergy 0.04 0.00 0.00 26.23 38.71 40.00 38.71 army 0.03 0.00 0.00 0.00 0.00 0.00 0.00 science 0.02 0.00 0.00 0.00 6.45 6.67 6.45 fiction 0.02 0.00 0.00 0.00 0.00 0.00 0.00 law 0.02 0.00 0.00 0.00 40.00 34.78 40.00
Table 13 Classification results for person subtypes. Each column represents a classifier. The presence or absence of features used for each classifier (token, context or ngrams) is indicated with 1 or 0 in the header. Subtypes are ordered according to relative frequency, given next to each subtype.
7.2.3 Locations
The results for location subtype classification (Table 15) also show that all features are useful. When evaluating on all instances, leaving out any of the features degrades performance, except for the cosmos, water and country sub-types. The development corpus did not contain any fictitious locations.
The results on seen instances are comparable to the ones for organization subtypes: the lookup baseline is beaten by classifiers that include ngram and