Modeling of monthly rainfall and runoff of Urmia
lake basin using
“
feed-forward neural network
”
and
“
time series analysis
”
model
Jamileh Farajzadeh
a,n, Ahmad Fakheri Fard
b, Saeed Lot
fi
c aEast-Azarbaijan Regional Water Company, Tabriz, IranbDepartment of Water Engineering, Faculty of Agriculture, University of Tabriz, Tabriz, Iran cMinistry of Energy, Tehran, Iran
a r t i c l e i n f o
Article history:Received 21 April 2014 Received in revised form 29 September 2014 Accepted 5 October 2014
Keywords:
Time series forecasting Feed-forward neural network ARIMA model
Flow coefficient regime Urmia lake basin
a b s t r a c t
Urmia lake basin located in northwestern Iran is the second largest saline lake in the world. Due to many reasons i.e. climate changes, several dam constructions, building a bridge across the Lake, extra agricultural consumption and improper management of water resources, the water level of the lake has been decreased since 1997 and thousand hectares of emerged salty land has made numerous ecological and environmental problems. Therefore, an accurate forecast of the entrance runoff to the lake is important in managing the riverflow and water transfer within basins. There are various methods for time-series based forecasting; in the presented study Feed-forward Neural Network and Autocorrela-tion Regressive Integrated Moving Average (ARIMA) models were applied to forecast the monthly rainfall in Urmia lake basin. The results showed that the estimated values of monthly rainfall through Feed-forward NN were close to ARIMA model with coefficient of correlation 0.62 and the root mean square error of 12.43 mm over the 6 years test period; then rainfall amount were predicted for a 6-year period starting from 2012 (2012–2017). Using the runoff coefficient regime which was calculated from
Contents lists available atScienceDirect
journal homepage:www.elsevier.com/locate/wri
Water Resources and Industry
http://dx.doi.org/10.1016/j.wri.2014.10.003
2212-3717/&2014 The Authors. Published by Elsevier B.V. This is an open access article under the CC BY-NC-ND license (http://creativecommons.org/licenses/by-nc-nd/3.0/).
nCorresponding author at: Water Programming Office, East-Azarbaijan Regional Water Corp., 29 Bahman Blvd., PO Box 5156917737, Tabriz, Iran. Tel.:þ98 411 36698410.
parallel data of rainfall over the basin and resulted runoff for the period of 39 years, the future runoff were obtained through predicted rainfall over that period.
&2014 The Authors. Published by Elsevier B.V. This is an open
access article under the CC BY-NC-ND license (http://creativecommons.org/licenses/by-nc-nd/3.0/).
1. Introduction
Urmia lake with its previous lake area of approximately 5000–6000 km2, had a crucial socio-economic and ecological role in the Northwestern part of Iran. But during the past 15 years water level has been decreased up to 5 m. Changes occurred in lake inflows due to the climate changes, overutilization of water resources, dam constructions and reduction of precipitation over the lake basin are the main factors which reduce the lake water level [13]. The most important factor in disruption of system inflow and outflow balance is the river discharge into the lake. A great percentage of inflows to the lake are through the rivers in comparison with rainfall over the lake and groundwater. Some detailed studies are required to understand the amount of rainfall over the lake basin in the coming years for the purpose of inflow estimating through rivers to the Lake.
Several techniques which have been used for rainfall forecasting since past century were basically linear, conceptual and statistical models. One of these popular and frequently used models was ARIMA model [16,23,17,28]. Weesakul and Lowanichchai [30] used ARIMA model for annual rainfall forecasting at 31 rainfall stations in Thailand. Mahsin et al. [20]used seasonal ARIMA model for monthly rainfall forecasting in Dhaka Division of Bangladesh.
In recent two decades, Artificial Neural Networks have become a valuable method for nonlinear phenomenon modeling i.e. rainfall–runoff modeling [1,26,6,8], reservoir inflow forecasting [22], streamflow prediction[5,7,19,25,18], sea level prediction[15], water levelfluctuations[4,29]and rainfall prediction[27,3,11,2,10,9,21]. Based on these research outcomes ANNs could be appropriate method to simulate and forecasting.
Hung et al.[14]compared feed-forward neural network model with a simple persistent model for 75 rain gauge stations’hourly data in Bangkok, Thailand. They concluded that a generalized Feed-forward NN model using hyperbolic tangent transfer function achieved the best rainfall generalization with lead times varying from 1 to 3 h ahead. Moustris et al. [24] compared ANN with classical statistical methods at four meteorological stations in Greece in order to forecast the monthly mean and cumulative precipitation totals within a period of the next four consecutive months. They concluded that the ability of neural networks as a precipitation predictive tool seemed to be quite satisfactory. In the present work the Feed-forward NN and ARIMA models were applied for rainfall forecasting in Urmia lake basin andflow coefficient regime was used to estimate the entrance surface runoff to the lake.
2. Materials and methods
2.1. Study area description and problems
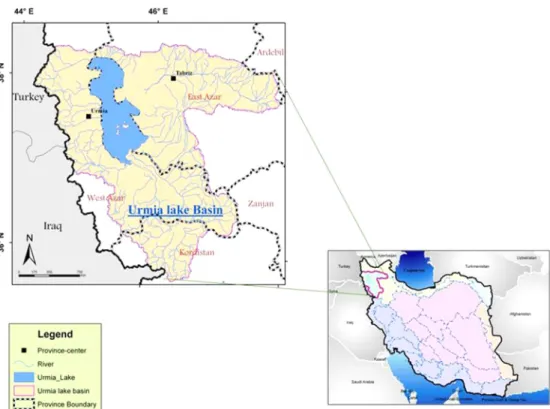
Urmia lake basin is located in northwest of Iran limited in 441070E to 471530E longitude and 351
400N to 381300N latitude with total area of about 52,679 km2(Fig. 1). Urmia lake is the largest lake in Iran and one of the world’s salt-saturated lakes that has significant role in moderating the climate of a vast area containing East and west Azarbaijan and Kurdistan provinces.
According to 39-year period of daily precipitation data (1973 to 2011) the annual mean precipitation over the basin is 352 mm. The annually increasing domestic, industrial and agricultural consumes as well as groundwater feeding along the river which were supplied through the riverflow
caused the significant reduction in discharge to the lake. Having significant changed during the past 15 years (1997–2011) the lake level has been reduced from 1276 m to 1271.3 m approximately up to 5 m which was caused the lake surface to be reduced from 5400 to 3000 km2; so the large salty area resulted from the lake recession, motivated numerous ecological and environmental problems, i.e. salt movement from the lake toward agricultural areas and significantly reduction of Artemia population as an important creature of lake feeding thousands of local and migratory birds.
2.2. Brief theory of models used in the study
2.2.1. Autocorrelation regressive integrated moving average (ARIMA)
Combination of deterministic, stochastic and seasonal properties in a system causes the system to follow the ARIMA model. In a system, deterministic or memory properties are the sequentially relation of events, stochastic properties come from instantaneous climate shocks and seasonality is the periodically repetition of events. So the rainfall–runoff system in a catchment with storage properties which includes snow, groundwater and lake storage, similarity in events and basin morphology could be analyzed by ARMA model. The general ARMA(p,q) model is:
zt¼ ∑p j ¼1φ jztj– ∑ q j ¼0θ jεtj ð1Þ
whereεtjis lagged white noise byjandθj,φjare model’s parameters that indicate participation of the previous events in actual event. According to seasonality order d, the ARIMA model could be established by differencing the seasonal data d times. I.e. ford¼1 the differenced data is:
ut¼ztztw ð2Þ
wis the differenced time period and ford¼2 data converted to:
yt¼ututw ð3Þ
In fact the ARIMA model is ARMA using differenced data. 2.2.2. Feed-forward neural network
Artificial Neural Network has been inspired from billions of interconnected neurons in human brain based on a mathematical configuration. It has been proven that ANN could be a better efficient alternative for traditional methods for modeling the nonlinear time series. Neural network must be able to greatly map the data set of numeric inputs to the set of numeric targets. The applied network is a two-layer Feed-forward with sigmoid hidden and linear output neurons. This network was trained with Levenberg–Marquardt backpropagation (LMBP) algorithm as the fastest method for training moderate sized Feed-forward Neural Networks (up to several hundred weights). This algorithm uses the approximate Hessian matrix in the weight update procedure as follows:
xkþ1¼xk½HþμI1g ð4Þ
whereH¼JTJdenotes the approximate Hessian matrix,
μis a small scalar that controls the learning process,Iis the identity matrix,g¼JTecomputes the gradient,Jis the Jacobian matrix that contains first derivatives of the network errors with respect to the weights and biases, andeis residual error. The LMBP algorithm is used to train the proposed network model[12]. In this research neural network with LMBP was applied for prediction of monthly rainfall using MATLAB software.
3. Results and discussion
3.1. Rainfall, runoff andflow coefficient
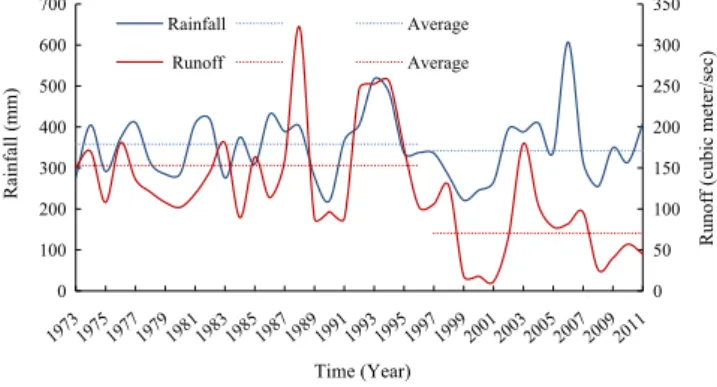
The monthly rainfall data of 228 stations located inside and outside of Urmia lake basin as well as the monthlyflow data of 18 hydrometric stations located around the lake were used to analyze and model the rainfall–runoff relationship. According toFig. 2the average of annual rainfall andflow time series were abruptly reduced since 1997 as the average rainfall reduced from 358 to 342 mm whereas the average offlow reduced from 4.8 to 2.2 CBM per year.
Since precipitation in warm months of the year is not sufficient enough to compensate the various gross water requirements mainly in land irrigation, some small and large dams have been built on the main rivers to store water during wet seasons to supply these needs. It seems the constructed dams have a great role in reducing the level of lake water (Fig. 3).
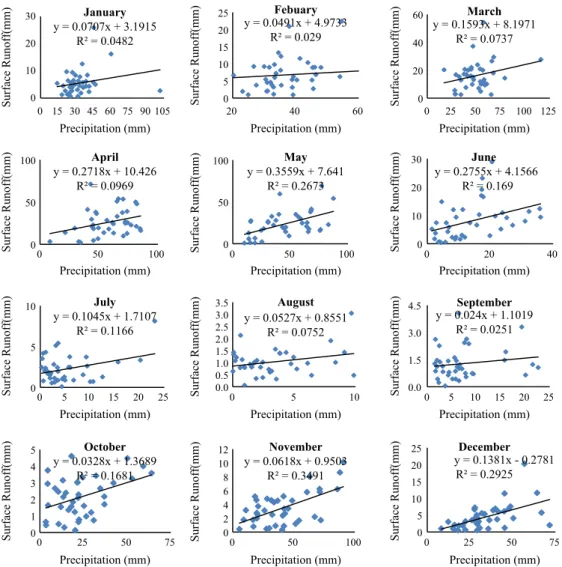
Runoff coefficient is a key parameter in determining the amount of runoff generated from rainfall in a basin which can be calculated in different time period from short (the moment) to long (annual) terms. In this study, the regime of runoff coefficient over the Urmia lake basin was obtained through
0 50 100 150 200 250 300 350 0 100 200 300 400 500 600 700
Runoff (cubic meter/sec)
Rainfall (mm)
Time (Year) Rainfall Average
Runoff Average
0 200 400 600 800 1000 1200 1400 0 10 20 30 40 50 60 70 (MCM) (mm) Time (Month) Monthly Average Precipitation over the Basin (mm) Gross Water Requirement (MCM)
Fig. 3.Monthly precipitation regime and gross water requirement in Urmia lake basin.
y = 0.0707x + 3.1915 R² = 0.0482 0 10 20 30 0 15 30 45 60 75 90 105 Surface Runoff(mm) Precipitation (mm) January y = 0.0491x + 4.9733 R² = 0.029 0 5 10 15 20 25 20 40 60 Surface Runoff(mm) Precipitation (mm) Febuary y = 0.1593x + 8.1971 R² = 0.0737 0 20 40 60 0 25 50 75 100 125 Surface Runoff(mm) Precipitation (mm) March y = 0.2718x + 10.426 R² = 0.0969 0 50 100 0 50 100 Surface Runoff(mm) Precipitation (mm) April y = 0.3559x + 7.641 R² = 0.2673 0 50 100 0 50 100 Surface Runoff(mm) Precipitation (mm) May y = 0.2755x + 4.1566 R² = 0.169 0 10 20 30 0 20 40 Surface Runoff(mm) Precipitation (mm) June y = 0.1045x + 1.7107 R² = 0.1166 0 5 10 0 5 10 15 20 25 Surface Runoff(mm) Precipitation (mm) July y = 0.0527x + 0.8551 R² = 0.0752 0.0 0.5 1.0 1.5 2.0 2.5 3.0 3.5 0 5 10 Surface Runoff(mm) Precipitation (mm) August y = 0.024x + 1.1019 R² = 0.0251 0.0 1.5 3.0 4.5 0 5 10 15 20 25 Surface Runoff(mm) Precipitation (mm) September y = 0.0328x + 1.3689 R² = 0.1681 0 1 2 3 4 5 0 25 50 75 Surface Runoff(mm) Precipitation (mm) October y = 0.0618x + 0.9503 R² = 0.3491 0 2 4 6 8 10 12 0 50 100 Surface Runoff(mm) Precipitation (mm) November y = 0.1381x - 0.2781 R² = 0.2925 0 5 10 15 20 25 0 25 50 75 Surface Runoff(mm) Precipitation (mm) December
the slope of rainfall–runoff charts for each month according toFigs. 4and5.Fig. 5shows the monthly regime of runoff coefficients.
The runoff data calculated through runoff coefficient regime were compared with observations and obtained correlation coefficient was 0.76.
3.2. Prediction of rainfall and runoff
In this study, 27 years monthly rainfall data set picked up from a data set of 39 years as input and the same set lagged by 6 years, as output were used in a two-layer Feed-forward Network assigning 10 sigmoid hidden neurons selected through trial and error procedure. For training, validation and testing of Feed-forward NN model, 70, 15 and 15 percent of data were used; whereas coefficients of correlation were obtained 91, 80 and 74 percent, respectively. The ending 6 years data set were used to compare the observed and calculated set (Fig. 6).
In this study we also used Box–Jenkins methodology to build ARIMA model for 33 years monthly rainfall data. The model of ARIMA (2,0,0)(4,1,2)12was found to be proper to forecast the monthly rainfall for the remaining 6 years data set (Fig. 6).
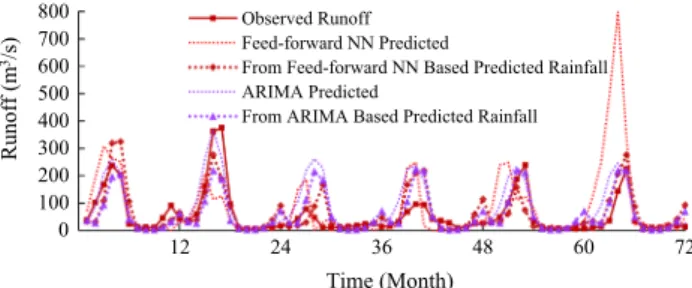
Fig. 6shows the plot of predicted vs. observed values of the monthly rainfall data from 2006 to 2011 using both Feed-forward NN and ARIMA procedures. Monthly runoff was computed by use of runoff coefficient and monthly rainfall predicted from Feed-forward NN and ARIMA models and also directly through Feed-forward NN and ARIMA models during the 72 months testing period (Fig. 7).
Two different types of statistical measures were used to analyze the coordination between forecasted and actual rainfall during the testing period. These measures include the Root Mean Square Error (RMSE) and the Mean Absolute Error (MAE) to examine the relative accuracy of both models for
0.0 0.1 0.2 0.3 0.4 0.5 Flow Coefficient Time (Month)
Fig. 5.The regime offlow coefficient over the Urmia lake basin.
0 20 40 60 80 100 120 140 12 24 36 48 60 72 Rainfall (mm) Time (Month) Observed Rainfall Feed-forward NN Predicted ARIMA Predicted
monthly rainfall as represented by Eqs. (5) and (6). RMSE ¼ ∑M j¼1 PRðjÞARðjÞ ð Þ2 =M !1=2 ð5Þ 0 100 200 300 400 500 600 700 800 12 24 36 48 60 72 Observed Runoff Feed-forward NN Predicted
From Feed-forward NN Based Predicted Rainfall ARIMA Predicted
From ARIMA Based Predicted Rainfall
Fig. 7.Comparison of observed runoff and runoff obtained from rainfall predicted through Feed-forward NN and ARIMA methods.
Table 1
Comparative performance of feed-forward NN and ARIMA techniques for monthly rainfall test data set and monthly calculated runoff (a) and monthly runoff test data set (b).
(a)
Techniques Error measures for monthly Error measures for monthly Rainfall test data set Calculated runoff
R RMSE (mm) MAE (mm) R RMSE (mm) MAE (mm)
Feed-forward NN 0.663 21.07 14.03 0.754 3.92 2.55
ARIMA (2,0,0)(4,1,2)12
0.654 21.4 14.64 0.75 3.76 2.35
(b)
Techniques Error measures for monthly
Runoff test data set
R RMSE (mm) MAE (mm) Feed-forward NN 0.465 8.4 4.35 ARIMA (2,1,2)(4,0,0)12 0.784 4.35 2.56 0 200 400 600 800 1000 1200
MAE¼ 1 M ∑ M j¼1 PRðjÞARðjÞj ð6Þ
where PRðjÞ and ARðjÞ are the predicted and actual rainfall, respectively; M is the number of the months.Table 1shows the estimated errors for monthly rainfall test data set as well as for monthly calculated runoff.
Residual Plots for C1
60 30 0 -30 0.999 0.99 0.9 0.5 0.1 0.01 0.001 Residual Probability 80 60 40 20 0 60 40 20 0 -20 Residual 45 30 15 0 -15 -30 100 75 50 25 0 Residual Frequency 350 300 250 200 150 100 50 1 60 40 20 0 -20 Observation Order Residual
Normal Probability Plot Versus Fits
Histogram Versus Order Fitted Value
Residual Plots for C1
30 20 10 0 -10 Residual Probability 60 45 30 15 0 30 20 10 0 -10 Fitted Value Residual 24 18 12 6 0 -6 -12 160 120 80 40 0 Residual Frequency 350 300 250 200 150 100 50 1 30 20 10 0 -10 ObservationOrder Residual
Normal Probability Plot Versus Fits
Histogram Versus Order 0.999 0.99 0.9 0.5 0.1 0.01 0.001
According toTable 1it can be revealed that the predicted value of monthly rainfall by Feed-forward NN are almost closer to those predicted from ARIMA (2,0,0)(4,1,2)12; whereas the predicted runoff through ARIMA (2,1,2)(4,0,0)12procedure could provide better outcomes than those predicted from Feed-forward NN model.Fig. 8shows the estimated runoff for 6 years 2012 to 2017.
To verify the goodness offit of predicted rainfall and runoff from ARIMA as well as Feed-forward NN models for normality of errors, the Frequency distribution of residuals histogram and P–P histogram were presented (Fig. 9). The bell-shaped histogram and colonization of residuals around the normal lines and also standing of serial correlations of errors within the independency bond of ACF diagrams suggested that the model covered the deterministic part of data structure and extracted the white noise perfectly (Fig. 10).
4. Conclusion
The results of this research indicate that the predicted monthly rainfall through feed-forward NN and ARIMA (2,0,0)(4,1,2)12models are similar and have not significant difference which are nearly close to the actual values. The predicted monthly runoff results through Feed-forward NN and ARIMA (2,1,2)(4,0,0)12models show a big difference while the results of the ARIMA (2,1,2)(4,0,0)12model are close to the real ones. It seems that due to low inflow values to the lake in the 4 years period (from 1998 to 2002) which is associated with low precipitation and dam constructions, the model of
feed-60 54 48 42 36 30 24 18 12 6 1 Lag Lag 1.0 0.8 0.6 0.4 0.2 0.0 -0.2 -0.4 -0.6 -0.8 -1.0 Autocorrelation
ACF of Residuals for C1
(with 5% significance limits for the autocorrelations)
ACF of Residuals for C1
(with 5% significance limits for the autocorrelations)
60 54 48 42 36 30 24 18 12 6 1 1.0 0.8 0.6 0.4 0.2 0.0 -0.2 -0.4 -0.6 -0.8 -1.0 Au t o c o r r e la t io n
forward NN couldn’t been well trained. The results of this model show a difference input volume of about 318 MCM per year which is a considerable amount during 6 years period.
It can be concluded that for predicting upcoming runoff the ARIMA (2,1,2)(4,0,0)12model is better compared to feed-forward NN model. Also, it can be calculated by using the predicted rainfall from each model and runoff coefficient.
In case of runoff caused from runoff coefficient on rainfall both methods show high accuracy and similarity. The fairly high correlation coefficients RF–fNN¼0.754 orRARIMA¼0.75 implied that both models were able to cover the variance of observed data.
The aim of this paper is mainly to investigate the runoff made by rainfall and it suggests that there is little runoff toward the lake but it cannot make the balance of the lake positive. To make this happen, there should be a careful management of water resources in terms of water consumption and the most important items in this are reduction of agricultural uses and reduction of excessive groundwater withdrawal; As lowering of ground water levels in the basin, especially in rivers has reduced theflow coefficient drastically and has made the lake balance negative. Therefore, if careful management of water resources increases the groundwater level in river basin, it will lead the lake toward revival.
Acknowledgments
The authors wish to thank the East-Azarbaijan Regional Water Company who provided the relative data.
References
[1]R.J. Abrahart, Neural network rainfall–runoff forecasting based on continuous resampling, J. Hydroinf. 5 (2003) 51–61. [2]S. Afshin, H. Fahmi, A. Alizadeh, H. Sedghi, F. Kaveh, Long term rainfall forecasting by integrated artificial neural
network-fuzzy logic-wavelet model in Karoon basin, Sci. Res. Essays 6 (6) (2011) 1200–1208.
[3]H. Aksoy, A. Dahamsheh, Artificial neural network models for forecasting monthly precipitation in Jordan, Stochastic Environ. Res. Risk Assess. 23 (2009) 917–931.
[4]A. Altunkaynak, Forecasting surface water levelfluctuations of lake van by artificial neural networks, Water Resour. Manage. 21 (2007) 399–408.
[5]S.R. Asati, S.S. Rathore, Comparative study of streamflow prediction models, Int. J. LifeSci. Biotecnol. Pharm. Res. 1 (2012) 139–151.
[6]A. Bhadra, A. Bandyopadhyay, R. Singh, N.S. Raghuwanshi, Rainfall–runoff modeling: comparison of two approaches with different data requirements, Water Resour. Manage. 24 (2010) 37–62.
[7]İ. Can, F. Tosunoğlu, E. Kahya, Daily streamflow modelling using autoregressive moving average and artificial neural networks models: case study of Çoruh basin, Turkey, Water Environ. J. 26 (2012) 567–576.
[8]A.A. Cheleng, Rainfall–runoff modeling based on artificial neural networks (ANNs), Eur. J. Sci. Res. 65 (2011) 490–506. [9]A. El-Shafie, A. Noureldin, M. Taha, A. Hussain, M. Mukhlisin, Dynamic versus static neural network model for rainfall
forecasting at Klang River Basin, Malaysia, Hydrol. Earth Syst. Sci. 16 (2012) 1151–1169.
[10]A.H. El-Shafie, A. El-Shafie, H.G. El Mazoghi, A. Shehata, M.R. Taha, Artificial neural network technique for rainfall forecasting applied to Alexandria, Egypt, Int. J. Phys. Sci. 6 (2011) 1306–1316.
[11]M.H. Gholizadeh, M. Darand, Forecasting precipitation with artificial neural networks (case study: Tehran), J. Appl. Sci. 9 (2009) 1786–1790.
[12]M.T. Hagan, M.B. Menhaj, Training feedforward networks with the Marquardt algorithm, IEEE Trans. Neural Networks 5 (1994) 989–993.
[13]E. Hassanzadeh, M. Zarghami, Y. Hassanzadeh, Determining the main factors in declining the Urmia lake level by using system dynamics modeling, Water Resour. Manage. 26 (2012) 129–145.
[14]N.Q. Hung, M.S. Babel, S. Weesakul, N.K. Tripathi, An artificial neural network model for rainfall forecasting in Bangkok, Thailand, Hydrol. Earth Syst. Sci. 13 (2009) 1413–1425.
[15]M. Imani, R.J. You, C.Y. Kuo, Caspian Sea level prediction using satellite altimetry by artificial neural networks, Int. J. Environ. Sci. Technol. 11 (2014) 1035–1042.
[16]I. Kaushik, S. Madhvi Singh, Seasonal ARIMA model for forecasting of monthly rainfall and temperature, J.Environ. Res. Dev. 3 (2008) 506–514.
[17]B.S. Kim, S.Z. Hossein, G. Choi, Evaluation of temporal-spatial precipitation variability and prediction using seasonal ARIMA model in Mongolia, KSCE J. Civil Eng. 15 (2011) 917–925.
[18]K.K. Kuok, S. Harun, S.M. Shamsuddin, Particle swarm optimization feedforward neural network for modeling runoff, Int. J. Environ. Sci. Technol. 7 (2010) 67–78.
[19]F. Liu, J.-Z. Zhou, F.-P. Qiu, J.-J. Yang, Biased wavelet neural network and its application to streamflow forecast, in: J. Wang, Z. Yi, J. Zurada, B.-L. LU, H. Yin (Eds.), Advances in Neural Networks—ISNN 2006, Springer, Berlin, Heidelberg, 2006.
[20]M. Mahsin, Y. Akhter, M. Begum, Modeling rainfall in Dhaka Division of Bangladesh using time series analysis, J. Math. Modell. Appl. 1 (2012) 67–73.
[21]T. Mandal, V. Jothiprakash, Short-term rainfall prediction using ANN and MT techniques, ISH J. Hydraul. Eng. 18 (2012) 20–26.
[22]K. Mohammadi, H.R. Eslami, S. Dayyani Dardashti, Comparison of regression, ARIMA and ANN models for reservoir inflow forecasting using Snowmelt equivalent (a case study of Karaj), J. Agric. Sci. Technol. 7 (2005) 17–30.
[23]P.E.N.M. Momani, Time series analysis model for rainfall data in Jordan: case study for using time series analysis, Am. J. Environ. Sci. 5 (2009) 599–604.
[24]K.P. Moustris, I.K. Larissi, P.T. Nastos, A.G. Paliatsos, Precipitation forecast using artificial neural networks in specific regions of Greece, Water Resour. Manage. 25 (2011) 1979–1993.
[25]D. Nagesh Kumar, K. Srinivasa Raju, T. Sathish, Riverflow forecasting using recurrent neural networks, Water Resour. Manage. 18 (2004) 143–161.
[26]V. Nourani, M. Komasi, A. Mano, A multivariate ANN-wavelet approach for rainfall–runoff modeling, Water Resour. Manage. 23 (2009) 2877–2894.
[27]M.C.V. Ramírez, N.J. Ferreira, H.F.D.C. Velho, Linear and nonlinear statistical downscaling for rainfall forecasting over Southeastern Brazil, Weather Forecast. 21 (2006) 969–989.
[28]S.M. Singh, P.R. Maiti, S. Shaiwalini, Statistical modeling of climate parameters, Asian J. Curr. Eng. Maths 1 (2012) 29–33. [29]J. Wang, J. Sui, L. Guo, B.W. Karney, R. Jüpner, Forecast of water level and ice jam thickness using the back propagation
neural network and support vector machine methods, Int. J. Environ. Sci. Technol. 7 (2010) 215–224.
[30]U. Weesakul, S. Lowanichchai, Rainfall forecast for agricultural water allocation planning in Thailand, Thammasat Int. J. Sci. Technol. 10 (2005) 18–27.