Programme for International Student Assessment
Creative Problem Solving
StudentS’ SkIllS In tACklIng
ReAl-lIfe PRoblemS
Creative Problem Solving
StudentS’ SkillS in tackling
real-life problemS
(Volume V)
note by turkey: the information in this document with reference to “cyprus” relates to the southern part of the island. there is no single authority representing both turkish and greek cypriot people on the island. turkey recognises the turkish republic of northern cyprus (trnc). until a lasting and equitable solution is found within the context of the united nations, turkey shall preserve its position concerning the “cyprus issue”.
note by all the european union member States of the oecd and the european union: the republic of cyprus is recognised by all members of the united nations with the exception of turkey. the information in this document relates to the area under the effective control of the government of the republic of cyprus.
the statistical data for israel are supplied by and under the responsibility of the relevant israeli authorities. the use of such data by the oecd is without prejudice to the status of the golan Heights, east Jerusalem and israeli settlements in the West bank under the terms of international law.
Photo credits:
© flying colours ltd /getty images © Jacobs Stock photography /kzenon © khoa vu /flickr /getty images © mel curtis /corbis
© Shutterstock /kzenon © Simon Jarratt /corbis
corrigenda to oecd publications may be found on line at: www.oecd.org/publishing/corrigenda. © oecd 2014
You can copy, download or print oecd content for your own use, and you can include excerpts from oecd publications, databases and multimedia products in your own documents, presentations, blogs, websites and teaching materials, provided that suitable acknowledgement of oecd as source and copyright owner is given. all requests for public or commercial use and translation rights should be submitted to [email protected]. requests for permission to photocopy portions of this material for public or commercial use shall be addressed directly to the copyright clearance center (ccc) at [email protected] or the centre français d’exploitation du droit de copie (cfc) at [email protected].
this document and any map included herein are without prejudice to the status of or sovereignty over any territory, to the delimitation of international frontiers and boundaries and to the name of any territory, city or area.
Please cite this publication as:
oecd (2014), PISA 2012 Results: Creative Problem Solving: Students’ Skills in Tackling Real-Life Problems
(Volume V), piSa, oecd publishing. http://dx.doi.org/10.1787/9789264208070-en
iSbn 978-92-64-20806-3 (print) iSbn 978-92-64-20807-0 (pdf)
Equipping citizens with the skills necessary to achieve their full potential, participate in an increasingly interconnected global economy, and ultimately convert better jobs into better lives is a central preoccupation of policy makers around the world. Results from the OECD’s recent Survey of Adult Skills show that highly skilled adults are twice as likely to be employed and almost three times more likely to earn an above-median salary than poorly skilled adults. In other words, poor skills severely limit people’s access to better-paying and more rewarding jobs. Highly skilled people are also more likely to volunteer, see themselves as actors rather than as objects of political processes, and are more likely to trust others. Fairness, integrity and inclusiveness in public policy thus all hinge on the skills of citizens.
The ongoing economic crisis has only increased the urgency of investing in the acquisition and development of citizens’ skills – both through the education system and in the workplace. At a time when public budgets are tight and there is little room for further monetary and fiscal stimulus, investing in structural reforms to boost productivity, such as education and skills development, is key to future growth. Indeed, investment in these areas is essential to support the recovery, as well as to address long-standing issues such as youth unemployment and gender inequality.
In this context, more and more countries are looking beyond their own borders for evidence of the most successful and efficient policies and practices. Indeed, in a global economy, success is no longer measured against national standards alone, but against the best-performing and most rapidly improving education systems. Over the past decade, the OECD Programme for International Student Assessment, PISA, has become the world’s premier yardstick for evaluating the quality, equity and efficiency of school systems. But the evidence base that PISA has produced goes well beyond statistical benchmarking. By identifying the characteristics of high-performing education systems PISA allows governments and educators to identify effective policies that they can then adapt to their local contexts.
The results from the PISA 2012 assessment, which was conducted at a time when many of the 65 participating countries and economies were grappling with the effects of the crisis, reveal wide differences in education outcomes, both within and across countries. Using the data collected in previous PISA rounds, we have been able to track the evolution of student performance over time and across subjects. Of the 64 countries and economies with comparable data, 40 improved their average performance in at least one subject. Top performers such as Shanghai in China or Singapore were able to further extend their lead, while countries like Brazil, Mexico, Tunisia and Turkey achieved major improvements from previously low levels of performance.
Some education systems have demonstrated that it is possible to secure strong and equitable learning outcomes at the same time as achieving rapid improvements. Of the 13 countries and economies that significantly improved their mathematics performance between 2003 and 2012, three also show improvements in equity in education during the same period, and another nine improved their performance while maintaining an already high level of equity – proving that countries do not have to sacrifice high performance to achieve equity in education opportunities.
Nonetheless, PISA 2012 results show wide differences between countries in mathematics performance. The equivalent of almost six years of schooling, 245 score points, separates the highest and lowest average performances
of the countries that took part in the PISA 2012 mathematics assessment. The difference in mathematics performances within countries is even greater, with over 300 points – the equivalent of more than seven years of schooling – often separating the highest- and the lowest-achieving students in a country. Clearly, all countries and economies have excellent students, but few have enabled all students to excel.
The report also reveals worrying gender differences in students’ attitudes towards mathematics: even when girls perform as well as boys in mathematics, they report less perseverance, less motivation to learn mathematics, less belief in their own mathematics skills, and higher levels of anxiety about mathematics. While the average girl underperforms in mathematics compared with the average boy, the gender gap in favour of boys is even wider among the highest-achieving students. These findings have serious implications not only for higher education, where young women are already under-represented in the science, technology, engineering and mathematics fields of study, but also later on, when these young women enter the labour market. This confirms the findings of the OECD Gender Strategy, which identifies some of the factors that create – and widen – the gender gap in education, labour and entrepreneurship. Supporting girls’ positive attitudes towards and investment in learning mathematics will go a long way towards narrowing this gap.
PISA 2012 also finds that the highest-performing school systems are those that allocate educational resources more equitably among advantaged and disadvantaged schools and that grant more autonomy over curricula and assessments to individual schools. A belief that all students can achieve at a high level and a willingness to engage all stakeholders in education – including students, through such channels as seeking student feedback on teaching practices – are hallmarks of successful school systems.
PISA is not only an accurate indicator of students’ abilities to participate fully in society after compulsory school, but also a powerful tool that countries and economies can use to fine-tune their education policies. There is no single combination of policies and practices that will work for everyone, everywhere. Every country has room for improvement, even the top performers. That’s why the OECD produces this triennial report on the state of education across the globe: to share evidence of the best policies and practices and to offer our timely and targeted support to help countries provide the best education possible for all of their students. With high levels of youth unemployment, rising inequality, a significant gender gap, and an urgent need to boost growth in many countries, we have no time to lose. The OECD stands ready to support policy makers in this challenging and crucial endeavour.
Angel Gurría
This report is the product of a collaborative effort between the countries participating in PISA, the experts and institutions working within the framework of the PISA Consortium, and the OECD Secretariat. The report was drafted by Andreas Schleicher, Francesco Avvisati, Francesca Borgonovi, Miyako Ikeda, Hiromichi Katayama, Flore-Anne Messy, Chiara Monticone, Guillermo Montt, Sophie Vayssettes and Pablo Zoido of the OECD Directorate for Education and Skills and the Directorate for Financial Affairs, with statistical support from Simone Bloem and Giannina Rech and editorial oversight by Marilyn Achiron. Additional analytical and editorial support was provided by Adele Atkinson, Jonas Bertling, Marika Boiron, Célia Braga-Schich, Tracey Burns, Michael Davidson, Cassandra Davis, Elizabeth Del Bourgo, John A. Dossey, Joachim Funke, Samuel Greiff, Tue Halgreen, Ben Jensen, Eckhard Klieme, André Laboul, Henry Levin, Barry McCrae, Juliette Mendelovits, Tadakazu Miki, Christian Monseur, Simon Normandeau, Lorena Ortega, Mathilde Overduin, Elodie Pools, Dara Ramalingam, William H. Schmidt (whose work was supported by the Thomas J. Alexander fellowship programme), Kaye Stacey, Lazar Stankov, Ross Turner, Elisabeth Villoutreix and Allan Wigfield. The system-level data collection was conducted by the OECD NESLI (INES Network for the Collection and Adjudication of System-Level Descriptive Information on Educational Structures, Policies and Practices) team: Bonifacio Agapin, Estelle Herbaut and Jean Yip. Volume II also draws on the analytic work undertaken by Jaap Scheerens and Douglas Willms in the context of PISA 2000. Administrative support was provided by Claire Chetcuti, Juliet Evans, Jennah Huxley and Diana Tramontano.
The OECD contracted the Australian Council for Educational Research (ACER) to manage the development of the mathematics, problem solving and financial literacy frameworks for PISA 2012. Achieve was also contracted by the OECD to develop the mathematics framework with ACER. The expert group that guided the preparation of the mathematics assessment framework and instruments was chaired by Kaye Stacey; Joachim Funke chaired the expert group that guided the preparation of the problem-solving assessment framework and instruments; and Annamaria Lusardi led the expert group that guided the preparation of the financial literacy assessment framework and instruments. The PISA assessment instruments and the data underlying the report were prepared by the PISA Consortium, under the direction of Raymond Adams at ACER.
The development of the report was steered by the PISA Governing Board, which is chaired by Lorna Bertrand (United Kingdom), with Ben
ő
Csapó (Hungary), Daniel McGrath (United States) and Ryo Watanabe (Japan) as vice chairs. Annex C of the volumes lists the members of the various PISA bodies, as well as the individual experts and consultants who have contributed to this report and to PISA in general.ExEcutivE Summary ...13
rEadEr’S GuidE ...17
What iS PiSa? ...19
ChApter 1 aSSESSinG ProblEm-SolvinG SkillS in PiSa 2012 ...25
Why PiSa assesses problem-solving competence ...26
the PiSa 2012 approach to assessing student performance in problem solving ...29
• A focus on general cognitive processes involved in solving problems ...29
• The centrality of interactive problem solving ...29
• The PISA definition of problem-solving competence ...30
the PiSa 2012 framework for assessing problem-solving competence...31
the design and delivery of the PiSa 2012 computer-based assessment of problem solving ...32
• The development of items for the assessment ...32
• The structure and delivery of the assessment ...32
• The opportunities afforded by computer delivery ...33
Problem-solving tasks ...34
• General characteristics of static and interactive problem-solving tasks ...34
• Sample tasks from the PISA 2012 problem-solving assessment ...35
ChApter 2 StudEnt PErformancE in ProblEm SolvinG ...47
how the PiSa 2012 problem-solving results are reported ...48
• How the PISA 2012 problem-solving tests were analysed and scaled ...48
• How problem-solving proficiency levels are defined in PISA 2012 ...49
• A profile of PISA problem-solving questions ...49
What students can do in problem solving ...51
• Average level of proficiency in problem solving ...52
• Students at the different levels of proficiency in problem solving ...56
variation in problem-solving proficiency ...61
• Relationship between performance differences and school- and student-level factors ...64
• Comparing between-school variations ...66
Student performance in problem solving compared with performance in mathematics, reading and science ...67
• Correlation between performance in mathematics, reading and science, and performance in problem solving ...67
• Students’ performance in problem solving relative to students with similar mathematics, reading and science skills ...69
• Students’ performance in problem solving at different levels of performance in mathematics ...70
• The influence of computer delivery on performance in problem solving ...73
ChApter 3 StudEntS’ StrEnGthS and WEaknESSES in ProblEm SolvinG ...77
framework aspects and relative success of students in each area ...79
• Nature of the problem situation ...79
• Problem-solving processes ...82
ChApter 4 hoW ProblEm-SolvinG PErformancE variES Within countriES ...93
Performance differences unique to problem solving ...94
Performance differences across study programmes ...95
Gender differences in problem solving ...99
• How gender differences in problem-solving performance compare to differences in mathematics, reading and science performance ...100
• Differences in performance patterns across items ...102
the relationship between socio-economic status, immigrant background and problem-solving performance ...104
• Performance differences related to socio-economic status ...104
• Performance patterns among advantaged and disadvantaged students ...108
• Immigrant background and student performance ...110
how students’ self-reported dispositions towards problem solving relate to performance ...111
how problem-solving performance relates to differences in ict use across students ...111
ChApter 5 imPlicationS of thE ProblEm-SolvinG aSSESSmEnt for Policy and PracticE ...117
improve assessments to make learning more relevant ...118
Empower students to solve problems ...120
revise school practices and education policies ...122
learn from curricular diversity and performance differences in problem solving ...125
reduce gender disparities among top performers...126
reduce inequities in education related to socio-economic status ...126
Annex A PiSa 2012 tEchnical backGround ...129
annex a1 Indices from the student context questionnaires ...130
annex a2 The PISA target population, the PISA samples and the definition of schools ...134
annex a3 Technical notes on analyses in this volume...145
annex a4 Quality assurance ...149
annex a5 The problem-solving assessment design ...150
annex a6 Technical note on Brazil...152
Annex B PiSa 2012 data ...153
annex b1 Results for countries and economies ...154
annex b2 Results for regions within countries...224
annex b3 List of tables available on line ...243
FIGURES
Figure V.1.1 Trends in the demand for skills: Germany, United States and Japan ...27
Figure V.1.2 Main features of the PISA problem-solving framework ...31
Figure V.1.3 The test interface ...33
Figure V.1.4 MP3 PLAYER: Stimulus information ...35
Figure V.1.5 MP3 PLAYER: Item 1 ...35
Figure V.1.6 MP3 PLAYER: Item 2 ...36
Figure V.1.7 MP3 PLAYER: Item 3 ...36
Figure V.1.8 MP3 PLAYER: Item 4 ...37
Figure V.1.9 CLIMATE CONTROL: Stimulus information ...37
Figure V.1.10 CLIMATE CONTROL: Item 1 ...38
Figure V.1.11 CLIMATE CONTROL: Item 2 ...38
Figure V.1.12 TICKETS: Stimulus information ...39
Figure V.1.13 TICKETS: Item 1 ...39
Figure V.1.14 TICKETS: Item 2 ...40
Figure V.1.15 TICKETS: Item 3 ...40
Figure V.1.16 TRAFFIC: Stimulus information ...41
Figure V.1.17 TRAFFIC: Item 1 ...41
Figure V.1.18 TRAFFIC: Item 2 ...42
Figure V.1.19 TRAFFIC: Item 3 ...42
Figure V.1.20 ROBOT CLEANER: Stimulus information ...42
Figure V.1.21 ROBOT CLEANER: Item 1 ...43
Figure V.1.22 ROBOT CLEANER: Item 2 ...43
Figure V.1.23 ROBOT CLEANER: Item 3 ...44
Figure V.2.1 Relationship between questions and student performance on a scale...49
Figure V.2.2 Map of selected problem-solving questions, illustrating the proficiency levels ...50
Figure V.2.3 Comparing countries’ and economies’ performance in problem solving ...52
Figure V.2.4 Problem-solving performance among participating countries/economies...54
Figure V.2.5 Summary descriptions of the six levels of proficiency in problem solving ...57
Figure V.2.6 Proficiency in problem solving ...58
Figure V.2.7 Top performers in problem solving ...61
BOXES Box V.1.1. Long-term trends in the demand for problem-solving skills ...27
Box V.2.1. How students progress in problem solving ...51
Box V.2.2. What is a statistically significant difference? ...53
Box V.2.3. Interpreting differences in PISA problem-solving scores: How large a gap? ...55
Box V.2.4. Top performers in problem solving ...60
Box V.3.1. How item-level success is reported ...78
Box V.5.1. When solutions are taught, problem solving is not learned ...119
Box V.5.2. Developing a curriculum for the 21st century in Alberta (Canada) ...119
Box V.5.3. Problem-solving skills are best developed within meaningful contexts ...121
Box V.5.4. What is metacognitive instruction? ...121
Box V.5.5. Teaching problem-solving skills through the visual arts ...122
Box V.5.6. Developing and assessing problem-solving skills in Singapore ...123
Figure V.2.9 Performance differences among high- and low-achieving students ...63
Figure V.2.10 Average performance in problem solving and variation in performance ...64
Figure V.2.11 Total variation in problem-solving performance and variation between and within schools ...65
Figure V.2.12 Between-school differences in problem-solving performance, mathematics performance and socio-economic status ...66
Figure V.2.13 Relationship among problem-solving, mathematics, reading and science performance ...68
Figure V.2.14 Variation in problem-solving performance associated with performance in mathematics, reading and science ...68
Figure V.2.15 Relative performance in problem solving ...69
Figure V.2.16 Expected performance in problem solving, by mathematics performance ...71
Figure V.2.17 Patterns of relative performance in problem solving ...72
Figure V.2.18 Influence of computer skills on the ranking of students within countries/economies ...73
Figure V.2.19 Influence of computer skills on relative performance in problem solving ...74
Figure V.3.1 Number of tasks, by framework aspect ...79
Figure V.3.2 Examples of problem-solving tasks, by nature of the problem ...80
Figure V.3.3 Differences in countries’/economies’ success on problem-solving tasks, by nature of the problem ...81
Figure V.3.4 Relative success on problem-solving tasks, by nature of the problem ...82
Figure V.3.5 Examples of problem-solving tasks, by process ...83
Figure V.3.6 Differences in countries’/economies’ success on problem-solving tasks, by process ...85
Figure V.3.7 Relative success on problem-solving tasks, by process ...86
Figure V.3.8 Relative strengths and weaknesses in problem-solving processes ...87
Figure V.3.9 Relative success on problem-solving tasks, by response format ...89
Figure V.3.10 Joint analysis of strengths and weaknesses, by nature of the problem and by process ...90
Figure V.4.1 Performance variation unique to problem solving ...95
Figure V.4.2 Relative performance in problem solving among students in vocational and pre-vocational tracks ...96
Figure V.4.3 Relative performance in problem solving, by education track ...97
Figure V.4.4 Gender differences in problem-solving performance ...99
Figure V.4.5 Proficiency in problem solving among girls and boys ...100
Figure V.4.6 Difference between boys and girls in problem-solving, mathematics, reading and science performance ...101
Figure V.4.7 Relative performance in problem solving among girls ...102
Figure V.4.8 Girls’ strengths and weaknesses, by problem-solving process ...103
Figure V.4.9a Strength of the relationship between socio-economic status and performance in problem solving, mathematics, reading and science ...105
Figure V.4.9b Strength of the relationship between socio-economic status and performance in problem solving, between and within schools ...106
Figure V.4.10 Difference related to parents’ occupational status in problem-solving, mathematics, reading and science performance ...107
Figure V.4.11 Relative performance in problem solving among students whose parents work in semi-skilled or elementary occupations ...108
Figure V.4.12 Strengths and weaknesses in problem solving among students with at least one parent working in skilled occupations, by process ...109
Figure V.4.13 Relative performance in problem solving among immigrant students ...110
Figure V.4.14 Difference in problem-solving performance related to the use of computers at home ...112
Figure V.4.15 Difference in problem-solving performance related to the use of computers at school ...113
Figure V.4.16 Difference in problem-solving, mathematics, reading and science performance related to computer use at home ...114
Figure V.5.1 Employment growth across occupations, grouped by workers’ level of problem-solving skills ...118
Figure A.3.1 Labels used in a two-way table...145
Figure A5.1 PISA 2012 computer-based test design: Problem solving only...150
TABLES
Table V.A Snapshot of performance in problem solving ...15
Table A1.1 Student questionnaire rotation design ...133
Table A2.1 PISA target populations and samples ...136
Table A2.2 Exclusions ...138
Table A2.3 Response rates...140
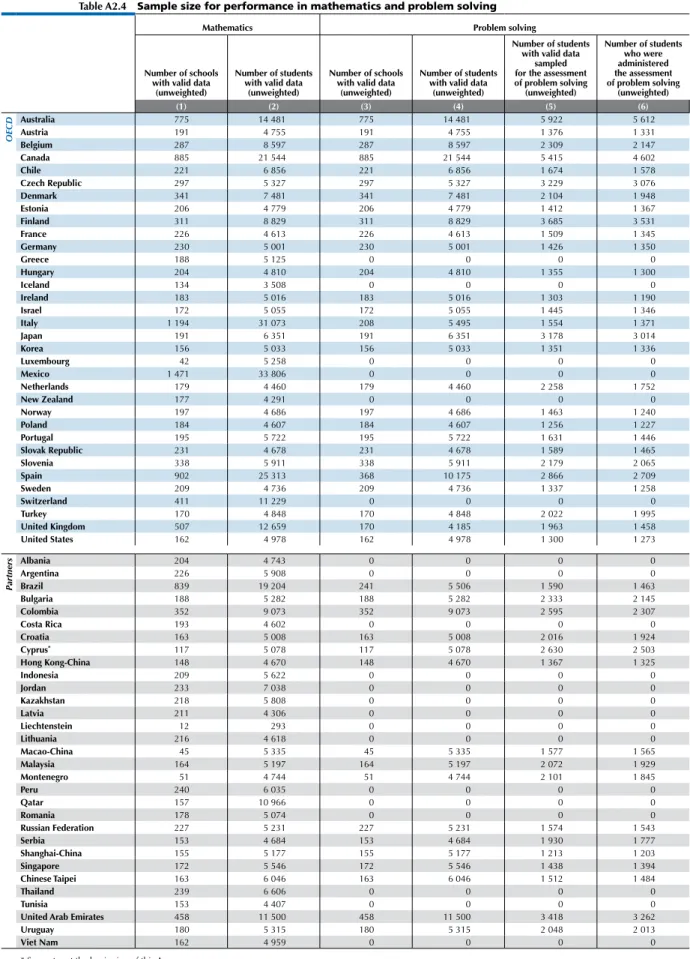
Table A2.4 Sample size for performance in mathematics and problem solving ...143
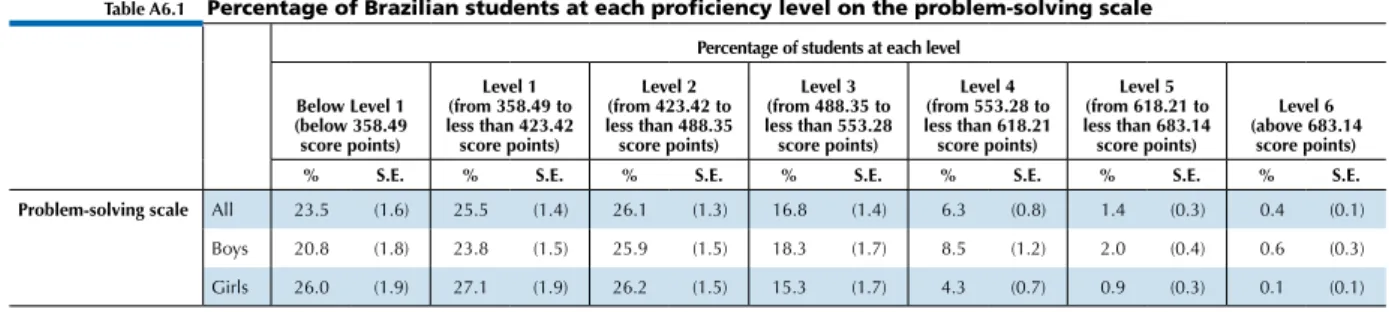
Table A6.1 Percentage of Brazilian students at each proficiency level on the problem-solving scale ...152
Table A6.2 Mean score, variation and gender differences in student performance in Brazil ...152
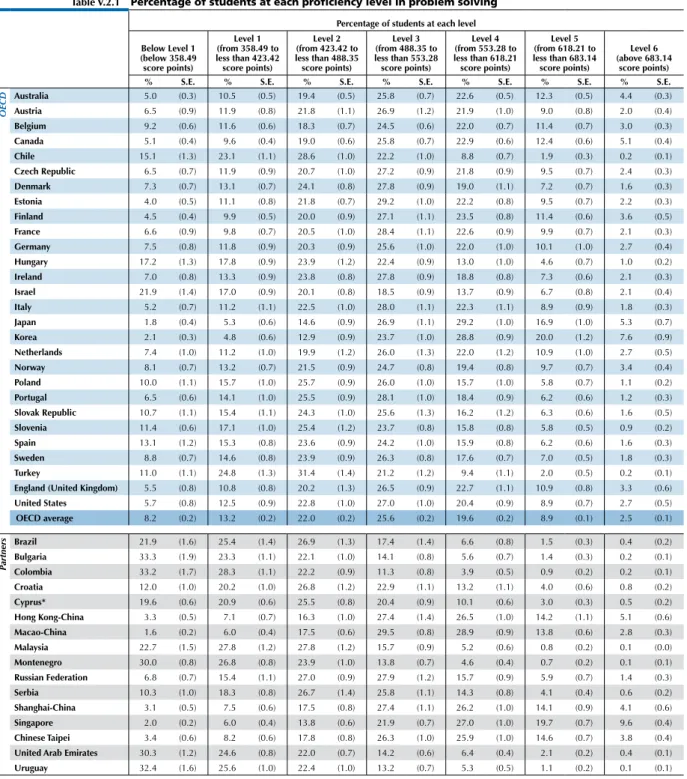
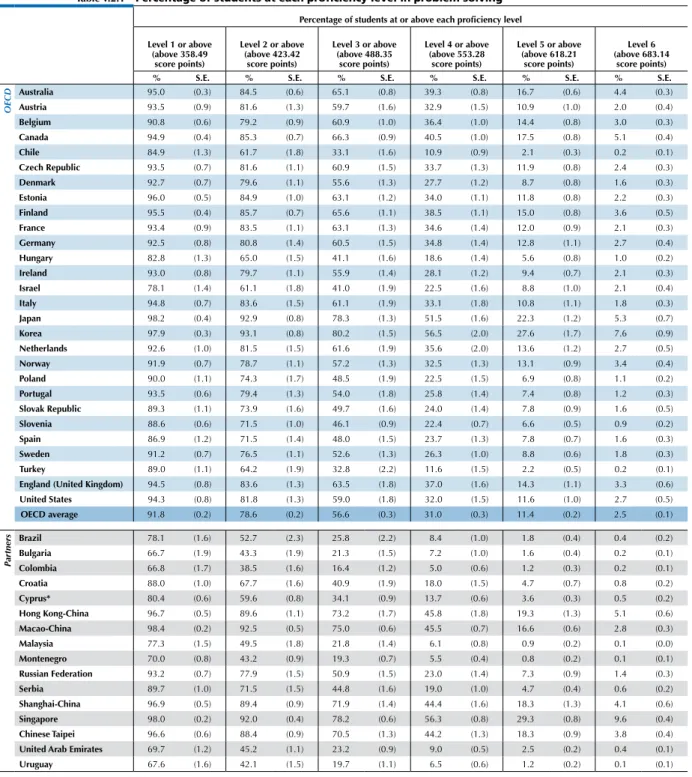
Table V.2.1 Percentage of students at each proficiency level in problem solving ...154
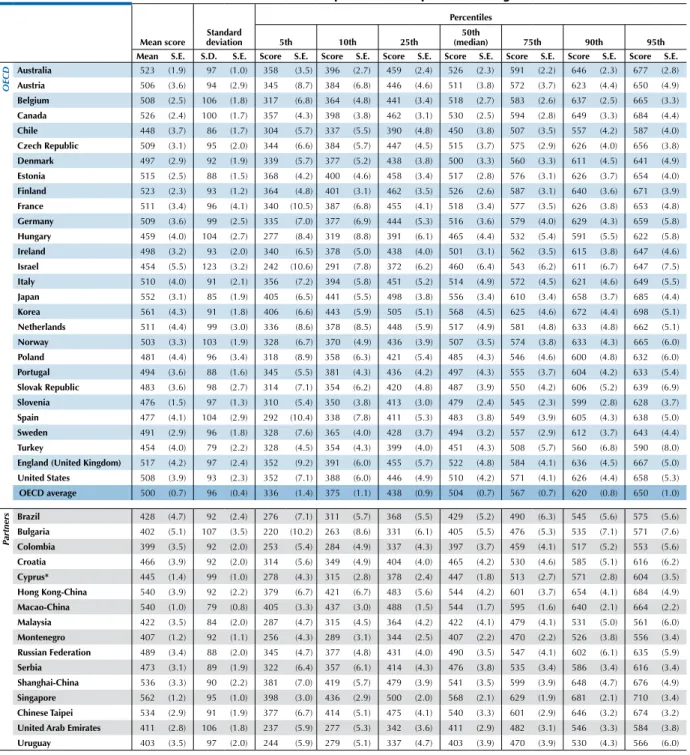
Table V.2.2 Mean score and variation in student performance in problem solving ...156
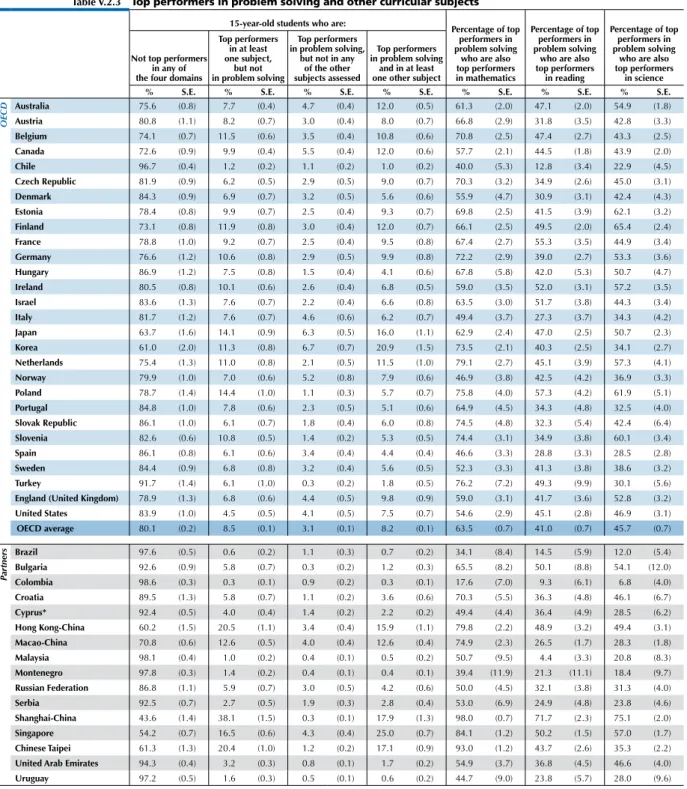
Table V.2.3 Top performers in problem solving and other curricular subjects ...158
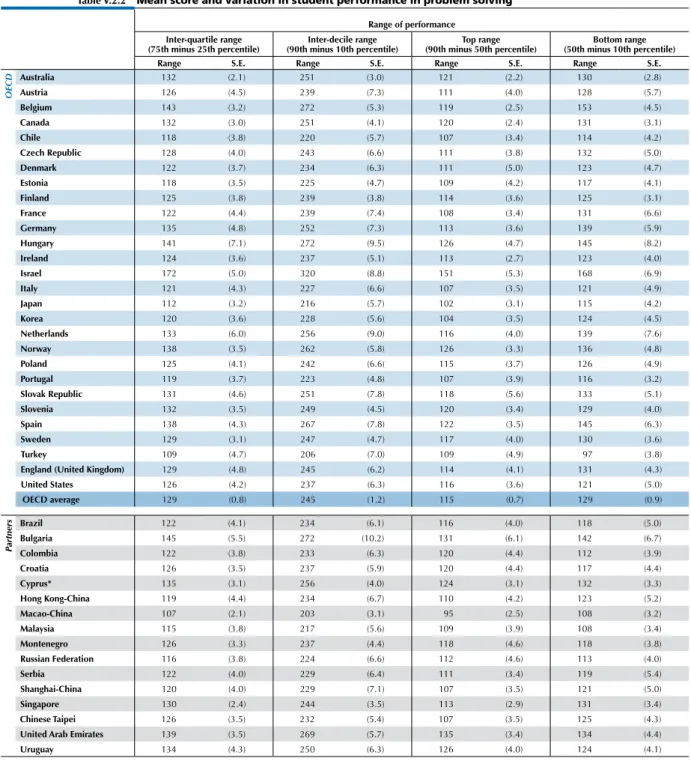
Table V.2.4 Between- and within-school variation in problem-solving performance ...159
Table V.2.5 Correlation of problem-solving performance with performance in mathematics, reading and science ...161
Table V.2.6 Relative performance in problem solving compared with performance in mathematics, reading and science ...163
Table V.3.1 Performance in problem solving, by nature of the problem situation ...166
Table V.3.2 Performance in problem solving, by process ...167
Table V.3.3 Performance in problem solving, by technology setting ...169
Table V.3.4 Performance in problem solving, by social focus ...170
Table V.3.5 Performance in problem solving, by response format ...171
Table V.3.6 Relative performance on knowledge-acquisition and knowledge-utilisation tasks...172
Table V.4.1 Strength of the relationship between problem-solving and mathematics performance, between and within schools ...173
Table V.4.2 Performance in problem solving and programme orientation ...175
Table V.4.3 Differences in problem-solving, mathematics, reading and science performance related to programme orientation ...176
Table V.4.4 Relative performance in problem solving, by programme orientation...179
Table V.4.6 Percentage of students at each proficiency level in problem solving, by gender ...180
Table V.4.7 Mean score and variation in student performance in problem solving, by gender ...182
Table V.4.8 Differences in problem-solving, mathematics, reading and science performance related to gender ...185
Table V.4.9 Relative variation in performance in problem solving, mathematics, reading and science, by gender ...188
Table V.4.10 Relative performance in problem solving, by gender ...190
Table V.4.11a Performance on problem-solving tasks, by nature of problem and by gender ...191
Table V.4.11b Performance on problem-solving tasks, by process and by gender ...192
Table V.4.12 Performance in problem solving, by socio-economic status ...194
Table V.4.13 Strength of the relationship between socio-economic status and performance in problem solving, mathematics, reading and science ...196
Table V.4.14 Strength of the relationship between socio-economic status and performance in problem solving, between and within schools ...199
Table V.4.15 Performance in problem solving and parents’ highest occupational status ...200
Table V.4.16 Differences in problem-solving, mathematics, reading and science performance related to parents’ occupational status ...201
Table V.4.17 Relative performance in problem solving, by parents’ occupational status ...204
Table V.4.18a Performance on problem-solving tasks, by nature of problem and by parents’ occupational status ...205
Table V.4.20 Differences in problem-solving, mathematics, reading and science performance related to immigrant background ...210
Table V.4.21 Relative performance in problem solving, by immigrant background ...213
Table V.4.22a Performance on problem-solving tasks, by nature of problem and by immigrant background...214
Table V.4.22b Performance on problem-solving tasks, by process and by immigrant background ...215
Table V.4.23 Association between problem-solving performance and perseverance/openness to problem solving ...217
Table V.4.24 Performance in problem solving and access to a computer at home ...218
Table V.4.25 Performance in problem solving and use of a computer at home ...219
Table V.4.26 Performance in problem solving and use of computers at school ...220
Table V.4.27 Differences in problem-solving, mathematics, reading and science performance related to computer use ...221
Table B2.V.1 Percentage of students at each proficiency level in problem solving, by region ...224
Table B2.V.2 Mean score and variation in student performance in problem solving, by region ...226
Table B2.V.3 Relative performance in problem solving compared with performance in mathematics, reading and science, by region ...228
Table B2.V.4 Percentage of students at each proficiency level in problem solving, by gender and by region...231
Table B2.V.5 Mean score and variation in student performance in problem solving, by gender and by region ...233
Table B2.V.6 Performance in problem solving, by socio-economic status and by region ...236
Table B2.V.7 Strength of the relationship between socio-economic status and performance in problem solving, mathematics, reading and science, by region ...238
Table B2.V.8 Performance in problem solving and use of a computer at home, by region ...241
Table B2.V.9 Performance in problem solving and use of computers at school, by region ...242
This book has...
StatLinks
2
A service that delivers Excel
®files
from the printed page!
Look for the StatLinks at the bottom left-hand corner of the tables or graphs in this book. To download the matching Excel® spreadsheet, just type the link into your Internet browser,starting with the http://dx.doi.org prefix.
If you’re reading the PDF e-book edition, and your PC is connected to the Internet, simply click on the link. You’ll find StatLinks appearing in more OECD books.
In modern societies, all of life is problem solving. Changes in society, the environment, and in technology mean that the content of applicable knowledge evolves rapidly. Adapting, learning, daring to try out new things and always being ready to learn from mistakes are among the keys to resilience and success in an unpredictable world.
Few workers today, whether in manual or knowledge-based occupations, use repetitive actions to perform their job tasks. What’s more, as the new Survey of Adult Skills (PIAAC) finds, one in ten workers is confronted every day with more complex problems that require at least 30 minutes to solve. Complex problem-solving skills are particularly in demand in fast-growing, highly skilled managerial, professional and technical occupations.
Are today’s 15-year-olds acquiring the problem-solving skills needed in the 21st century? This volume reports the results from the PISA 2012 assessment of problem solving, which was administered, on computer, to about 85 000 students in 44 countries and economies.
Students in Singapore and Korea, followed by students in Japan, score higher in problem solving than students in all other participating countries and economies.
Four more East Asian partner economies score between 530 and 540 points on the PISA problem-solving scale: Macao-China (with a mean score of 540 points), Hong Kong-China (540 points), Shanghai-China (536 points) and Chinese Taipei (534 points); and Canada, Australia, Finland, England (United Kingdom), Estonia, France, the Netherlands, Italy, the Czech Republic, Germany, the United States and Belgium all score above the OECD average, but below the former group of countries.
Across OECD countries, 11.4% of 15-year-old students are top performers in problem solving.
Top performers attain proficiency Level 5 or 6 in problem solving, meaning that they can systematically explore a complex problem scenario, devise multi-step solutions that take into account all constraints, and adjust their plans in light of the feedback received. In Singapore, Korea and Japan, more than one in five students achieve this level, while more than one in six students perform at Level 5 or above in Hong Kong-China (19.3%), Chinese Taipei and Shanghai-China (18.3%), Canada (17.5%) and Australia (16.7%). By contrast, in Montenegro, Malaysia, Colombia, Uruguay, Bulgaria and Brazil, fewer than 2% of students perform at Level 5 or 6; and all of these countries perform well below the OECD average. On average across OECD countries, about one in five students is able to solve only straightforward problems – if any – provided that they refer to familiar situations.
By contrast, fewer than one in ten students in Japan, Korea, Macao-China and Singapore are low-achievers in problem solving.
In Australia, Brazil, Italy, Japan, Korea, Macao-China, Serbia, England (United Kingdom) and the United States, students perform significantly better in problem solving, on average, than students in other countries who show similar performance in mathematics, reading and science.
In Australia, England (United Kingdom) and the United States, this is particularly true among strong and top performers in mathematics; in Italy, Japan and Korea, this is particularly true among moderate and low performers in mathematics.
Students in Hong Kong-China, Korea, Macao-China, Shanghai-China, Singapore and Chinese Taipei perform strongest on problems that require understanding, formulating or representing new knowledge, compared to other types of problems.
Many of the best-performing countries and economies in problem solving are those with better-than-expected performance on tasks related to acquiring knowledge, such as “exploring and understanding” and “representing and formulating” tasks, and relatively weaker performance on tasks involving only the use of knowledge, such as “planning and executing” tasks that do not require substantial understanding or representation of the problem situation. Meanwhile, students in Brazil, Ireland, Korea and the United States perform strongest on interactive problems (those that require the student to uncover some of the information needed to solve the problem) compared to static problems (those that have all information disclosed at the outset).
In Malaysia, Shanghai-China and Turkey, more than one in eight students attend a vocational study programme, and these students show significantly better performance in problem solving, on average, than students with comparable performance in mathematics, reading and science but who are in general study programmes.
This finding can be interpreted in two ways. On the one hand, the curriculum and teaching practices in these vocational programmes may equip students better for tackling complex, real-life problems in contexts that they do not usually encounter at school. On the other hand, better-than-expected performance in problem solving may be an indication that in these programmes, students’ ability to solve problems is not nurtured within the core academic subjects.
Boys outperform girls in problem solving in 23 countries/economies, girls outperform boys in five countries/ economies, and in 16 countries/economies, there is no significant difference in average performance between boys and girls.
Gender differences are often larger among top performers. On average across OECD countries, there are three top-performing boys for every two top-top-performing girls in problem solving. In Croatia, Italy and the Slovak Republic, boys are as likely as girls to be low-achievers, but are more than twice as likely to be top performers as girls. In no country or economy are there more girls than boys among the top performers in problem solving. Girls appear to be stronger in performing the “planning and executing” tasks that measure how students use knowledge, compared to other tasks; and weaker in performing the more abstract “representing and formulating” tasks, which relate to how students acquire knowledge.
The impact of socio-economic status on problem-solving performance is weaker than it is on performance in mathematics, reading or science.
Students from disadvantaged backgrounds are more likely to score higher than expected in problem solving than in mathematics, perhaps because after-school opportunities to exercise their skills in problem solving arise in diverse social and cultural contexts. Still, the quality of schools matters: unequal access to high-quality schools means that, on average, disadvantaged students score below advantaged students in all subjects assessed, including problem solving.
•
Table V.A•
SnapShot of performance in problem Solving
Countries/economies with mean score/share of top performers / relative performance /solution rate above the OECD average Countries/economies with share of low achievers below the OECD average
Countries/economies with mean score/share of top performers /relative performance /share of low achievers/solution rate not statistically different from the OECD average
Countries/economies with mean score/share of top performers /relative performance /solution rate below the OECD average Countries/economies with a share of low achievers above the OECD average
Performance in problem solving
relative performance in problem solving, compared with students around the world with similar performance in mathematics, reading and science Performance in problem solving, by process Performance in problem solving, by nature
of the problem situation
Mean score in PISA 2012 Share of low achievers (below Level 2) Share of top performers (Level 5 or 6) Gender difference (boys - girls) Solution rate on tasks measuring acquisition of knowledge Solution rate on tasks measuring utilisation of knowledge Solution rate on items referring to a static problem situation Solution rate on items referring to an interactive problem situation Mean score % % Score dif. Score dif. Percent correct Percent correct Percent correct Percent correct
oEcd average 500 21.4 11.4 7 -7 45.5 46.4 47.1 43.8 Singapore 562 8.0 29.3 9 2 62.0 55.4 59.8 57.5 Korea 561 6.9 27.6 13 14 62.8 54.5 58.9 57.7 Japan 552 7.1 22.3 19 11 59.1 56.3 58.7 55.9 Macao-China 540 7.5 16.6 10 8 58.3 51.3 57.0 51.7 Hong Kong-China 540 10.4 19.3 13 -16 57.7 51.1 56.1 52.2 Shanghai-China 536 10.6 18.3 25 -51 56.9 49.8 56.7 50.3 Chinese Taipei 534 11.6 18.3 12 -9 56.9 50.1 56.3 50.1 Canada 526 14.7 17.5 5 0 52.6 52.1 52.7 50.5 Australia 523 15.5 16.7 2 7 52.3 51.5 52.8 49.9 Finland 523 14.3 15.0 -6 -8 50.2 51.0 52.1 47.7
England (United Kingdom) 517 16.4 14.3 6 8 49.6 49.1 49.5 47.9
Estonia 515 15.1 11.8 5 -15 46.8 49.5 49.7 45.6 France 511 16.5 12.0 5 5 49.6 49.4 50.3 47.6 Netherlands 511 18.5 13.6 5 -16 48.2 49.7 50.4 46.5 Italy 510 16.4 10.8 18 10 49.5 48.0 49.5 46.8 Czech Republic 509 18.4 11.9 8 1 45.0 46.9 46.2 44.4 Germany 509 19.2 12.8 7 -12 47.5 49.5 49.4 46.3 United States 508 18.2 11.6 3 10 46.5 47.1 46.6 45.9 Belgium 508 20.8 14.4 8 -10 47.0 47.5 48.3 45.4 Austria 506 18.4 10.9 12 -5 45.7 47.4 48.3 43.0 Norway 503 21.3 13.1 -3 1 47.7 48.1 49.4 44.5 Ireland 498 20.3 9.4 5 -18 44.6 45.5 44.4 44.6 Denmark 497 20.4 8.7 10 -11 44.2 48.1 47.9 42.3 Portugal 494 20.6 7.4 16 -3 41.6 45.7 44.0 42.0 Sweden 491 23.5 8.8 -4 -1 45.2 44.6 47.7 41.6 Russian Federation 489 22.1 7.3 8 -4 40.4 43.8 43.8 39.7 Slovak Republic 483 26.1 7.8 22 -5 40.5 43.2 44.2 38.8 Poland 481 25.7 6.9 0 -44 41.3 43.7 44.1 39.7 Spain 477 28.5 7.8 2 -20 40.0 42.3 42.3 39.8 Slovenia 476 28.5 6.6 -4 -34 37.8 42.3 42.9 36.7 Serbia 473 28.5 4.7 15 11 37.7 40.7 40.3 36.8 Croatia 466 32.3 4.7 15 -22 35.2 40.5 39.3 35.6 Hungary 459 35.0 5.6 3 -34 35.2 37.6 38.2 33.9 Turkey 454 35.8 2.2 15 -14 32.8 36.0 35.8 32.7 Israel 454 38.9 8.8 6 -28 38.7 37.0 39.7 35.6 Chile 448 38.3 2.1 13 1 30.9 35.2 34.9 31.8 Cyprus* 445 40.4 3.6 -9 -12 33.6 34.8 37.0 31.4 Brazil 428 47.3 1.8 22 7 28.0 32.0 29.8 29.1 Malaysia 422 50.5 0.9 8 -14 29.1 29.3 30.1 27.4
United Arab Emirates 411 54.8 2.5 -26 -43 28.4 29.0 29.9 27.1
Montenegro 407 56.8 0.8 -6 -24 25.6 30.0 30.3 25.1
Uruguay 403 57.9 1.2 11 -27 24.8 27.9 27.5 24.8
Bulgaria 402 56.7 1.6 -17 -54 23.7 26.7 28.4 22.3
Colombia 399 61.5 1.2 31 -7 21.8 27.7 26.3 23.7
Note: Countries/economies in which the performance difference between boys and girls is statistically significant are marked in bold. Countries and economies are ranked in descending order of the mean score in problem solving in PISA 2012.
* See notes in the Reader’s Guide.
Data underlying the figures
The data referred to in this volume are presented in Annex B and, in greater detail, including some additional tables, on the PISA website (www.pisa.oecd.org).
Four symbols are used to denote missing data:
a The category does not apply in the country concerned. Data are therefore missing.
c There are too few observations or no observation to provide reliable estimates (i.e. there are fewer than 30 students or fewer than 5 schools with valid data).
m Data are not available. These data were not submitted by the country or were collected but subsequently removed from the publication for technical reasons.
w Data have been withdrawn or have not been collected at the request of the country concerned. Country coverage
The PISA publications (PISA 2012 Results) feature data on 65 countries and economies, including all 34 OECD countries and 31 partner countries and economies (see map in the section What is PISA?).
This volume in particular contains data on 44 countries and economies that participated in the assessment of problem solving, including 28 OECD countries and 16 partner countries and economies.
The statistical data for Israel are supplied by and under the responsibility of the relevant Israeli authorities. The use of such data by the OECD is without prejudice to the status of the Golan Heights, East Jerusalem and Israeli settlements in the West Bank under the terms of international law.
Two notes were added to the statistical data related to Cyprus:
1. Note by Turkey: The information in this document with reference to “Cyprus” relates to the southern part of the Island. There is no single authority representing both Turkish and Greek Cypriot people on the Island. Turkey recognises the Turkish Republic of Northern Cyprus (TRNC). Until a lasting and equitable solution is found within the context of the United Nations, Turkey shall preserve its position concerning the “Cyprus issue”.
2. Note by all the European Union Member States of the OECD and the European Union: The Republic of Cyprus is recognised by all members of the United Nations with the exception of Turkey. The information in this document relates to the area under the effective control of the Government of the Republic of Cyprus.
Calculating international averages
An OECD average corresponding to the arithmetic mean of the respective country estimates was calculated for most indicators presented in this report. The OECD average is used to compare performance across school systems. In the case of some countries, data may not be available for specific indicators, or specific categories may not apply. Readers should, therefore, keep in mind that the term “OECD average” refers to the OECD countries included in the respective comparisons.
Rounding figures
Because of rounding, some figures in tables may not exactly add up to the totals. Totals, differences and averages are always calculated on the basis of exact numbers and are rounded only after calculation.
All standard errors in this publication have been rounded to one or two decimal places. Where the value 0.0 or 0.00 is shown, this does not imply that the standard error is zero, but that it is smaller than 0.05 or 0.005, respectively.
Reporting student data
The report uses “15-year-olds” as shorthand for the PISA target population. PISA covers students who are aged between 15 years 3 months and 16 years 2 months at the time of assessment and who are enrolled in school and have completed at least 6 years of formal schooling, regardless of the type of institution in which they are enrolled and of whether they are in full-time or part-time education, of whether they attend academic or vocational programmes, and of whether they attend public or private schools or foreign schools within the country. Focusing on statistically significant differences
This volume discusses only statistically significant differences or changes. These are denoted in darker colours in figures and in bold font in tables. See Annex A3 for further information.
Categorising student performance
This report uses a shorthand to describe students’ levels of proficiency in the subjects assessed by PISA: top performers are those students proficient at Level 5 or 6 of the assessment.
Strong performers are those students proficient at Level 4 of the assessment. moderate performers are those students proficient at Level 2 or 3 of the assessment. lowest performers are those students proficient at or below Level 1 of the assessment. Abbreviations used in this report
ESCS PISA index of economic, social and cultural status PPP Purchasing power parity
GDP Gross domestic product S.D. Standard deviation
ISCED International Standard Classification of Education S.E. Standard error ISCO International Standard Classification
of Occupations
STEM Science, Technology, Engineering and Mathematics
Further documentation
For further information on the PISA assessment instruments and the methods used in PISA, see the PISA 2012
Technical Report (OECD, forthcoming). The reader should note that there are gaps in the numbering of
tables because some tables appear on line only and are not included in this publication. To consult the set of web-only data tables, visit the PISA website (www.pisa.oecd.org).
This report uses the OECD StatLinks service. Below each table and chart is a url leading to a corresponding ExcelTM workbook containing the underlying data. These urls are stable and will remain unchanged over time.
In addition, readers of the e-books will be able to click directly on these links and the workbook will open in a separate window, if their internet browser is open and running.
“What is important for citizens to know and be able to do?” That is the question that underlies the triennial survey of 15-year-old students around the world known as the Programme for International Student Assessment (PISA). PISA assesses the extent to which students near the end of compulsory education have acquired key knowledge and skills that are essential for full participation in modern societies. The assessment, which focuses on mathematics, reading, science and problem solving, does not just ascertain whether students can reproduce knowledge; it also examines how well students can extrapolate from what they have learned and apply that knowledge in unfamiliar settings, both in and outside of school. This approach reflects the fact that modern economies reward individuals not for what they know, but for what they can do with what they know.
PISA is an ongoing programme that offers insights for education policy and practice, and that helps monitor trends in students’ acquisition of knowledge and skills across countries and economies and in different demographic subgroups within each country. PISA results reveal what is possible in education by showing what students in the highest-performing and most rapidly improving school systems can do. The findings allow policy makers around the world to gauge the knowledge and skills of students in their own countries in comparison with those in other countries, set policy targets against measurable goals achieved by other school systems, and learn from policies and practices applied elsewhere. While PISA cannot identify cause-and-effect relationships between policies/practices and student outcomes, it can show educators, policy makers and the interested public how education systems are similar and different – and what that means for students.
a test the whole world can take
PISA is now used as an assessment tool in many regions around the world. It was implemented in 43 countries and economies in the first assessment (32 in 2000 and 11 in 2002), 41 in the second assessment (2003), 57 in the third assessment (2006) and 75 in the fourth assessment (65 in 2009 and 10 in 2010). So far, 65 countries and economies have participated in PISA 2012.
In addition to OECD member countries, the survey has been or is being conducted in:
East, South and Southeast Asia: Himachal Pradesh-India, Hong Kong-China, Indonesia, Macao-China, Malaysia, Shanghai-China, Singapore, Chinese Taipei, Tamil Nadu-India, Thailand and Viet Nam.
Central, Mediterranean and Eastern Europe, and Central Asia: Albania, Azerbaijan, Bulgaria, Croatia, Georgia, Kazakhstan, Kyrgyzstan, Latvia, Liechtenstein, Lithuania, the former Yugoslav Republic of Macedonia, Malta, Moldova, Montenegro, Romania, the Russian Federation and Serbia.
The Middle East:Jordan, Qatar and the United Arab Emirates.
Central and South America:Argentina, Brazil, Colombia, Costa Rica, Netherlands-Antilles, Panama, Peru, Trinidad and Tobago, Uruguay and Miranda-Venezuela.
Africa: Mauritius and Tunisia.
Decisions about the scope and nature of the PISA assessments and the background information to be collected are made by participating countries based on recommendations from leading experts. Considerable efforts and resources are devoted to achieving cultural and linguistic breadth and balance in assessment materials. Since the design and translation of the test, as well as sampling and data collection, are subject to strict quality controls, PISA
map of piSa countries and economies
oEcd countries Partner countries and economies in PiSa 2012 Partner countries and economies in previous cycles
Australia Japan Albania Montenegro Azerbaijan
Austria Korea Argentina Peru Georgia
Belgium Luxembourg Brazil Qatar Himachal Pradesh-India
Canada Mexico Bulgaria Romania Kyrgyzstan
Chile Netherlands Colombia Russian Federation Former Yugoslav Republic of Macedonia
Czech Republic New Zealand Costa Rica Serbia Malta
Denmark Norway Croatia Shanghai-China Mauritius
Estonia Poland Cyprus1, 2 Singapore Miranda-Venezuela
Finland Portugal Hong Kong-China Chinese Taipei Moldova
France Slovak Republic Indonesia Thailand Panama
Germany Slovenia Jordan Tunisia Tamil Nadu-India
Greece Spain Kazakhstan United Arab Emirates Trinidad and Tobago
Hungary Sweden Latvia Uruguay
Iceland Switzerland Liechtenstein Viet Nam
Ireland Turkey Lithuania
Israel United Kingdom Macao-China
Italy United States Malaysia
1. Note by Turkey: The information in this document with reference to “Cyprus” relates to the southern part of the Island. There is no single authority representing both Turkish and Greek Cypriot people on the Island. Turkey recognises the Turkish Republic of Northern Cyprus (TRNC). Until a lasting and equitable solution is found within the context of the United Nations, Turkey shall preserve its position concerning the “Cyprus issue”.
2. Note by all the European Union Member States of the OECD and the European Union: The Republic of Cyprus is recognised by all members of the United Nations with the exception of Turkey. The information in this document relates to the area under the effective control of the Government of the Republic of Cyprus.
PISA’s unique features include its:
• policy orientation, which links data on student learning outcomes with data on students’ backgrounds and attitudes towards learning and on key factors that shape their learning, in and outside of school, in order to highlight differences in performance and identify the characteristics of students, schools and school systems that perform well;
• innovative concept of “literacy”, which refers to students’ capacity to apply knowledge and skills in key subjects, and to analyse, reason and communicate effectively as they identify, interpret and solve problems in a variety of situations; • relevance to lifelong learning, as PISA asks students to report on their motivation to learn, their beliefs about themselves,
and their learning strategies;
• regularity, which enables countries and economies to monitor their progress in meeting key learning objectives; and • breadth of coverage, which, in PISA 2012, encompasses the 34 OECD member countries and 31 partner countries
Who are the piSa StudentS?
Differences between countries in the nature and extent of pre-primary education and care, in the age of entry into formal schooling, in the structure of the school system, and in the prevalence of grade repetition mean that school grade levels are often not good indicators of where students are in their cognitive development. To better compare student performance internationally, PISA targets a specific age of students. PISA students are aged between 15 years 3 months and 16 years 2 months at the time of the assessment, and have completed at least 6 years of formal schooling. They can be enrolled in any type of institution, participate in full-time or part-time education, in academic or vocational programmes, and attend public or private schools or foreign schools within the country or economy. (For an operational definition of this target population, see Annex A2.) Using this age across countries and over time allows PISA to compare consistently the knowledge and skills of individuals born in the same year who are still in school at age 15, despite the diversity of their education histories in and outside of school.
The population of participating students is defined by strict technical standards, as are the students who are excluded from participating (see Annex A2). The overall exclusion rate within a country was required to be below 5% to ensure that, under reasonable assumptions, any distortions in national mean scores would remain within plus or minus 5 score points, i.e. typically within the order of magnitude of 2 standard errors of sampling. Exclusion could take place either through the schools that participated or the students who participated within schools (see Annex A2, Tables A2.1 and A2.2).
There are several reasons why a school or a student could be excluded from PISA. Schools might be excluded because they are situated in remote regions and are inaccessible, because they are very small, or because of organisational or operational factors that precluded participation. Students might be excluded because of intellectual disability or limited proficiency in the language of the assessment.
Key features of piSa 2012
The content
• The PISA 2012 survey focused on mathematics, with reading, science and problem solving as minor areas of assessment. For the first time, PISA 2012 also included an assessment of the financial literacy of young people, which was optional for countries and economies.
• PISA assesses not only whether students can reproduce knowledge, but also whether they can extrapolate from what they have learned and apply their knowledge in new situations. It emphasises the mastery of processes, the understanding of concepts, and the ability to function in various types of situations.
The students
• Around 510 000 students completed the assessment in 2012, representing about 28 million 15-year-olds in the schools of the 65 participating countries and economies.
The assessment
• Paper-based tests were used, with assessments lasting a total of two hours for each student. In a range of countries and economies, an additional 40 minutes were devoted to the computer-based assessment of mathematics, reading and problem solving.
• Test items were a mixture of multiple-choice items and questions requiring students to construct their own responses. The items were organised in groups based on a passage setting out a real-life situation. A total of about 390 minutes of test items were covered, with different students taking different combinations of test items. • Students answered a background questionnaire, which took 30 minutes to complete, that sought information
about themselves, their homes and their school and learning experiences. School principals were given a questionnaire, to complete in 30 minutes, that covered the school system and the learning environment. In some countries and economies, optional questionnaires were distributed to parents, who were asked to provide information on their perceptions of and involvement in their child’s school, their support for learning in the home, and their child’s career expectations, particularly in mathematics. Countries and economies could choose two other optional questionnaires for students: one asked students about their familiarity with and use of information and communication technologies, and the second sought information about their education to date, including any interruptions in their schooling and whether and how they are preparing for a future career.
In 28 out of the 65 countries and economies participating in PISA 2012, the percentage of school-level exclusions amounted to less than 1%; it was less than 4% in all countries and economies. When the exclusion of students who met the internationally established exclusion criteria is also taken into account, the exclusion rates increase slightly. However, the overall exclusion rate remains below 2% in 30 participating countries and economies, below 5% in 57 participating countries and economies, and below 7% in all countries except Luxembourg (8.4%). In 11 out of the 34 OECD countries, the percentage of school-level exclusions amounted to less than 1% and was less than 3% in 31 OECD countries. When student exclusions within schools were also taken into account, there were 11 OECD countries below 2% and 26 OECD countries below 5%.
(For more detailed information about the restrictions on the level of exclusions in PISA 2012, see Annex A2.)
What KindS of reSultS doeS the teSt provide?
The PISA assessment provides three main types of outcomes:
• basic indicators that provide a baseline profile of students’ knowledge and skills;
• indicators that show how skills relate to important demographic, social, economic and educational variables; and • indicators on trends that show changes in student performance and in the relationships between student-level and
school-level variables and outcomes.
Although indicators can highlight important issues, they do not provide direct answers to policy questions. To respond to this, PISA also developed a policy-oriented analysis plan that uses the indicators as a basis for policy discussion.
Where can you find the reSultS?
This is the fifth of six volumes that presents the results from PISA 2012. It begins by providing the rationale for assessing problem-solving competence in PISA, and introduces the innovative features of the 2012 assessment. Chapter 2 introduces the problem-solving performance scale and proficiency levels, examines student performance in problem solving, and discusses the relationship between problem-solving performance and performance in mathematics, reading and science. Chapter 3 provides a nuanced look at student performance in problem solving by focusing on students’ strengths and weaknesses in performing certain types of tasks. Chapter 4 looks at differences in problem-solving performance related to education tracks and to students’ gender, socio-economic status and immigrant background. It also examines students’ behaviours and attitudes related to problem solving, and students’ familiarity with information and communication technology. The volume concludes with a chapter that discusses the implications of the PISA problem-solving assessment for education policy and practice.
The other five volumes cover the following issues:
Volume I, What Students Know and Can Do: Student Performance in Mathematics, Reading and Science, summarises the performance of students in PISA 2012. It describes how performance is defined, measured and reported, and then provides results from the assessment, showing what students are able to do in mathematics. After a summary of mathematics performance, it examines the ways in which this performance varies on subscales representing different aspects of mathematics literacy. Given that any comparison of the outcomes of education systems needs to take into consideration countries’ social and economic circumstances, and the resources they devote to education, the volume also presents the results within countries’ economic and social contexts. In addition, the volume examines the relationship between the frequency and intensity of students’ exposure to subject content in school, what is known as “opportunity to learn”, and student performance. The volume concludes with a description of student results in reading and science. Trends in student performance in mathematics between 2003 and 2012, in reading between 2000 and 2012, and in science between 2006 and 2012 are examined when comparable data are available. Throughout the volume, case studies examine in greater detail the policy reforms adopted by countries that have improved in PISA.
Volume II, Excellence through Equity: Giving Every Student the Chance to Succeed, defines and measures equity in education and analyses how equity in education has evolved across countries and economies between PISA 2003 and PISA 2012. The volume examines the relationship between student performance and socio-economic status, and describes how other individual student characteristics, such as immigrant background and family structure, and school characteristics, such as school location, are associated with socio-economic status and performance. The volume also reveals differences in how equitably countries allocate resources and opportunities to learn to schools with different
socio-economic profiles. Case studies, examining the policy reforms adopted by countries that have improved in PISA, are highlighted throughout the volume.
Volume III, Ready to Learn: Students’ Engagement, Drive and Self-Beliefs, explores students’ engagement with and at school, their drive and motivation to succeed, and the beliefs they hold about themselves as mathematics learners. The volume identifies the students who are at particular risk of having low levels of engagement in, and holding negative dispositions towards, school in general and mathematics in particular, and how engagement, drive, motivation and self-beliefs are related to mathematics performance. The volume identifies the roles schools can play in shaping the well-being of students and the role parents can play in promoting their children’s engagement with and dispositions towards learning. Changes in students’ engagement, drive, motivation and self-beliefs between 2003 and 2012, and how those dispositions have changed during the period among particular subgroups of students, notably socio-economically advantaged and disadvantaged students, boys and girls, and students at different levels of mathematics proficiency, are examined when comparable data are available. Throughout the volume, case studies examine in greater detail the policy reforms adopted by countries that have improved in PISA.
Volume IV, What Makes Schools Successful? Resources, Policies and Practices, examines how student performance is associated with various characteristics of individual schools and of concerned school systems. It discusses how 15-year- old students are selected and grouped into different schools, programmes, and education levels, and how human, financial, educational and time resources are allocated to different schools. The volume also examines how school systems balance autonomy with collaboration, and how the learning environment in school shapes student performance. Trends in these variables between 2003 and 2012 are examined when comparable data are available, and case studies, examining the policy reforms adopted by countries that have improved in PISA, are presented throughout the volume.
Volume VI, Students and Money: Financial Literacy Skills for the 21st Century, examines 15-year-old students’ performance in financial literacy in the 18 countries and economies that participated in this optional assessment. It also discusses the relationship of financial literacy to students’ and their families’ background and to students’ mathematics and reading skills. The volume also explores students’ access to money and their experience with financial matters. In addition, it provides an overview of the current status of financial education in schools and highlights relevant case studies.
The frameworks for assessing mathematics, reading and science in 2012 are described in PISA 2012 Assessment and
Analytical Framework: Mathematics, Reading, Science, Problem Solving and Financial Literacy (OECD, 2013). They are
also summarised in this volume.
Technical annexes at the end of this report describe how questionnaire indices were constructed and discuss sampling issues, quality-assurance procedures, the reliability of coding, and the process followed for developing the assessment instruments. Many of the issues covered in the technical annexes are elaborated in greater detail in the PISA 2012
Technical Report (OECD, forthcoming).
All data tables referred to in the analysis are included at the end of the respective volume in Annex B1, and a set of additional data tables is available on line (www.pisa.oecd.org). A Reader’s Guide is also provided in each volume to aid in interpreting the tables and figures that accompany the report. Data from regions within the participating countries are included in Annex B2.
References
OECD (forthcoming), PISA 2012 Technical Report,PISA, OECD Publishing.
OECD (2013), PISA 2012 Assessment and Analytical Framework: Mathematics, Reading, Science, Problem Solving and Financial Literacy, PISA, OECD Publishing.
Assessing Problem-Solving Skills
in PISA 2012
This chapter introduces the PISA 2012 assessment of problem solving. It provides the rationale for assessing problem-solving competence in PISA, and introduces the innovative features of the 2012 assessment. The framework for the assessment is presented, and sample items are discussed.
Non vitae, sed scholae discimus
[Too often,] we don’t learn for life, but only for the lecture room Seneca, Ad Lucilium, c. 65 AD In Daniel Defoe’s novel, Robinson Crusoe is stranded on a desert island. He first needs to secure food for himself. To solve this problem, he re-invents agriculture and tames a flock of wild goats. Then, he returns to his true longing: “My desire to venture over for the main[land] increased, rather than decreased, as the means for it seemed impossible. This at length put me upon thinking whether it was not possible to make myself a canoe […], even without tools, […] of the trunk of a great tree. This I not only thought possible, but easy” (Defoe, 1919).
Problems are situations with no obvious solution, and solving problems requires thinking and learning in action. Problem solving “involves initiating, usually on the basis of hunches or feelings, experimental interactions with the environment to clarify the nature of a problem and potential solutions”, so that the problem-solver “can learn more […] about the nature of the problem and the effectiveness of their strategies”, “modify their behaviour and launch a further round of experimental interactions with the environment” (Raven, 2000, p. 54). (Robinson Crusoe’s first strategy to escape from his island in a canoe fails, for, as he explains, “my thoughts were so intent upon my voyage over the sea in [the canoe], that I never once considered how I should get it off the land”.)
Just like Robinson Crusoe, we solve small problems every day: “My mobile phone has stopped working; how do I tell my friends that I’m running late for our appointment?”; “This meeting room is so cold; are these the switches to control the air conditioning?”; “I don’t speak the local language, and my connecting flight leaves from a different airport in the same city. I just hope I can get there in time.”
In modern societies, all of life is problem solving. Changes in society, the environment and in technology mean that the content of applicable knowledge evolves rapidly. Today’s 15-year-olds are the Robinson Crusoes of a future that remains largely unknown to us. Adapting, learning, daring to try out new things, and always being ready to learn from mistakes are among the keys to resilience and success in an unpredictable world.
This chapter begins with a discussion of the rationale for including a separate assessment of problem solving in PISA. It then introduces what is new and distinctive about the PISA 2012 approach to assessing problem solving, and describes the main dimensions covered in the problem-solving framework. The chapter concludes by presenting the test interface and sample items from the PISA computer-based assessment of problem solving.
Why piSa aSSeSSeS problem-Solving competence
Today’s workplaces demand people who can solve non-routine problems. Few workers, whether in manual or knowledge-based occupations, use repetitive actions to perform their job tasks. The Survey of Adult Skills (PIAAC), for instance, measured how often workers are faced with a new or difficult situation in their jobs that requires some thinking before taking action (OECD, 2013a). On average across countries, a large majority of workers are confronted at least once per week in their job with simple problems (those requiring less than 30 minutes to find a solution). Meanwhile, one in ten workers is confronted every day with more complex problems that require at least 30 minutes to find a good solution. Complex problem-solving skills are particularly in demand in fast-growing, highly skilled managerial, professional and technical occupations.
One possible explanation for this shift to non-routine tasks in the workplace is that, as computers and computerised machines were introduced in greater numbers, workers were needed less often to perform routine manual or analytical tasks. Instead, they were required to deal with the unexpected and the unfamiliar, and to bring the best out of the machines and computers working alongside them (Autor, Levy and Murnane, 2003). There is clear evidence of this change in the demand for skills in Germany, Japan and the United States (Box V.1.1 and Figure V.1.1).
Acknowledging these changes, the emphasis in education is shifting too, from equipping students with highly codified, routine skills to empowering them to confront and overcome complex, non-routine cognitive challenges. Indeed, the skills that are easiest to teach and test are also the skills that are easiest to digitise, automate and outsource. For students to be prepared for tomorrow’s world, they need more than mastery of a repertoire of facts and procedures; students need to become lifelong learners who can handle unfamiliar situations where the effect of their interventions is not predictable. When asked to solve problems for which they have no ready-made strategy, they need to be able to think flexibly and creatively about how to overcome the barriers that stand in the way of a solution.