Choosing Performance:
An Analysis of School
Location and Performance
in Milwaukee
Choosing Performance: An Analysis of School Location and Performance in Milwaukee
Acknowledgements
IFF would like to thank the following individuals for their assistance with this project:
Milwaukee Public Schools Office of the Superintendent William Andrekopolous
Superintendent
Michelle J. Nate
Chief, Finance and Operations
Office of Board Governance Lynne A. Sobczak
Director/Board Clerk
Division of Research and Assessment Deborah Lindsey, Ph.D. Director Cindy Raven, Ph.D. Research Specialist Division of Diversified Community Schools Kristi Y. Cole Acting Director
Facilities and Maintenance Services
Gina Spang
Director
Student Services Ron Ranieri
Coordinator of Student Database
Jodi Goldberg
Director
GreatSchools Milwaukee Robert J. Kattman, Ph.D.
Director
Office of Charter Schools
University of Wisconsin-Milwaukee Cindy Zautcke
Institute for the Transformation of Learning
Marquette University
IFF would also like to thank the following individuals for sharing their reactions and insights during the development of the study and writing of the report:
Corey Nettles
Generation Growth Capital Education Committee Staff Greater Milwaukee Committee Vincent Lyles
President
M&I Community Development Corporation
M&I Bank
Howard L. Fuller, Ph.D. Institute for the Transformation of Learning
Marquette University Alan J. Borsuk
Marquette University Law School Timothy R. Sheehy
Metropolitan Milwaukee Association of Commerce
Bruce Thompson
Milwaukee Board of School Directors Alderman Willie L. Hines, Jr. Milwaukee Common Council Dan McKinley
PAVE Rob Henken Public Policy Forum Patrick J. Wolf, Ph.D. University of Arkansas
College of Education and School Professions School Choice Demonstration Project Ricardo Diaz
United Community Center Abigail Schumwinger Walton Family Foundation
Funding for this needs assessment was provided by the Lynde and Harry Bradley Foundation.
IFF Project Staff Kaitlyn Bohlin
Administrative Assistant
Susan B. Cahn
Director of Research
Jose Cerda, III
Vice President of Public Policy and Communications
Trinita Logue
President and CEO
Daniel Muschler
Administrative Assistant
Joe Neri
Executive Vice President
Moira O’Donovan
Research Project Manager
IFF Milwaukee Staff 215 N. Water Street Suite 225
Milwaukee, WI 53202 Heather Heaviland
Milwaukee Community Initiatives Director
Lanie Wasserman
Wisconsin Director
Design: Sam Silvio IFF
Choosing Performance:
An Analysis of School
Location and Performance
in Milwaukee
2
Table of Contents
4 Introduction and Purpose
6 Overview of Demographics, School Types, and Enrollment 10 Definition of Terms
11 Methodology 15 Research Results 18 Citywide Results
20 Zip Code Analysis Results 30 Key Findings
31 Observations, Comments, and Conclusion 33 Action Steps
3
Page Tables
9 Table 1: Enrollment and Capacity of Public Schools in Milwaukee by School Type 12 Table 2: Tier I and Tier II Criteria
14 Table 3: Weights for Calculating Current, Potential, and Regional Indicators 14 Table 4: Indicator Weights for Final Ranking of Zip Codes
15 Table 5: Zip Code Analysis: Tier I and Tier II Capacity by School Type
26 Table 6: Service Level, Service Gap, and Ranking of Top Eight Zip Code Areas 28 Table 7: Space Utilization in Tier I and Tier II Schools
Figures
7 Figure 1: Percent of School-Age Children in Public and Charter Schools
7 Figure 2: Public and Charter School Enrollment by Number of Students, Percent of Total Enrollment, and School Type
17 Figure 3: MPCP Voucher Student Enrollment
19 Figure 4: Citywide Tier I Seats by School Type and Service Gap Compared to Current and Potential Enrollment
28 Figure 5: Student Attendance Patterns in Tier I and Tier II Schools
Maps
13 Map 1: Milwaukee Study Geography 16 Map 2: Tier I and Tier II Schools
21 Map 3: Public and Charter Elementary School Tier I and Tier II Capacity by Zip Code Area
23 Map 4: Elementary School Service Level and Service Gap by Zip Code Based on Public and Charter Tier I and Tier II Seats
25 Map 5: High School Service Gap by Zip Code Based on Public and Charter Tier I and Tier II Seats 27 Map 6: K–12 Service Level and Service Gap by Zip Code Based on Public, Charter, and MPCP
Tier I and Tier II Seats
29 Map 7: Tier I and Tier II Schools and Top Eight Zip Code Areas
List of Tables, Figures and Maps
4
Choosing Performance: An Analysis of School Location
and Performance in Milwaukee
reflects the methodology
of a needs assessment in which demand and supply are
compared. The study was conducted by IFF, a nonprofit
community development financial institution that provides
financing, real estate services, and applied demographic
research in low-income communities in Illinois, Indiana,
Iowa, Missouri, and Wisconsin.
IFF has been studying the distribution of performing
schools in urban school districts since 2003. Originally
developed to identify which community areas in Chicago
should be a priority when locating new schools, IFF’s
methodology and analysis has since been applied on a
broader scope to inform the education reform efforts in
St. Louis, Denver, and Kansas City.
5
The primary objective of this study is to identify those areas in Milwaukee with the greatest number of school-age children but the fewest number of schools that meet state standards for academic performance. IFF analyzes enrollment figures as compared to seats in schools that meet performance criteria, thereby determining geographic areas of focus for planning the allocation of resources.
The premise of this report is that all elementary and high school students should have the option of attending a performing school near where they reside. This underlying assumption emerged as awareness increased about the resources of school districts that are dedicated to providing choices that require student travel, but do not improve educational outcomes. Thousands of students commute to schools outside their communities—in some cases long distances— but do not receive a better education.
This study differs significantly from existing research on the academic performance of students. It examines and ranks the overall performance of schools, where they are located, and where school-age children reside.
The results are presented on maps using zip codes as the geographic area of analysis. Also included are detailed profiles of the city and eight zip codes which the report identifies as high-need.
Despite the broad choices available to families among a combined 353 traditional public, charter, and private schools, this report finds that
Milwaukee students do not even have a 50-50 chance of enrolling in a school in any location that meets state standards.
By pinpointing where low-performing schools and high densities of school-age children are concentrated, this study makes the case for where further reforms and resources will have the greatest value. Using this specific community-level information, commitments to a shared sense of purpose and objective accountability may have found new underpinnings.
How To Read This Report
The first two sections of this report contain important background information necessary to understand the results. This background includes the following:
● Overview of Demographics, School Types, and Enrollment
–School-Age Children
–Public Schools In Milwaukee
–Private Schools in the Milwaukee Parental Choice Program
● Methodology ● Glossary of Terms
The results of the research then begin on Page 15.
The report concludes with Key Findings, IFF’s comments captured as Observations, Comments, and Conclusions, and finally, Action Steps that are suggested by the knowledge gained through the completion of this study. The citywide and zip code profiles can be found in Appendix A.
6
School-Age Children
Milwaukee’s Potential Enrollment, or the number of children between the ages of 4 and 17, is 125,245. This equals 21.4 percent of the city’s total population of 583,000.1Approximately 90,000 of these children are elementary school age, or between 4 and 13, while the remaining 35,000 are high school age, between 14 and 17.
During the 2008-2009 school year, a total of 227 public and charter schools in Milwaukee enrolled 88,663 students in grades K4 through 12. Nearly all of these students, 87,814, reside in Milwaukee, with another 849 students traveling from surrounding suburban communities. The few students who reside outside Milwaukee are not included in IFF’s analysis. Approximately 6,900 Milwaukee residents left the city to attend suburban public school districts. (See Appendix C)
More than two-thirds of school-age children in Milwaukee attend a public or charter school. However, as Figure 1 shows, children of high school age are slightly more likely to attend a public or charter school, 72.3 percent, as compared to elementary school age children, 69.2 percent.
Students in Milwaukee attend the following types of schools:
● MPS traditional public schools, neighborhood and citywide
● MPS charter schools, instrumentality and non-instrumentality
● selective MPS schools or those with admissions requirements
● other MPS schools:
—Early childhood care centers —Partnership schools
● independent charter schools, authorized by the University of Wisconsin-Milwaukee (UWM) or the City of Milwaukee’s Common Council (the City)
● private schools, many of which participate in MPCP
Figure 2 and Table 1 report enrollment by school type in public and charter schools in Milwaukee, not including students in private schools.
Overview of Demographics, School Types,
and Enrollment
Milwaukee Public, Charter, and MPCP School Enrollment & Population Figures
Milwaukee School-Age Population: 125,245
2008-2009 Milwaukee Public and Charter School Enrollment: 88,663 Milwaukee Residents in Public and Charter Schools: 87,814
Non-resident Public and Charter School Students: 849
Milwaukee Residents Attending Suburban Public Schools: 6,910 Total Enrollment in Private Schools Participating in MPCP: 27,510 Voucher Students in Private Schools Participating in MPCP: 19,947
7
Figure 1
Percent of School-Age Children in Public and Charter Schools
80%
70%
60%
50% All Students Elementary High School
70.1%
69.2%
72.3%
Figure 2
Public and Charter School Enrollment by Number of Students, Percent of Total Enrollment, and School Type
■Traditional ■MPS Instrumentality Charter ■MPS Non-Instrumentality Charter ■Non-MPS Charter ■MPS Selective ■Other MPS Schools 59,822 68% 9,064 10% 3,008 3% 5,011 6% 8,394 9% 3,364 4%
8
Public Schools in Milwaukee
Traditional MPS Schools
Two-thirds of the 88,663 students enrolled in public and charter schools attend 122 MPS traditional schools, with 48,910 of those students enrolled in 99 neighborhood schools with designated atten-dance areas, and the remaining 10,912 in 23 city-wide schools, which do not have attendance areas. Although neighborhood schools have boundaries and give priority for admission to students who live within those boundaries, all but four of these schools draw the majority of their students from outside of their designated attendance areas. These attendance patterns emerged as transporta-tion optransporta-tions became available through MPS. As a result, students who are willing to travel are able to attend other neighborhood schools.
Seventeen of the 23 citywide schools are specialty schools, including language programs or a Montes-sori curriculum. While these schools have no official boundary, it is the goal of MPS to enroll 55 percent of the students in entry-level grades from within the schools’ walk zones, which are one mile for elementary schools and two miles for high schools. When zip codes are used to define proximity, only two of these schools, however, enroll a majority of their students from the zip code where the school is located.
Other MPS Schools
MPS also includes 47 non-traditional public schools that are not necessarily open to all students. These schools include 31 partnership schools that serve 2,758 at-risk students; seven early childhood care centers that serve 607 students in pre-kindergarten and kindergarten; and nine selective schools that serve 8,394 academically or artistically gifted students.
Charter Schools in Milwaukee
In Milwaukee, MPS, the City, UWM, and the Milwaukee Area Technical College (MATC) are all authorized by state law to provide school charters to nonprofit corporations (although MATC has not authorized any to date). Both the number of charter schools and their enrollment have been expanding in recent years. There are no limits to the number of charter schools or students in Milwaukee, but MPS may not contract for educational services
for more than eight percent of the district’s total enrollment.
As public schools, charter schools must provide performance data to the families of prospective students and are held accountable for their per-formance. Since 2005, MPS has closed 21 charter schools—eight at the end of the 2008-2009 school year alone. Charter school operators and authorizers are working to ensure that charters are providing not only an alternative education for Milwaukee
families, but schools that meet academic standards.
MPS-Authorized Charter Schools
MPS charter schools have flexibility in hiring, schedules, and developing their curricula. They can also set their own guidelines for transportation and enroll students from all parts of the city. MPS authorizes two types of charter schools: instrumentality charter schools, in which leadership teams of MPS traditional schools apply to
receive greater freedom in designing the school’s curriculum, and non-instrumentality charter schools, which are operated by independent nonprofit organizations.
Thirty MPS instrumentality charter schools enroll 9,064 students at all grade levels, 10.2 percent of the total public and charter student population. Thirteen non-instrumentality charter schools enroll 3,008 students, three percent of the student population. Fourteen instrumentality charter schools (seven elementary and seven high schools) have attendance areas, although like other MPS public schools, a small percentage of students attend from within boundaries. Only three MPS charter schools, none with attendance areas, enroll more than 50 percent of students who reside in the zip code where the school is located.
Two non-instrumentality charter schools, Bruce Guadalupe Middle School and Veritas High School, were no longer authorized by MPS after the 2008-2009 school year. These schools enrolled 782 and 184 students, respectively. However, because this is a point-in-time analysis, the enrollment and performance data for these schools were included with the other MPS non-instrumentality charter schools for this report.
9
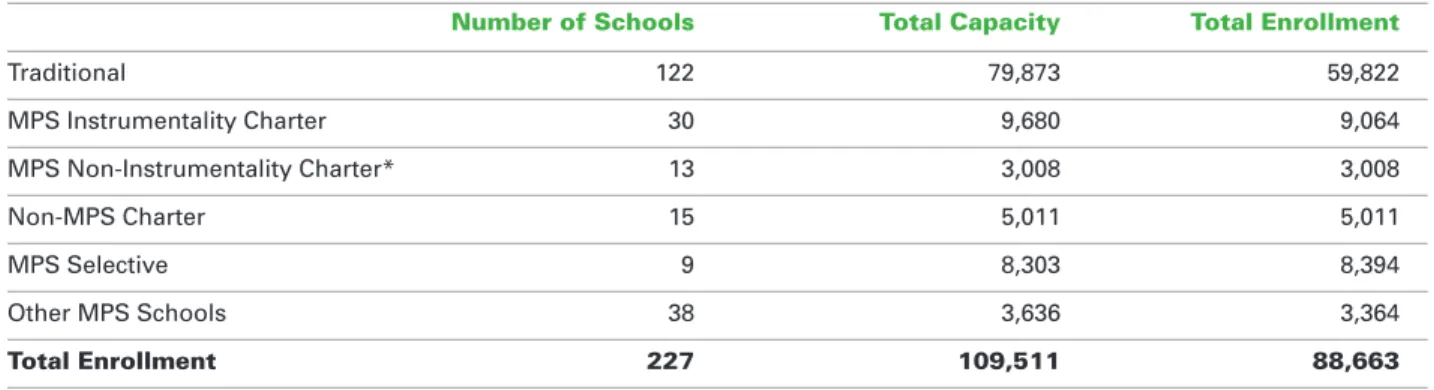
Table 1:Enrollment and Capacity of Public Schools in Milwaukee by School Type
Number of Schools Total Capacity Total Enrollment
Traditional 122 79,873 59,822 MPS Instrumentality Charter 30 9,680 9,064 MPS Non-Instrumentality Charter* 13 3,008 3,008 Non-MPS Charter 15 5,011 5,011 MPS Selective 9 8,303 8,394 Other MPS Schools 38 3,636 3,364 Total Enrollment 227 109,511 88,663
*Table includes two charter schools, Bruce Guadalupe Middle School and Veritas High School, that were no longer authorized by MPS after the 2008-2009 school year. See the MPS Authorized Charter Schools section for more information.
Non-MPS Authorized Charter Schools
There are 15 charter schools operating in
Milwaukee that are not authorized by MPS. Five are authorized by the City and ten are authorized by the UWM. These schools have different educational regulations and are more flexible in their curricula than traditional public schools. They enroll 5,011 students, 5.7 percent of Milwaukee’s total student enrollment.
Private Schools in the Milwaukee Parental Choice Program
The establishment in 1990 of the Milwaukee Parental Choice Program (MPCP), the first school voucher program in the nation, placed Milwaukee at the forefront of education reform and the developing school choice movement. The initial program paid for several hundred low-income children to attend secular private schools. After an evaluation of the first five years, during which participation grew to several thousand children, Wisconsin’s legislature voted to expand the program to allow parochial schools to participate and to make the program available for up to 15 percent of the students enrolled in MPS. Litigation on the program’s constitutionality delayed this expansion another three years. Now, twelve years later, 126 private schools participate in MPCP, enrolling almost 20,000 low-income students at an annual cost of $12 million.
In 2008–2009, the 126 private schools in the program reported a total enrollment of 27,510. Of these, 19,947, or 72.5 percent, were voucher students. Voucher student enrollment ranged from two to 100 percent of the participating schools’ enrollment.
Until this year, private schools participating in MPCP were not required to be accredited (only to seek accreditation), nor were they required to use the state’s standardized tests and to report these scores to the public. They do report test scores to the School Choice Demonstration Project, the program’s independent evaluator. Several schools failed to comply with these minimum requirements and were removed from the program. However, for 12 years it has not been possible for stakeholders or MPS to evaluate the performance of schools participating in MPCP in the context of the entire district.
In 2009, Wisconsin’s legislature amended MPCP. In the fall of 2010, participating schools must administer the Wisconsin Knowledge Concepts Examination (WKCE) to all 4th, 8th, and 10th graders and report results to the Department of Public Instruction (DPI) as well as the School Choice Demonstration Project. In addition, participating schools must establish and communicate to parents academic standards for advancement and
graduation. Administrators, teachers, and teacher’s aides will have to meet the same minimum require-ments as their counterparts in public school districts.
10
Type of School
MPCP School
A private school that participates in the Milwaukee Parental Choice Program.
MPS Charter
A charter school that is authorized by MPS. These schools include instrumentality charters, which are operated by MPS and have union regulations for teachers, and non-instrumentality charters, which are operated by nonprofit organizations.
Non-MPS Charter
A charter school that is not authorized by MPS. These schools can be authorized by the University of Wisconsin Milwaukee, the City of Milwaukee, or the Milwaukee Area Technical College.
Selective School
A school that has academic or audition-based requirements for entrance. Unless a school has these specific requirements, it is non-selective.
Traditional School
An MPS school whose enrollment is open to all children. Traditional neighborhood schools have attendance boundaries, whereas traditional citywide schools do not have boundaries.
School Performance Levels
Tier I Schools
Tier I public and charter schools meet or exceed the state standard on both the WKCE math and reading exams. Tier I MPCP schools received a rating of High in both subjects by Great Schools.
Tier II Schools
Tier II schools perform between 75 and 100 percent of the state standard on both of the WKCE exams. Tier II MPCP schools received a rating of at least Middle in both subjects by Great Schools.
Metrics
Capacity
The number of students a program or building is designed to serve. For most charter schools enrollment serves as a proxy for capacity.
Citywide Capacity
The sum of the total number of seats in all
public, charter, and MPCP Tier I and Tier II schools.
Current Enrollment
The number of students enrolled in public and charter schools.
Potential Enrollment
The total number of school-age children.
Regional Indicator
An indicator calculated using the service level and service gap for a region created by a zip code and the attendance areas of the Tier I and Tier II schools that overlap it.
School Utilization
For each school, the ratio of school enrollment to the school capacity. Excess capacity refers to a school whose enrollment is less than its capacity.
Service Gap
The total number of students that cannot be served by a Tier I or Tier II school in a given geographic unit of analysis.
Service Level
The proportion or percentage of potential and current enrollment that can be served by the Tier I and Tier II capacity located in the geographic unit of analysis.
Tier I and Tier II Capacity
The number of seats in a school that meets or exceeds 75 percent of the state standard on the WKCE exams.
WKCE Exam
Wisconsin Knowledge and Concepts Exam, a standardized exam given to students in public schools throughout Wisconsin in grades 3 through 8 and grade 10.
Programs
Milwaukee Parental Choice Program (MPCP)
A program established by the Wisconsin state legislature in 1990 that provides vouchers for low-income students to attend private schools.
Voucher Student
A student who receives a voucher through the MPCP program to attend a private school.
Definition of Terms
11
The primary goals of this needs assessment are to understand the location and distribution of performing schools as measured by Wisconsin state standards, and to set geographic priorities for new performing schools. The need determined by the analysis is relative because the method takes into account not only the demand (i.e., the number of school-age children) and the supply (i.e., the number of seats in schools that perform at state standards), but also information on location and enrollment.
This report represents a point-in-time analysis of the school-age population, school performance and school enrollment in Milwaukee during the
2008-2009 school year. It relies on the following data from the 2008-2009 school year:
● School-age population ● Total school enrollment
● School enrollment data by zip code ● School performance
● School capacity ● School location
● School attendance area
Public and MPS-authorized charter school
enrollment and performance data was provided by MPS. Non-MPS charter data was provided by charter school authorizers, UWM and the City. MPCP enrollment as well as some charter
performance information was provided by DPI and the Wisconsin Information Network for Successful Schools (WINSS). The performance data for the MPCP schools was from the Great Schools Milwaukee School Chooser 2010-2011. School-age population figures were based upon 2009
estimates compiled by ESRI, Inc.
Study Geography
This report determines where there is the greatest need for performing schools by examining
school performance and the number of school-age children at the zip code level, rather than the individual school. Several smaller zip codes were combined to create areas that were comparable to other, larger zip codes, and the geographic analysis is based on 20 zip code areas.2
Map 1 depicts the 20 zip code areas used in the analysis.
Determining Milwaukee’s Current and Potential Enrollment
Current Enrollment in a zip code area is the number of students residing in that zip code who attend a public or charter school in Milwaukee in grades K4, four-year-old preschool, through 12. Students in grade K3, three-year-old preschool, are excluded because K3 seats are limited and not all schools include a K3 classroom, whereas the majority include K4. Students who attend the four non-MPS authorized charter schools that did not provide enrollment data by zip code are assigned to the zip code in which the school is located.
The analysis divides the demographic data of school-age children into Milwaukee’s 20 zip code areas. The census block groups that comprise the MPS district were coded to reflect their zip code. Fifty block groups overlap into more than one zip code area. To ensure the most accurate population estimates for each zip code area, the demographic data in these block groups are apportioned according to the estimated share of residential blocks falling in each area. This approach accounts for unpopulated commercial and industrial blocks. The population of school-age children (4-17 years old) in each zip code area represents the Potential Enrollment, or potential demand for performing schools, in the analysis.
Measuring Capacity in the Analysis Using School Performance Data
IFF’s methodology differentiates the schools in each zip code based on their performance. In 2008-2009, the Wisconsin state standard on the WKCE was 74 percent of a school’s students scoring proficient or advanced in Reading and 58 percent scoring proficient or advanced in Math. If a school meets this state standard, IFF considers it as performing. However, since so few schools met the Wisconsin state standard, IFF had to use different criteria to distinguish between schools that comprise the capacity in the analysis against which enrollment is compared. For purposes of this analysis, IFF categorized schools into Tier I and Tier II, using a school’s aggregate score on the WKCE in Reading and Math. Tier I are schools at
Methodology
2.Zip code 53225 includes a small portion of zip code 53051 that falls within MPS boundaries. Zip code 53207 includes small portions of zip codes 53154 and 53235 that fall within MPS boundaries.
12
the Wisconsin state standard or above. Tier II are schools that perform between 75 and 100 percent of the state standard. Non-performing schools perform below 75 percent of the state standard in either Reading or Math.
The first step in the study methodology is to distinguish between the capacity or the number of seats in Tier I and Tier II schools and all other public schools. The capacity in Tier I and Tier II schools is compared to the number of school-age children citywide and in each zip code and is used to analyze and rank by zip code where better performing schools are needed.
Eight public and charter schools in the analysis do not have performance data for the 2008-2009 academic year and are not included.3
Forty-seven non-traditional MPS schools are excluded from the analysis because their enrollment is not open to all students. There are three selective high schools that meet the criteria for Tier I and Tier II capacity. For purposes of the analysis, these schools are included in the report’s citywide numbers, but not the zip code analysis.
Of the 126 MPCP schools, only 23 reported their test scores in the Great Schools Milwaukee School Chooser 2010-2011. Students in these schools took
either the WKCE, TerraNova, or Iowa Test of Basic Skills (ITBS). Great Schools used statistical
formulas to compare the TerraNova and ITBS tests against the WKCE and compared scores across all school types.4Great Schools then assigned each school a rating of High (10 points below WKCE state average and above), Middle (11-30 points below WKCE state average), or Low (more than 30 points below WKCE state average) in both Reading and Math. Schools that received ratings of High in both subjects are considered Tier I. Schools that received Middle in both subjects are considered part of Tier II.
Determining Tier I and Tier II Capacity
The Tier I and Tier II capacity of each zip code area is the total number of seats in the schools that met the criteria. Many MPS traditional schools have attendance areas that overlap two or more zip code areas. The percent of students that reside in a given attendance area is determined for each zip code, and the Tier I and Tier II capacity of the schools is then apportioned according to each zip code area. The capacity in Tier I and Tier II schools that did not have attendance areas, charters, traditional citywide schools, and reporting MPCP schools, is assigned to the zip code area in which a school is located.
Assessing the Need for Performing Schools
The needs assessment compares Tier I and Tier II capacity, with the two measures of demand: Current Enrollment (the number of students enrolled in public and charter schools grades K4–12) and Potential Enrollment (the number of all school-age children). Current Enrollment is
compared with Tier I and Tier II capacity in public and charter schools only. Potential Enrollment is compared with Tier I and Tier II capacity in public, charter, and reporting MPCP schools. Using the Tier I and Tier II capacity and enrollment numbers, two measures, service level and service gap, are calculated to gauge both the relative and
absolute need for better performing schools in Milwaukee.
● Service levelis the percent of students who can
be served by the capacity in Tier I, Tier II, or both schools. It is calculated by the total seats in Tier I and Tier II available to children in a zip code
Table 2: Tier I and Tier II Criteria
Percent of Percent Percent State Proficient Proficient Standard or Above on or Above on
WKCE: WKCE: Math Reading Tier I 100% or above 58% 74% State Standard Tier II 75–100% of 43.5% 55.5% State Standard
3.Of the non-reporting schools, six do not have this data because they only enrolled students in grades for which the WKCE is not administered, grades 3 through 8 and grade 10. These schools include two traditional schools, three MPS charters, and one non-MPS charter. Two additional traditional schools do not have standardized exam scores included in the data provided by MPS, although enrollment encompassed WKCE testing grades.
4. More information is available on Great School’s methodology at www.greatschools.net/milwaukee.
13
Map 1:
Milwaukee Study Geography
14
divided by the total number of students who reside in the zip code.
● Service gapis the total number of students
who cannot be served by existing capacity in Tier I, Tier II, or both. It is calculated by the total number of students who live in the zip code less the number of Tier I and Tier II seats.
Service level is a relative or scaled measure of need, whereas service gap is an absolute measure of need.
Calculating Zip Code Service Levels and Service Gaps
For Milwaukee and each of its zip code areas, service levels and service gaps are calculated based on Tier I and Tier II capacity relative to current demand as measured by both Current Enrollment and Potential Enrollment. Each of the zip code areas is then ranked from 1–20 for both the Current Enrollment service level and service gap and the Potential Enrollment service level and service gap. All zip code areas with a zero percent service level receive a rank of one. Indicators for Current
Enrollment and Potential Enrollment are created for each zip code area by calculating the weighted average using the weights listed in Table 3 for each zip code area’s service level and service gap rank. Zip code areas are then ranked from 1–20 for both Current Enrollment and Potential Enrollment based on these indicators. The area ranked number one corresponds to the highest relative need.
Regional Indicator
IFF also calculates a Regional Indicator as part of the zip code analysis. The methodology’s geographic focus seeks to aggregate and analyze data
differently from standard MPS analysis. As a result, it is necessary to account for the overlap between school attendance areas and the zip code areas. Generally, this is only necessary for elementary
schools because high school students are more likely to travel to attend school, and because high school attendance areas are larger and often encompass more than one zip code. Additionally, MPS high school attendance areas are used mostly for transportation purposes.
A region for each zip code area is created by identifying all the elementary school attendance areas that overlap with the zip code boundaries. All public and charter school students residing in those attendance areas are counted in the Regional Indicator’s demand estimate, and all elementary public and charter schools in the Tier I and Tier II capacity whose attendance areas fall in the zip code are included in the Regional Indicator’s supply. In addition to schools with attendance areas, citywide public and charter schools at Tier I and Tier II are added to the supply. Supply and demand are once again compared using the service level and service gap measures. These measures are then combined into a Regional Indicator ranking. Private schools participating in MPCP are not included in the regional analysis. A rank of one represents the highest level of regional need for better performing schools.
Ranking the Need for Performing Schools
The final step in the analysis combines the three indicators listed above—Current
Enrollment, Potential Enrollment, and Regional Indicator—into a weighted average. Each of Milwaukee’s zip code areas receives a rank from 1–20 for each of the indicators included in the analysis. Using the weights listed in Table 4, a composite weighted average is calculated for each zip code area. The greatest weight is given to the comparison between Tier I and Tier II capacity in the zip code area with Potential Enrollment. The composite scores are ranked from 1–20 to determine each zone’s final rank of overall need.
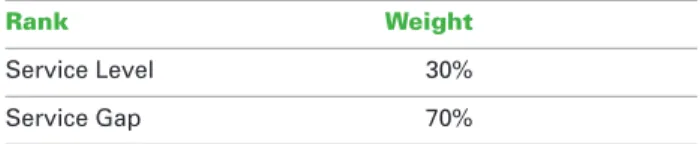
Table 3: Weights for Calculating Current, Potential, and Regional Indicators
Rank Weight
Service Level 30%
Service Gap 70%
Table 4: Indicator Weights for Final Ranking of Zip Codes
Rank Weight
Current Enrollment 30% Potential Enrollment 50% Regional Indicator 20%
15
Tier I and Tier II Schools and Capacity In 2008-2009, there were 73 public and charter schools and another 19 private schools participating in MPCP that qualified as Tier I and Tier II. These 92 schools comprise the total citywide Tier I and Tier II capacity of 41,860 seats, including 4,037 seats in reporting MPCP schools, of which 2,515 were filled by voucher students.
Approximately half of the Tier I and Tier II capacity is in neighborhood schools, which also have the highest number of schools and enrollment. Five zip codes only have Tier I and Tier II capacity in neighborhood schools. Most Tier I and Tier II capacity is at the elementary level. There are only 184 Tier I and Tier II seats in public and charter high schools, and an additional 61 seats in MPCP at the high school level.
Traditional MPS Schools
Fifty-three traditional public schools—39 neighbor-hood and 14 citywide—are included in the Tier I and Tier II capacity. These schools comprised 39.3 percent of all neighborhood schools and 60.9 percent of all citywide schools. Of the 39 neighborhood schools, seven are Tier I and 32 are Tier II. Of the 14 citywide schools, eight are Tier I and six are Tier II.
The total Tier I and Tier II capacity for neighborhood schools is 22,377 out of a total of 67,169 available seats in this type of school (33.3 percent), while
citywide schools have 7,118 Tier I and Tier II seats out of a total capacity of 12,704 (56 percent).
MPS-Authorized Charter Schools
Fifteen of the 44 MPS-authorized charter schools are Tier I and Tier II. These 15 schools have a total Tier I and Tier II capacity of 6,385 seats, 52.8 percent of the 12,072 seats in these 44 schools. Six schools are Tier I and another nine are Tier II.
Non-MPS Authorized Charters
Five charter schools out of the 15 authorized by UWM or the City are Tier I and Tier II. The Tier I and Tier II capacity in these schools is 1,824 seats, 36.4 percent of the 5,011 seats in these 15 schools. Of these five schools, two are Tier I and three are Tier II. Table 5 summarizes Tier I and Tier II capacity by school type.
Milwaukee Parental Choice Program
Nineteen of the 23 MPCP schools for which data is available are Tier I or Tier II schools. In fact, 15 are Tier I, whereas only four are Tier II. The 23 reporting schools enroll a total of 4,877 students, of which 3,326 are voucher students. Figure 3 delineates the total voucher enrollment in all of the MPCP
schools based on whether the schools reported and whether they meet Tier I and Tier II criteria. It shows that 75.6 percent of these voucher students are en-rolled in a Tier I or Tier II school. However, perform-ance data is only available for 16.7 percent of all voucher students in the program.
Research Results
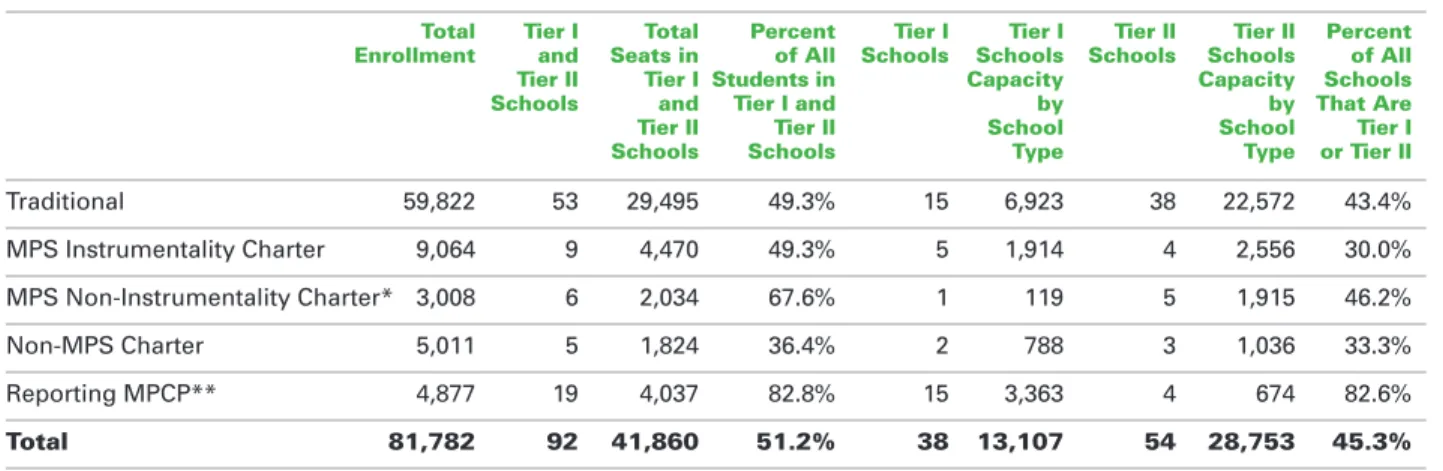
Table 5: Zip Code Analysis: Tier I and Tier II Capacity by School Type
Total Tier I Total Percent Tier I Tier I Tier II Tier II Percent Enrollment and Seats in of All Schools Schools Schools Schools of All Tier II Tier I Students in Capacity Capacity Schools Schools and Tier I and by by That Are Tier II Tier II School School Tier I Schools Schools Type Type or Tier II
Traditional 59,822 53 29,495 49.3% 15 6,923 38 22,572 43.4% MPS Instrumentality Charter 9,064 9 4,470 49.3% 5 1,914 4 2,556 30.0% MPS Non-Instrumentality Charter* 3,008 6 2,034 67.6% 1 119 5 1,915 46.2% Non-MPS Charter 5,011 5 1,824 36.4% 2 788 3 1,036 33.3% Reporting MPCP** 4,877 19 4,037 82.8% 15 3,363 4 674 82.6% Total 81,782 92 41,860 51.2% 38 13,107 54 28,753 45.3%
*Table includes two charter schools, Bruce Guadalupe Middle School and Veritas High School, that were no longer authorized by MPS after the 2008-2009 school year. See the MPS Authorized Charter Schoolssection for more information.
Map 2:
Tier I and Tier II Schools
School Types ● Traditional ● Charter ● Reporting MPCP ● Elementary School ■ High SchoolMilwaukee Zip Code Boundary
16
17
Figure 3
MPCP Voucher Student Enrollment
Map 2 shows the distribution of all Tier I and Tier II public and private schools included in the analysis. A map with all Tier I and Tier II as well as the schools performing below 75 percent of state stan-dard in 2008-2009 can be found in Appendix A.
■Voucher Students in Non-Reporting Schools
■Reporting Schools: Tier I
■Reporting Schools: Tier II
■Reporting Schools: Non-Performing
16,621 (103 Schools)
811 463 2,052
18
Citywide Analysis of Tier I Schools
Public and Charter Schools
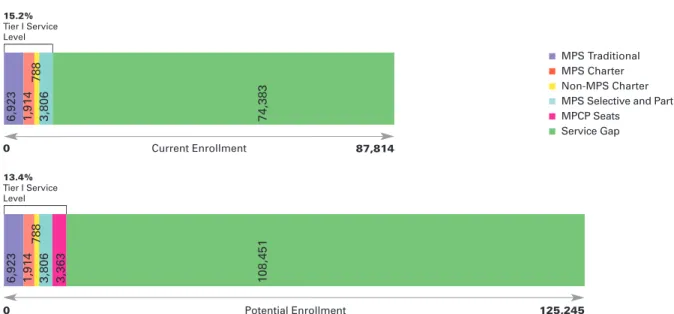
In Milwaukee, 15.2 percent of public school students can be served by Tier I schools, those schools that perform at the Wisconsin state standard as illustrated by Figure 4. These schools have the capacity to serve a total of 13,431 students; however, 3,800 seats are in selective schools and therefore, not all students are eligible to attend them. Twenty percent or 2,702 of these seats are in charter schools operated by MPS and other nonprofit corporations. Therefore, the city needs 74,383 seats of performing capacity to ensure that all students in the public system have access to a performing school. In addition, most of this capacity is in elementary schools. The only Tier I high school capacity is the 1,902 seats that are part of the city’s selective school capacity.
MPCP Schools
The bottom bar in Figure 4 indicates how much Tier I capacity the reporting MPCP schools contribute to the entire system of public and private schools. There are an additional 3,363 Tier I seats in these schools. As reported earlier, only 2,052 of these are voucher students. Eighty-three percent of the MPCP capacity is in Tier I. Moreover, as with the public schools, almost all the MPCP seats are in elementary schools. Reporting private schools contribute fewer than 100 seats of high school capacity to the system.
Citywide Capacity for All School-Age Children
The combined public and private capacity can serve 13.4 percent, less than one-fifth, of school-age children. There is a total of almost 17,000 seats of capacity in Milwaukee’s Tier I schools. Because data is only available for
19 MPCP schools with 3,363 seats of Tier I capacity, the additional 24,417 seats in non-reporting
private schools are added to Milwaukee’s
potential demand and therefore, to the service gap. The city needs a maximum of 108,451 performing seats with all the seats in the non-reporting
schools. However, when the service gap is reduced by those seats, it decreases to 84,304. Therefore, the need for Tier I capacity ranges between a minimum of 84,000 seats and a maximum of 109,000 seats in Milwaukee.
Citywide Analysis of Tier I and Tier II Schools For purposes of this analysis, as described in the methodology, Tier I capacity is combined with Tier II capacity in schools that meet at least 75 percent of the Wisconsin state standard. The inclusion of Tier II capacity in 50 public schools and four MPCP schools significantly expands the number of seats included in the analysis, thereby decreasing the reported service gaps as illustrated in Figure 4.
Public and Charter Schools
Tier II non-selective and selective public schools add significant capacity to the system of almost 29,000 seats. However, even with the addition of these seats, Tier I and Tier II schools can serve only about half of all public school students. There are almost three times as many seats in Tier II non-selective public schools as in Tier I. There are also an additional 1,338 seats in Tier II selective schools. Once again, high school capacity is only available in selective schools.
MPCP Schools
The majority of MPCP schools for which data is available are Tier I schools. In fact, there are only 674 seats of capacity in Tier II MPCP schools and, again, these are at the elementary school level. They reduce the gap slightly, but provide seats for less than one percent of school-age children.
Citywide Results
19
Current Enrollment Potential Enrollment 15.2% Tier I Service Level | | 0 0 125,245 87,814 ■MPS Traditional ■MPS Charter ■Non-MPS Charter■MPS Selective and Partnership ■MPCP Seats
■Service Gap
Citywide Capacity for All School-Age Children
The combined public and private Tier I and Tier II schools can serve a total of 37.5 percent of all school-age children. Therefore, the maximum service gap for school-age children is almost 79,000 seats after Tier II capacity is added. If all of the non-reporting MPCP seats were performing, the service gap decreases to 56,263 seats. In addition, of the total 46,349 seats of citywide capacity in
Tier I and Tier II schools, including selective and MPCP, 93.9 percent is in elementary schools. The high school service gap is equal to all the high school-age children, 34,727. In the zip code analysis that follows, IFF chose to include non-reporting schools as part of Milwaukee’s potential demand, and these seats are counted in the service gaps although IFF recognizes that some of the
non-reporting schools may in fact be performing.
1 ,9 1 4 6 ,9 2 3 7 8 8 3 ,8 0 6 3 ,3 6 3 1 0 8 ,4 5 1
Figure 4. Citywide Tier I Seats by School Type and Service Gap Compared to Current and Potential Enrollment
13.4% Tier I Service Level | | 1 ,9 1 4 6 ,9 2 3 7 8 8 3 ,8 0 6 7 4 ,3 8 3
20
The following analysis examines the need for schools in the 20 zip code areas that comprise the study geography. It uses the data on Tier I and Tier II capacity in public, charter and private schools, school enrollment, and school-age population to rank each of the zip codes according to its overall need. The analysis prioritizes the zip codes that have the greatest need for Tier I and Tier II schools to serve the students residing in that community. In addition, because students have choices among various types of public and private schools throughout the city, this analysis considers the extent to which students travel from the high-need areas identified by the study to Tier I and Tier II schools in other parts of the city.
Elementary School Analysis
Public and Charter School Tier I and Tier II Elementary School Capacity by Zip Code
There are approximately 37,000 seats of elementary school capacity, grades K–8, in Tier I and Tier II public and charter schools. As Map 2 illustrates, Tier I and Tier II public and charter elementary schools are located in all but one of Milwaukee’s zip code areas. However, when the distribution of Tier I and Tier II capacity is examined by zip code as on Map 3, it becomes clear that these seats are not distributed evenly.
The findings regarding elementary capacity are:
● Zip code 53206, west of I-43 and south of Capitol,
has no Tier I or Tier II capacity, and zip codes 53224 and 53209, with only 36 and 119 Tier I and Tier II seats respectively, effectively have no performing capacity.
● The five zip codes south of I-94 (53204, 53215,
53221, 53219-220-227-228, and 53207) have significantly more Tier I and Tier II capacity than the 15 northern zip codes. The exception on the north side is zip code 53218, which has almost 2,700 seats of Tier I and Tier II capacity.
● Four of the five south side zip code areas
have between 3,500 and 5,000 Tier I and Tier II capacity, two to two-and-a-half times as much capacity as the other areas of the city. The only exception is zip code 53221, which has fewer, but still many, seats of Tier I and Tier II
capacity, 2,543.
● The five zip code areas in central Milwaukee,
south of Congress and north of I-94, have several thousand seats of Tier I and Tier II capacity each. These include 53202-211, 53205, 53208, 53210, and 53222.
21
Map 3:
Public and Charter Elementary School Tier I
and Tier II Capacity by Zip Code Area
Elementary School Tier I and Tier II Capacity ■ 0–500
■ 501–1,500 ■ 1,501–3,000
■ >3,000
22
Service Levels and Service Gaps
On Map 4 public and charter school Tier I and Tier II capacity is compared against Current Enrollment, the number of public school students. It provides a picture of the need for Tier I and Tier II seats among children in public schools. The number in each zip code area is the service gap, the total number of students residing there that cannot be served by Tier I or Tier II schools. Numbers in parentheses indicate that there are more Tier I and Tier II seats in a zip code area than there are students residing there.
Additional elementary school findings are:
● In most of the zip codes north of North Avenue,
fewer than 50 percent of children can enroll in a Tier I or Tier II school.
● There are between 2,600 and 4,300 students in
each of the four zip codes in the center of the north side, 53206, 53209, 53210, and 53216 that do not have access to a seat in a school at 75 percent of the state standard.
● An additional 2,500 seats are needed in the far
northwest corner of the city, zip code 53224, where there is almost no Tier I or Tier II capacity.
● The highest concentration of Tier I and Tier II
seats is located in the five zip codes within the densely populated central area of Milwaukee, between Morgan and North and west of the Milwaukee River (53204, 53215, 53205, 53210, and 53213-214-226). Service levels in these five zip codes range from 50 percent to 160 percent of students.
● Despite higher service levels, several of these
central area zip codes, 53204 and 53215, also have significant service gaps, with a need for approximately 2,300 and 3,800 elementary seats each respectively.
● In four other zip code areas, including
downtown, there is a surplus of Tier I and Tier II seats in elementary schools. These include 53202-211, 53219-220-227-228, 53221, and 53207.
High School Results
Public and Charter High School Tier I and Tier II Capacity, Service Levels, and Service Gaps
Milwaukee has no non-selective Tier I high schools, and only one high school is Tier II, serving fewer than 200 students. Therefore, in effect all public high school students need a seat in a high school that performs at state standard.
Comparing the limited Tier I and Tier II capacity in Milwaukee’s high schools with the public school enrollment yields 19 out of 20 zip code areas with a service level of zero. Veritas High School, a charter school, provides 184 seats of Tier II capacity in zip code 53215, giving it a 6.6 percent service level. Map 5 shows the distribution of the need for Tier I seats for all high school-age children, as measured by the service gap in each of the zip code areas. As noted above, the only zip code whose gap is not equal to its entire current high school enrollment is 53215 where Veritas High school serves 184 children.
23
Map 4:
Elementary School Service Level and Service
Gap by Zip Code Based on Public and Charter
Tier I and Tier II Seats
Service Level Range ■ 0%–25%
■ 26%–50% ■ 51%–75%
■ >75%
24
Map 5 illustrates the number of seats needed for high school on both the north and south sides of the City.
Findings include:
● Sixty percent of Milwaukee’s zip codes (12 of 20)
need at least 850 seats of performing high school capacity to meet the needs of public high school students residing in those areas.
● The greatest need for high school seats is in four
of the zip codes on both the north and south sides that also have a high need for elementary school seats in Tier I and Tier II schools. These include 53218, 53209, 53204, and 53215.
● On the north side, zip codes 53218 and 53206
need 2,675 and 2,108 seats respectively.
● There is an equally great need on the south side
in zip codes 53204 and 53215, where one of the only Tier II high schools is located. These areas need 2,020 seats and 2,598 high school seats.
MPS Selective High Schools
There are two selective high schools that perform at the Wisconsin state standard, Reagan High School and King High School. In addition, the Milwaukee School of Languages, which is a combined middle and high school, meets Tier II criteria. These three high schools enrolled over 2,700 students in the 2008-2009 academic school year, which is equal to 11 percent of the students enrolled in public and charter high schools, or 8 percent of all high school-age children in Milwaukee. Examining enrollment patterns in the selective schools finds that:
● King High School, which is a citywide school on
the north side with 1,503 students, draws the majority of its students from zip code 53209, where it is located, and the contiguous or proximate zip codes 53218, 53216, and 53210.
● Reagan High School, which is a selective school
designed to serve students on the south side in 53221 and the proximate zip codes, draws 75 percent of its students from that area.
● Milwaukee School of Languages, which is
located at the western edge of the city, draws most of its students from the north side of Milwaukee. Fewer than 100 students attend the school from the south side.
Zip Code Analysis with Reporting MPCP Schools
Location of Tier I and Tier II Reporting MPCP Schools
The following analysis uses the limited publicly available data on the performance of private schools in MPCP. As described earlier, this analysis only considers the 23 schools that report their test scores to Great Schools. These schools enroll approximately 17 percent of the students in MPCP. Four of these schools are not performing. Fifteen of these schools are Tier I and are
located in 12 different zip codes, largely in central and southern Milwaukee. A large number of Tier I seats, 620, are in zip code 53209, where there is otherwise very little Tier I and Tier II capacity. Of the 620, only 21 are in high schools. Another 790 seats of Tier I and Tier II capacity are located in 53221, an area with a relatively high number of Tier I and Tier II public schools. Only 40 of these seats are in high schools.
When the data from MPCP schools is incorporated into the zip code analysis, the capacity is
compared against Potential Enrollment. Tier I and Tier II capacity is attributed to the zip code where the school is located. It is summed with the Tier I and Tier II seats in public and charter schools to calculate the total Tier I and Tier II capacity located in each zip code.
25
Map 5:
High School Service Gap by Zip Code Based on
Public and Charter Tier I and Tier II Seats
Service Gap Range ■ 0–500
■ 501–1,000 ■ 1,001–2,000
■ >2,000
26
K–12 School-Age Children Service Levels and Service Gaps
Map 6 reports the K–12 service gaps and service levels for all zip codes when the combined Tier I and Tier II capacity in public, charter, and MPCP schools is compared with the total number of school-age children in each zip code. It further emphasizes the lack of Tier I and Tier II capacity on the north side described in the previous section, where few of the zip codes have enough Tier I and Tier II seats to serve even half of the children residing there. By contrast, on the south side, most zip codes below North Avenue have sufficient capacity to serve 50 percent or more of their
school-age children.
Only one zip code area, 53202-53211, reports a surplus of Tier I and Tier II seats, with more Tier I and Tier II seats in schools located in the zip code than there are children residing there. There are large service gaps in the three zip codes in the central and northeastern parts of the city, as well as in the central part of the south side even with the additional MPCP seats.
Ranking the K–12 Need for Performing School Options in Milwaukee
All 20 of Milwaukee’s zip code areas are ranked using the combined data on public and private capacity according to the methodology. The high-need areas emerge from the rankings of the zip codes and their individual service gaps. The relative position and magnitude of the need in the zip code
areas ranked numbers one through eight out of the 20 suggests that these are priority areas. Table 6 reports the rank, service level, and service gap for each of the Top Eight Zip Codes.
While these areas account for less than half of the zip codes in the analysis, most of the need is concentrated there. Key findings from ranking the need in Milwaukee include:
● More than two-thirds of the need for performing
schools is located in the Top Eight Zip Codes.
● Six zip codes on the city’s north and northwest
side (53206, 53209, 53210, 53216, 53218, and 53224) cannot provide a Tier I or Tier II seat to more than 75 percent of the school-age children residing there. These areas have the highest relative need in Milwaukee for Tier I and Tier II seats.
● Nearly 43,000 school-age children residing in
these six zip codes lack a Tier I or Tier II seat in a school of any type.
● In the remaining 12 zip code areas only 25,500
lack a Tier I or Tier II seat, less than half as many in the priority areas.
● Fifty-one percent of the need for seats
at or above 75 percent of state standard for all school-age children in Milwaukee is concentrated in these six areas.
● The remaining two high-need zip codes are
53204 and 53215 on the south side. These areas are densely populated and have a high absolute need for additional seats in Tier I and Tier II schools.
● Although there are Tier I and Tier II schools of all
types in these two zip codes, together they need an additional 14,000 seats of Tier I and Tier II capacity or another 17 percent of the
citywide need.
● Although 53215 has the greatest Tier I and Tier II
capacity of all zip codes in the study, 5,045 seats, it also has the largest school-age population, about 12,300 children. As a result, there are 7,000 children without a seat in a Tier I or Tier II school.
Table 6
Service Level, Service Gap, and Ranking of Top Eight Zip Code Areas
K-12 K-12 K-12 Rank Service Level Service Gap
53209 1 7.9% 8,575 53206 2 2.2% 8,166 53216 3 9.3% 7,227 53218 4 24.8% 8,045 53210 5 20.5% 6,469 53215 6 41.0% 7,248 53204 7 36.7% 6,713 53224 8 0.8% 4,358 Total 20.4% 56,801
27
Map 6:
K-12 Service Level and Service Gap by Zip Code
Based on Public, Charter, and MPCP Tier I and
Tier II Seats
Service Level Range ■ 0%–25%
■ 26%–50% ■ 51%–75%
■ >75%
28
Map 7 presents the Top Eight Zip Code Areas combined with the public and private Tier I and Tier II schools.
Space Utilization in Milwaukee Public Schools
The physical capacity of public schools is one measure of the system’s ability to provide access to a performing school. IFF’s methodology bases its rankings on the physical capacity of public school buildings. Often there is a difference between a school’s physical capacity and its actual enrollment. When a school chooses to enroll more students than it is designed to serve, it is overcrowded. However, in urban school districts such as MPS, the more common problem is underutilized old and larger school buildings, due to demographic changes and the mobility of the population. Some schools operate under models that intentionally do not fill the school to its full capacity. As a first step in addressing service gaps, it is important to consider a school district’s excess capacity. Table 7 provides data on excess capacity in Tier I and Tier II schools in Milwaukee.
● There are almost 4,000 excess seats in 40 of the
Tier I and Tier II traditional public schools.
● There are also several hundred excess seats in
MPS charter schools.
Student Attendance Patterns in Tier I and Tier II Schools
In Milwaukee, the majority of students do not attend either their designated attendance area school or another traditional public or charter school located in the zip code where they reside. Rather, many families elect to have their children travel to a more distant school they believe best meets their children’s educational needs. An
analysis of the enrollment in Tier I and Tier II schools by zip code suggests that children are less likely to travel outside of their zip code when they have better performing schools nearby and more likely to travel outside of their zip code when they do not. Figure 5 compares the attendance patterns in Tier I and Tier II schools of students residing in the six high-need zip codes in the north and the other 14 zip code areas.
This analysis finds that: in the six of the Top Eight Zip Codes on the north side, 53206, 53209, 53210, 53216, 53218, and 53224, 86.8 percent of students who reside there and attend a Tier I or Tier II school leave their zip code area to do so. In the other 14 zip codes, only 52.6 percent of students who reside there and attend a Tier I or Tier II school leave their zip code area to attend a Tier I or Tier II school. Therefore, students in the six high-need zip codes on the north side are 60 percent more likely than students in the other 14 zip codes to leave their zip code to attend a Tier I or Tier II school. Additionally, in the six high-need zip codes on the north side, resident students only occupy 37.5 percent of the Tier I and Tier II seats located in those areas.
Given that fewer than 50 percent of the schools in the system are Tier I and Tier II, students are clearly traveling to attend schools that perform below 75 percent of state standard as well. Students residing in areas with Tier I and Tier II schools are also affected by the lack of Tier I or Tier II seats else-where in the city. In zip codes 53215 and 53204, on the south side, where there is a high concentration of Tier I and Tier II schools, students residing in the zip codes or attendance areas only occupy half the seats in these schools and there is a combined service gap of nearly 14,000 seats.
Table 7
Space Utilization in Tier I and Tier II Schools Underutilized Excess Schools Capacity Traditional 40 3,982 MPS Charters 3 448 Non-MPS Charter 0 0 Selective 4 133 Total 47 4,563 Figure 5
Student Attendance Patterns in Tier I and Tier II Schools
North Side High Need Zip Codes (6) Other Zip Codes (14)
0% 20% 40% 60% 80% 100%
■Students Remaining in Their Zip Code to Attend a Tier I or Tier II School
■Students Leaving Their Zip Code to Attend a Tier I or Tier II School 13.2%
86.8% 47.4%
29
Map 7:
Tier I and Tier II Schools and Top Eight
Zip Code Areas
School Types
● Traditional
● Charter
● Reporting MPCP
Top Eight Zip Codes in Need of Service (K–12) Milwaukee Zip Code Boundary
30
1) Twenty-three schools in the IFF analysis performed at state standard, or Tier I. These 23, of 180 non-selective public and charter schools, serve 9,625 of 87,814 resident students, 10.9 percent of students currently enrolled in public schools.
2) Including 50 additional public and charter schools that meet 75 percent of the state standard (Tier II), the city’s Tier I and Tier II schools together serve 37,168 of 87,814 resident students, 42.3 percent of all the students currently enrolled in public schools.
3) Five of the nine MPS selective schools perform at state standard and one performs at 75 percent of state standard, as does one partnership school. These additional citywide Tier I and Tier II seats serve 5,144 MPS students.
4) The city requires 74,383 seats of Tier I capacity to serve all students currently enrolled in public and charter schools. When Tier I and Tier II capacity is compared with enrollment only 46,000 additional seats of capacity are needed.
5) Over two-thirds of the citywide need for a performing seat is in eight zip codes. Six zip codes on the north and northwest side, 53209, 53206, 53216, 53218, 53210 and 53224 and two on the south side, 53215 and 53204, comprise the Top Eight. Almost 57,000 school-age children residing in these eight areas are not able to attend a performing school near where they reside.
6) Zip codes 53215 and 53204 on the south side are among those with the highest Tier I and Tier II capacity, but they also include a large school-age population. Approximately 14,000 additional performing seats are needed in these two zip codes alone.
7) Students in the six high-need zip codes on the north side are 60 percent more likely than students in the other 14 zip codes to leave their zip code to attend a Tier I or Tier II school.
8) Milwaukee public, charter, and private schools participating in MPCP need a combined total of up to 78,846 performing seats to serve all school-age children residing in the city. This includes 22,633 seats that may be required to serve the students in non-performing or non-reporting schools in MPCP. Together, these schools can serve only about one-third of Milwaukee’s school-age population.
9) Milwaukee’s Tier I and Tier II public schools have the physical capacity to accommodate an additional 4,400 students.
10)There are nine Tier I and Tier II
instrumentality charters that serve almost 4,300 students. Eleven instrumentality and non-MPS charter schools enroll another 3,700 students. The best charter schools are much more
likely to be located on the south side of Milwaukee and are therefore not as accessible to children residing in the higher-need areas on the city’s north side.
11)There is no non-selective high school in Milwaukee that performs at state standard and only 184 seats in the one charter school at 75 percent of state standard (Tier II). There is a gap of 25,118 seats of capacity for public and charter high school students. MPCP schools only add 61 seats of Tier I and Tier II high school capacity.
31
Milwaukee has built a system with three types of schools: traditional public, including selective and alternative schools; charter; and private schools in MPCP. Among each of these types, there are schools that meet or approach the state standards and schools that do not, but in every category, based on available data, more than 50 percent of schools do not meet even 75 percent of the state standard. While the number of choices has perceived benefits, the system overall is not meeting state standards.
Parents make every effort to obtain a good education for their children—there are reported wait lists at performing schools of all types noted above.
MPCP serves almost 20,000 students—17 percent of school-age children—so Milwaukee is highly reliant on this program. However, neither the community at large nor advocates for school choice have had performance data on most of the MPCP schools. This limits the knowledge of MPS, civic leaders, and the City about Milwaukee’s entire school-age population at a time of change and planning. While MPCP schools are required to report performance to DPI beginning with the 2010-2011 academic year, it is not yet clear how this will be made public, incorporated into City or MPS strategic planning, and used to benefit all stakeholders, particularly parents and students.
While it is generally believed that parents have adopted the practice of allowing their children to travel to schools outside their immediate neighbor-hood in order to better meet students’ educational needs, evidence suggests that students travel because they have to, not because they want to. Better performing schools are filled with students residing in the zip code where they are located. The new cost-saving policy of limiting the distance public school buses will transport students will exacerbate the problems described in this report by making it harder for low-income children, who are more likely to travel to find a performing school, to obtain a good education. A parallel strategy of locating performing schools throughout the city, focusing on the priority zip codes in this report, will not preclude students from traveling for exceptional opportunities.
MPS has declared 24 properties as no longer needed for the district’s use. Of these, many are vacant school buildings, 11 of which are located in the priority zip codes in this report. At the same time, there are as many as 4,400 seats open in better performing schools, and many of these are in the high-need zip codes.
Public school buildings are owned by the city of Milwaukee, and some could be made available to charter school authorizers or to charter schools as part of a strategy to attract nationally-renowned charter school operators. An overall real estate plan for all excess property would also benefit the cost structure of the city and MPS.
Charter schools represent a public/private partner-ship model for achieving education goals through nonprofit corporations. Since charter schools are afforded more teacher and curricular flexibility than is available in the school district, the expectation is that they will meet performance standards. In order to realize the full potential of charter schools, authorizers must hold them accountable for their performance and take responsibility for closing those that do not perform. Without a commitment to performance, the charter school movement loses credibility. Only performing charter schools provide meaningful choices for families.
Milwaukee’s charter school authorizers have not been working with large regional or national charter operators although MPS entered into a contract with the state association of charter schools to recruit national operators and several have applied for charters. The use of national operators with proven track records of academic performance is one of the most efficient and effective strategies to increase the number of performing schools, and this strategy does not preclude continuing to provide opportunities for innovation from local leaders.
Leadership and responsibility for public education improvement in Milwaukee has been diffused and there are no shared goals across the community; in fact there are entrenched ideological factions. While authority to act is entrusted to various bodies and there are many tools to improve existing schools and introduce high-performing new