econ
stor
www.econstor.eu
Der Open-Access-Publikationsserver der ZBW – Leibniz-Informationszentrum Wirtschaft
The Open Access Publication Server of the ZBW – Leibniz Information Centre for Economics
Nutzungsbedingungen:
Die ZBW räumt Ihnen als Nutzerin/Nutzer das unentgeltliche, räumlich unbeschränkte und zeitlich auf die Dauer des Schutzrechts beschränkte einfache Recht ein, das ausgewählte Werk im Rahmen der unter
→ http://www.econstor.eu/dspace/Nutzungsbedingungen nachzulesenden vollständigen Nutzungsbedingungen zu vervielfältigen, mit denen die Nutzerin/der Nutzer sich durch die erste Nutzung einverstanden erklärt.
Terms of use:
The ZBW grants you, the user, the non-exclusive right to use the selected work free of charge, territorially unrestricted and within the time limit of the term of the property rights according to the terms specified at
→ http://www.econstor.eu/dspace/Nutzungsbedingungen By the first use of the selected work the user agrees and declares to comply with these terms of use.
Geyer, Johannes; Steiner, Viktor
Working Paper
Public pensions, changing employment patterns, and
the impact of pension reforms across birth cohorts: A
microsimulation analysis for Germany
School of Business & Economics Discussion Paper, No. 2010/8 Provided in cooperation with:
Freie Universität Berlin
Suggested citation: Geyer, Johannes; Steiner, Viktor (2010) : Public pensions, changing
employment patterns, and the impact of pension reforms across birth cohorts: A microsimulation analysis for Germany, School of Business & Economics Discussion Paper, No. 2010/8, http:// hdl.handle.net/10419/36680
Public
pensions,
changing
employment
patterns,
and
the
impact
of
pension
reforms
across
birth
cohorts
a
microsimulation
analysis
for
Germany
Johannes
Geyer
Viktor
Steiner
School
of
Business
&
Economics
Discussion
Paper
Economics
2010/8
978
‐
3
‐
941240
‐
20
‐
9
Public pensions, changing employment patterns, and the
impact of pension reforms across birth cohorts -
a microsimulation analysis for Germany
Johannes Geyer
DIW Berlin
[email protected]
Viktor Steiner
Free University Berlin and DIW
[email protected]
Abstract: We analyze the impact of changing employment patterns and pension reforms on
the future level of public pensions across birth cohorts in Germany. The analysis is based on a rich dataset that combines household survey data from the German Socio-Economic Panel Study (SOEP) and process-produced microdata from the German pension insurance. A microsimulation model is developed which accounts for cohort effects in individual employment and unemployment and earnings over the lifecycle as well as the differential impact of recent pension reforms. Cohort effects for individuals born between 1937 and 1971 vary greatly by region, gender and education and strongly affect lifecycle wage profiles. The largest effects can be observed for younger cohorts in East Germany and for the low educated. Using simulated life cycle employment and income profiles, we project gross future pensions across cohorts taking into account changing demographics and recent pension reforms. Simulations show that pension levels for East German men and women will fall dramatically among younger birth cohorts, not only because of policy reforms but due to higher cumulated unemployment. For West German men, the small reduction of average pension levels among younger birth cohorts is mainly driven by the impact of pension reforms, while future pension levels of West German women are increasing or stable due to rising labor market participation of younger birth cohorts.
Keywords: Public pensions, cohort effects, microsimulation JEL: H55, J26, J11
Acknowledgment: We thank participants at seminars in Berlin, Frankfurt/Main, Nuremberg,
and Paris for useful comments on an earlier version of this paper. Support from the Research Network (Forschungsnetzwerk Alterssicherung – FNA) of the German Pension Insurance Fund is gratefully acknowledged. The usual disclaimer applies.
1 Introduction
The political debate about the future of the public pension system in Germany has shifted from the issue of its financial sustainability to the question whether it will avoid old-age poverty, especially among the younger birth cohorts (see, e.g., OECD 2007). There are various factors affecting the development of income maintenance in old age. Although the pension reforms since 1992 have improved the long-term financial sustainability of the public pension system, they have substantially reduced income replacement rates. Furthermore, since reunification there has been rising and persistent unemployment particularly in East Germany. At the same time, there has been a trend away from the “standard” employment relationships covered by social security towards “flexible” work patterns typically not or only partially covered by social security, such as “marginal employment”, temporary employment, part-time jobs, and self-employment. A recent report commissioned by the Public Pension Insurance Fund and the Federal Ministry of Labor and Social Affairs (AVID 2005) suggests that these factors will lead to substantial reductions in the level of public pensions among younger birth cohorts, especially in East Germany.
The goal of the present study is to quantify the likely impact of these developments on the future level of public pensions across birth cohorts. To this end, we develop a microsimulation model which accounts for cohort effects in individual employment and unemployment and earnings over the lifecycle as well as the differential impact of recent pension reforms on birth cohorts. To account for cohort effects on the future level of public pensions across birth cohorts is important for at least two reasons.
On the one hand, the impact of the recently enacted pension reforms will affect younger birth cohorts to a much greater degree than cohorts already close to retirement. In particular, this concerns the demographic adjustment mechanism which determines the level of public pensions relative to current wages and the increase of the legal retirement age to 67 years by 2029. Furthermore, actuarial adjustments for early retirement and phasing out of special early retirement options for the unemployed and women were enacted which, given the relatively long phase-in period, also had heterogeneous effects on older and younger birth cohorts.
On the other hand, changes in the labor market that occurred during the past decades affected cohorts quite differently. One of the most obvious examples for the potential importance of cohort effects is the worsening of the labor market situation in East Germany in the aftermath of reunification. Birth cohorts in East Germany differ with respect to the share of their working life spent in the former GDR where open unemployment was virtually nonexistent and wages relatively equally distributed. Both factors as well as the politically
retirement age when they were integrated into the West German public pension scheme. East Germans in the middle of their career were affected quite differently by unification: In the first years of the transition, large parts of the economy had to be rebuild under the new market based system and caused redundancies and closure of factories on a large scale. Endowed with human capital from the former GDR they had to find new jobs in the unified labor market. This process, however, turned out to be a slow and the unemployment rate in East Germany, on average, is still double the West German level. Furthermore, wage convergence almost came to a standstill in the mid-1990s, with a substantial wage differential remaining (see Franz and Steiner 2000). In West Germany, the younger birth cohorts may also have been affected by the worsening of general labor market conditions. However, another cohort effect which might have contributed to differences across birth cohorts is the increasing labor force participation among women, especially those with higher education. In the German public pension system, cohort effects in employment histories have both a direct and indirect effect on the individual pension benefit. The direct effect relates to total employment over the life-cycle, the indirect effect works through lower wages due to previous unemployment.
The relevance of these cohort effects, if any, is of course an empirical question and depends on the chosen identification strategy which will be described in Section 3. Using a large and representative panel data set – the German Socio-Economic Panel (SOEP) – we are able to place emphasis on important socio-economic characteristics in addition to the birth cohort. We distinguish between East and West Germany and men and women throughout our analysis. Furthermore, we analyse the impact of education. Education has a well documented effect on both the employment probability and the wage level. In addition to the perspective of the individual pension, we simulate pension outcomes also on a household level. There we also describe how estimated cohort effects are used to project individual employment biographies and earnings which determine the individual pension level.
Our estimation results, summarized in Section 4, show that cohort effects vary greatly between region, gender, and education. The estimated cohort effects in individual employment patterns affect lifecycle wage profiles used to simulate future earnings for cohorts born between 1937 and 1971. Using simulated life cycle employment and income, we project gross future pensions across cohorts taking into account changing demographics and recent pension reforms. We look mainly at public pensions at the individual level from various perspectives. Simulation results show that pension levels for East German men and women will fall dramatically among younger birth cohorts, not only because of policy reforms but due to higher cumulated unemployment. For West German men, the small reduction of
pension reforms, while future pension levels of West German women are increasing or stable due to a rising labor market participation of younger birth cohorts. As summarized in the conclusion, these results shed light on the adequacy of future public pensions among younger age cohorts which is of crucial importance for social policy.
2
Empirical and Institutional Background
2.1
Evidence on changing work patterns across birth cohorts
Since reunification Germany has seen high and persistent unemployment with an extraordinary increase in long-term unemployment in East Germany. At the same time, full-time employment has been partially substituted for by part-full-time jobs and “marginal employment” not covered by social security (see, e.g., Rische 1999, Faik et al. 2001, Sachverständigenrat 2008). These labor market developments are likely to reinforce the negative impact of recent pension reforms (see Section 2.2) on the level of public pensions especially of younger birth cohorts.
There are a few studies analyzing the impacts of unemployment and changing employment patterns on future pension benefits across cohorts for Germany. Most of these studies were based on the AVID reports (“Altersvorsorge in Deutschland”) for the years 1996 and 2005 which investigate public and private pension provision of people aged between 40 and 60 (DRV 2000, 2007).1 The studies based on AVID 1996 report a weak negative trend for pension entitlements of younger cohorts of men born 1951-55 relative to those born 1936-40, particularly in East Germany. While younger cohorts of women tend to work more than older cohorts in West Germany, a substantial decline in employment and increase in unemployment is observed among younger cohorts of women in East Germany. The AVID 2005 study shows that these trends have continued in recent years: West German women continue to increase their labor market participation, in particular part-employment, while employment of West German men remains fairly stable across cohorts. For East Germany, the trend is negative for both men and women, with a substantial increase in unemployment. Using administrative data of recent entry cohorts of pensioners, Himmelreicher and Frommert (2006) report similar but weaker trends. Table 1 confirms these developments on the basis of retrospective SOEP data on employment histories across birth cohorts by gender and region.2
1 The data are not available for scientific research outside the Public Pension Fund and the Federal Ministry of Labor and Social Affairs, the two institutions which have jointly commissioned these surveys. For a summary of studies based on AVID 1996 see Steiner (2003).
Table 1 Employment histories across birth cohorts by gender and region (average cumulated duration in years)
Men Women
FTE UN FTE PTE UN NE
West Germany Age 30 – 34 : year Cohort 1951-55 : 1985 9.9 0.3 7.1 1.3 0.3 4.3 Cohort 1961-65 : 1995 8.6 0.5 6.5 1.5 0.7 2.5 Cohort 1971-75 : 2005 8.6 0.6 5.6 1.8 0.6 2.4 Total 9.0 0.5 6.4 1.5 0.5 3.0 Age 40 – 44 : year Cohort 1941-45 : 1985 20.3 0.3 10.4 2.8 0.2 10.2 Cohort 1951-55 : 1995 18.7 0.6 10.2 3.6 0.5 7.4 Cohort 1961-65 : 2005 18.0 0.8 10.4 3.9 0.8 5.1 Total 18.9 0.6 10.3 3.5 0.6 7.3 Age 50 – 54 : year Cohort 1931-35 : 1985 31.6 0.5 13.8 3.6 0.2 15.6 Cohort 1941-45 : 1995 29.2 0.7 14.0 4.7 0.5 13.4 Cohort 1951-55 : 2005 27.6 0.9 15.1 6.7 0.9 8.8 Total 29.4 0.7 14.3 5.0 0.6 12.5 East Germany Age 30 – 34 : year Cohort 1961-65 : 1995 10.0 0.4 8.7 1.2 0.9 0.7 Cohort 1966-70 : 2000 9.5 0.8 7.3 1.3 1.4 0.8 Cohort 1971-75 : 2005 8.5 1.4 6.2 2.1 1.4 0.7 Total 9.4 0.8 7.6 1.4 1.2 0.7 Age 40 – 44 : year Cohort 1951-55 : 1995 19.9 0.4 17.4 2.5 0.6 0.9 Cohort 1956-60 : 2000 19.0 1.2 17.0 2.0 1.2 1.1 Cohort 1961-65 : 2005 18.1 1.8 13.4 3.5 2.6 1.2 Total 18.9 1.1 15.9 2.7 1.5 1.1 Age 50 – 54 : year Cohort 1941-45 : 1995 31.0 0.6 24.5 5.3 0.8 1.9 Cohort 1946-50 : 2000 28.5 0.9 24.1 3.5 1.3 1.5 Cohort 1951-55 : 2005 28.2 1.8 24.2 3.1 2.5 1.2 Total 29.3 1.1 24.3 4.0 1.5 1.5
Notes: FTE = full-time employment, PTE = part-time employment, UN = unemployment,
NE = non-employment. The first year observation for West Germany refers to 1985, for East Germany to 1995.
Source: SOEP 1984 – 2006, own calculations.
For each age group and given calendar year, the table shows the average cumulated duration of the respective labor market state, and how the duration has changed across birth cohorts. Note that the first year of observation for East Germany (1995) differs from that for West Germany (1985), and hence results for the two regions are strictly comparable for the
and unemployment for men and additionally by part-time employment and non-employment for women.
As a result of the employment system in the former GDR, employment patterns of older cohorts do not show large gender differences in East Germany. Furthermore, the evolution of employment patterns of East German men and women is very similar. We observe a particularly strong increase in unemployment in East Germany and a decrease in employment for men and women, both in absolute and relative terms. For example, in the age group 40-44 years the cumulated duration of unemployment increases, on average, from 0.4 to 1.8 years for men and from 0.6 to 2.6 for women. This is in stark contrast to West Germany, where we observe only a slight reduction in employment and a small increase in unemployment for men and even a positive development for women. Women increase their cumulated employment experience while times of non-employment decrease markedly over cohorts. For example, women aged 50-54 have cumulated about ten years of unemployment and non-employment by 2005, while in 1985 the same age group had cumulated about 16 years of non-employment and unemployment.
How will the weakening of full-time employment and increasing unemployment among younger birth cohorts affect future levels of public pensions? As described in the next section, the German public pension system implies a fairly close relationship between an individual’s lifetime earnings and the level of her own public pension. This relationship implies that unemployment may affect individual pension entitlements in two ways: First, by reducing the employment years counted towards individual pension entitlements and, secondly, by negatively affecting the life-cycle wage profile. Regarding this latter effect, empirical studies by Licht and Steiner (1992), Beblo and Wolf (2002), and Wunder (2006) indicate that unemployment or non-employment spells have significant long-term effects on an individual’s future earnings, and that these effects tend to be the stronger, the longer these spells have lasted. The illustrative calculations presented in Wunder (2006) also show how the increasing importance of unemployment among younger age cohorts may affect their future pension levels.
2.2
The German PAYG pension system – structure and reforms
The public pension scheme in Germany is a pay-as-you-go (PAYG) system.3 As such, population ageing is expected to put pressure on its financial sustainability in the coming decades, mainly due to three factors: rising life expectancy, very low fertility rates (between
1.3 and 1.4), and a baby boomer generation reaching the retirement age in the coming years. As reinforcing negative factors, Germany has experienced a long-term increase in unemployment and a very low effective retirement age.
Policy has responded to these developments by enacting a series of pension reforms. These reforms go mainly in two directions: first, the extension of the working life, and second, the gradual lowering of the pension level. Starting in 1992, actuarial adjustments for early retirement were introduced with a relatively long phase-in period. Furthermore, the phasing out of special early retirement options for the unemployed and women was enacted. In 2001, a small subsidized pre-funded pillar of private pensions was introduced (“Riester pension”). In 2004, the benefit indexation was changed by introducing a so called sustainability factor that takes into account the development of the ratio of contributors to the pension system and its recipients. According to the new benefit indexation rule, pensions will grow at a lower rate than wages as long as this ratio declines. In 2007, a law came into effect that increases the statutory retirement age from 65 to 67 until 2029.
Public pension benefits in Germany are closely linked to an individual’s lifetime employment and wage income relative to average wages in the economy, with relatively few redistributive elements. The Pension Benefit (PB) payment in year s after retirement is the product of four factors: the sum of Pension Points (PP) acquired at retirement age T, a
Pension Type factor (PT), an Entry Factor (EF) and the Current Pension Value (CPV). It is calculated according to the following formula:
1
,
0,1,
,
T T s t T T tPB
+PP
PT
EF
CPV
s
S
=⎛
⎞
=
⎜
⎟
×
×
×
=
⎝
∑
⎠
K
For old-age pensions PT=1, and it is less than unity for other pension types, e.g., a widow’s pension. In the following, we will only analyze old-age pensions. EF is equal to one if the age at retirement equals the statutory retirement age and lower for early retirement. For each month (year) of early retirement the benefit is lowered by 0.3% (3.6%).4
The most important component in the above formula is the sum of individual PP which mainly accrue from social security contributions levied on own wage income. Individual PP in a given year are calculated as the ratio of individual annual earnings and this year’s average of annual earnings in the whole economy, i.e. the person’s relative wage position. Thus, if a person earns the average wage in a given year she receives one PP. Earnings are only subject to social security contributions if they exceed a lower limit and contributions have to be paid only up to a higher limit. Both limits restrict the feasible number of PP to lie roughly in
4 In Section 3.3, we provide some descriptive evidence on the significance of early retirement and how we treat the retirement decision in our simulation.
the range between 0.15 and 2. Thus, the accumulation of PP depends on an individual’ wage profile relative to the evolution of average wages as well as the pattern of employment and unemployment over the life cycle.
PP may also be acquired during spells of unemployment and non-employment due to child rearing activities. For example, a mother receives one pension point for the first three years of a child born after 1992. The treatment of periods of unemployment has changed over time. Currently, short-term unemployed persons receiving the unemployment benefit (ALG I, which is insurance based and related to previous earnings) acquire PP as if earning 80% of the former gross wage. In contrast, since the recent reform in 2005 long-term unemployed receiving the new means-tested unemployment assistance payment (ALG II) acquire very little pension entitlements equivalent to a bit more than 2 € per month. This is another example of how the impact of reforms on future pensions may differ across birth cohorts.5
The Current Pension Value (CPV) in the above formula is given by:
1 1 1 1 1 2 2 2 2 " " 100 1 1 , 100 t t t t t t t t t t sustainability factor W RP CR PR CPV CPV W RP CR PR
α
− − − − − − − − − ⎛ ⎞ ⎜ ⎛ ⎞ ⎟ − − ⎜ ⎟ = × × × ⎜ − ⎟ × + − − ⎜ ⎝ ⎠ ⎟ ⎜ ⎟ ⎝ 14243 ⎠where W is the sum for gross wages in the economy, RP is the contribution rate to subsidized private and/or occupational pension schemes, CR is the contribution rate to the public pension fund, PR is the ratio of retirees to contributors to the public pension fund, and α is a weighting factor currently set to 0.25. In our base year 2005 the CPV amounted to 26.13 € in West Germany and to 22.57 €in East Germany.6
The determination of the CPV has been subject to a couple of reforms.7 The introduction of the subsidy of contributions to private pension plans (“Riester pension”) is reflected by the factor RP. This factor lowers the benefit indexation, even though the supplementary private pension is not mandatory. The contribution rate is set to increase to
5 Between 2000 and 2004, PP acquired while receiving means-tested unemployment benefits were caculated on the basis of the benefit amount and not on the prior income.
6 The lower CPV in East Germany is intended to compensate for the higher pension points given to East Germans by increasing their individual wages by an “adjustment factor” which should account for the still substantially lower level of the average wage in East Germany. Currently this adjustment factor amounts to about 18%, whereas the regional differential of average wages is about 15%. Thus, despite the lower CPV, individual pension contributions in East Germany are actually treated more generously in the pension formula than in West Germany. In our simulations we keep these regional differences in the CPV and the mentioned adjustment factor constant. 7 In this paper, we only focus on gross pensions and ignore taxation. Therefore we do not model the
4% of gross earnings until 2011 and remains constant thereafter. The 2004 reform introduced the sustainability factor which links pension growth to demographic ageing. Demographic ageing will most likely reach its peak in the 2030s which results in a growth rate of pensions that is lagging behind the growth rate of wages. This implies lower individual replacement rates on average. Due to the complex rule for the adjustment of the CPV, it’s future trajectory has to be simulated making assumptions on the changes of all factors that enter the adjustment rule (see Section 3.3).
3
Data and Microsimulation Methodology
3.1 Data
According to the pension formula discussed in the previous section, the simulation of future pension benefits requires detailed information of current individual entitlement (the number of pension points) as well as estimates of future pension accruals until retirement. The estimation of future pension entitlement would have to account for cohort effects in labor market histories, future earnings, and the individual retirement age. Since there is no data set publicly available in Germany that includes all the required information, we have to combine various data sources for the simulation of individual pension benefits. We combine data from the SOEP and administrative data of individual insurance records provided by the Research Data Center of the Public Pension Fund. SOEP data is used to estimate cohort effects in individual labor market histories which indirectly affect lifecycle wage profiles. The administrative data are used to determine pension entitlement in our base year (2005) for those individuals who can be matched to “statistical twins” observed in the SOEP data and to simulate the effective retirement age across birth cohorts.
The SOEP is a representative longitudinal micro-database that provides a wide range of socio-economic information on private households in Germany. Data were first collected on about 12,200 randomly selected adult respondents (in 6,000 families) in West Germany in 1984. After German reunification in 1989, the SOEP was extended by about 4,500 persons (in 2,200 households) from the former GDR.8 SOEP contains a detailed retrospective questionaire from which we reconstruct individual employment histories to estimate cohort effects. The data we use range from 1984-2006 for West Germany and 1990-2006 for East Germany.
SOEP data do not provide information on wages of the time before the individual joined the survey. Thus, individual pension entitlements of non-retirees for the base year 2005
simulated from retrospective work history data recorded in the SOEP are likely to contain substantial measurement error. This is a particular problem for East Germany because it does not seem feasible to back-cast wages in the former GDR based on market wages after reunification. The calculation of individual pensions in East Germany is also rendered extremely difficult due to complex regulations concerning the integration of pension entitlements from the former GDR into the unified pension system in Germany.9 Thus, the determination of individual pension entitlements in the base year for East Germans is not feasible based on SOEP data alone. Because of the complex pension legislation, to a much lesser extent this is also true for West Germany.10
We therefore match administrative information on individual pension claims in 2005 to the SOEP data. For this purpose we use the so-called insurance account sample of 2005 (“Versichertenkontenstichprobe”, VSKT 2005) of the Public Pension Fund which is a random sample of cleared individual insurance records that comprises about 60,000 observations of people aged between 30 and 67 years in 2005.11 To this end, we applied a propensity-score matching procedure (“nearest-neighbor” matching) to combine the data sets of SOEP and VSKT for 2005. The data were matched within small cells defined by age-groups, gender, region, and education. While the level of education is represented by three categories for West Germany, there are only two categories for East Germany since there are only very few people with less than secondary education. We provide some information on the matching procedure in the appendix. For each observations in the SOEP matched to a statistical twin in the VSKT data we replace the simulated amount of pension entitlement by that recorded in the latter data base. For SOEP observations for which no statistical twin could be found the simulated amount is maintained.
Finally, we use a 10% random sample (about 90,000 observations) of all new retirees in 2006 for the simulation of the age of retirement (see Section 3.3).12 After restricting the sample to old-age pensioners who retired between 60 and 65 years we are left with about 68,000 observations.
9 Himmelreicher et al. (2007) describe the integration of pension entitlements of former GDR citizens.
10 An example would be the pension rights adjustment after a divorce which occurred before the individual joined SOEP.
11 These data are provided as a scientific use file (SUFVSKT2005) by the Research Data Center of the Public Pension Fund. Detailed descriptions of the data are contained in DRV (2008) and Himmelreicher and Stegmann (2008).
12 These data are provided as a scientific use file of the so-called “Versichertenrentenzugang” (SUFRTZN06XVSBB) by the Research Data Center of the Public Pension Fund. The data are described in DRV (2006).
3.2
Estimation of cohort effects and wage equations
To link individual labor market histories to lifecycle earnings profiles, which determine the level of an individual’s future pension, we first estimate the impact of cohort effects on the cumulated duration of the various labor market states. In a second step, we estimate relative wage equations relating individual wages to labor market histories and a number of other potential wage determinants. Our maintained hypothesis is that cohort effects enter the wage equation only indirectly through their impact on an individual’s labor market history. We start with a brief description of the estimation of cohort effects in labor market histories and then describe the modeling of the wage equation.
Cohort effects
We assume that the cumulated duration in a particular labor market state, Yit*, can be modeled as a linear function of the birth cohort Kit, the individual’s age Ait, period (year) dummies Pit and a vector of other control variables, Xit :
α β
β
β
γ
′
ε
= +
+
+
+
+
* 1 2 3,
it it it t it itY
K
A
P
X
where the labor market states are full-time employment and unemployment for men, and additionally part-time employment and non-employment for women. The control variables include age of the oldest child, dummies for other children, marital status, nationality, and education. The error term ε is assumed to be uncorrelated with these variables.
Because of the linear dependence of age, period, and cohort the identification of linear cohort effects this specification requires a restriction on these effects. Here, we follow Deaton (1997) and assume that period effects are orthogonal to a linear trend and sum to zero over all observation periods.13 This assumption allows to decompose the effects in three different dimensions: the trend (cohort), the profile (age), and the business cycle (period).
Since the cumulated duration in most labor market states is zero for a non-neglible share of people, we estimate tobit models of the form:
α β β β γ ε ε σ ′ = + + + + + = * * 1 2 3 * * 2 max(0, ) , , , ~ (0, ) it it it t it it it it it it it t it Y K A P X Y Y K A P X N
13 This implies the following linear transformation of the period dummies: P
t*= Pt – (t-1)P2 + (t-2)P1, with Pt = 1 in period t, and zero otherwise. Alternative ways to identify cohort effecst using panel data are discussed in Heckman and Robb (1985), Beaudry and Green (2000), Fitzenberger et al. (2004), Alessie et al. (2005), and Boockmann and Steiner (2006).
where the original period dummies have been transformed as described above. Estimation of this equation is based on 21 waves of the SOEP for West Germany and 15 waves for East Germany spanning the period 1984-2005 and 1990-2005, respectively. People in education or already retired as well as civil servants and the self-employed are not included in the analysis. We estimate separate tobit models for each of the sub-groups defined by region (East and West German), gender, and by the level of education.
Tables A2 and A3 in the Appendix report for each of these groups estimated marginal effects of the cohort dummies on the cumulated duration in the various labor market states: These effects are evaluated at sample means of the explanatory variables in the model including age. Thus, these effects give the pure cohort effects on the cumulated duration of, e.g., unemployment at a given age. For example, for West German men with low level of education the estimated effect for the youngest cohort (1967-71) implies that, evaluated a sample means, the cumulated unemployment duration of this group exceeds that of the oldest cohort by about 2 years. Estimated cohort effects differ significantly by gender, region, and the level of education. In East Germany, for example, estimated effects imply almost 5 years more unemployment relative to the oldest age cohort for the youngest cohort of men with low or medium level of education, compared to about 2 years for those with higher education. For East German women the corresponding estimated cohort effects are about 8 years and 3 years respectively. Tables A2 and A3 also show large differences in estimated cohort effects across gender, region and level of education regarding the cumulated labor market states. The implications of estimated cohort effects for employment and unemployment over the life-cycle will be discussed in Section 4.1.
Wage equations
The dependent variable in the wage equation is the log of the ratio of the individual monthly gross wage in a given year to the average wage of the insured population in that period.14 Explanatory variables are age, the cumulated duration of unemployment and (in case of women) non-employment and part-time employment, all entered as polynomials of degree three. Since we include these as well as age the duration of full-time cannot be identified separately. Cohort effects impact on individual relative wages through their effects on the duration variables. The control variables contained in Xit include time dummies, dummies for
14 We use this uncensored wage measure in the estimation although we calculate the expected wage accounting for the censoring at the lower and upper social security thresholds in the simulations below. Using all observations avoids estimating a double-censored regression model and takes advantage of all available information in the estimation.
industry, firm size, and nationality.15 Unobserved wage determinants are modeled by the two error components ui and vit which are assumed to be independently normally distributed. The specification of the wage equation thus is:
α α α α λ ν ν ε ⎛ ⎞ = + + + + + + ⎜ ⎟ ⎜ ⎟ ⎝ ⎠ ⎡ ⎤ = ⎣ ⎦ ⎡ ⎤ = ∀ ⎣ ⎦ 0 1 2 3 log , , , 0 , , , , 0, . it it it it it i it t i it it it it it i it it it it w A U TZ X u w E u A U TZ X E A U TZ X t
This equation is estimated on a sub-sample of observations also used for the estimation of cohort effects, i.e. those people for whom we observe a wage subject to social security contributions. Civil servants and the self-employed are not included. As in the estimation of cohort effects, we estimate separate relative wage equations for each of the sub-groups defined by region, gender, and the level of education.
As shown by Figure A1 in the appendix, the empirical age-earnings profiles derived from our estimated relative wage equations differ substantially by education.16 The higher its level, the higher the individual wage relative to the average wage in the economy and, hence, the higher the acquired number of pension points. Although this relationship holds for men and women in East and West Germany throughout the life-cycle after the first few years of employment, the slope of the age-earnings profile differs markedly between these groups. Age-earnings profiles are relatively flat for persons with low or medium education and fairly steep for higher educated people. These profiles differ substantially by gender and region, however, especially for people with higher education. In West Germany, relative wages of men in this group continuously increase with age until the age of sixty and will have almost doubled by then. In contrast, higher educated women experience a steep wage increase until their early thirties followed by a reduction and a subsequent rebound in their relative wage. This pattern can be explained by the relatively weak labor force participation and a high share of part-time employed West German women in their thirties and early forties due to child-care responsibilities. Since this used to be, and still is, much less true for women in East Germany, their age-earnings profiles are, on average, similar to those of East German men. For West German men and women with low education, relative wages remain flat or
15 Industry and firm-size dummies are normalized (“orthogonalized”) so that setting them all equal to zero yields their average effect on the relative wage. This normalization is used in the simulations below to predict wages of individuals for whom we currently do not observe wages, i.e. we assume that their expected wage equals the average wage with respect to these characteristics.
16 Detailed estimation results for the relative wage equations are available from the authors upon request.
even decrease with age, and slightly increase for men with a medium level of education. In East Germany, relative wages of both men and women with low or medium education also change relatively little over the life-cycle.
On the one hand, these differences in empirical age-earnings profiles imply that people with low level of education accumulate little earnings potential over their life-cycle, in contrast to higher educated people. On the other hand, flat age-earnings profiles also imply that employment interruptions have relatively small effects on future earnings and thus the level of the public pension.
3.3
Simulating future pension levels across birth cohorts
Together with individual pension entitlements in 2005, the estimates from the previous section are used to simulate the level of individual pensions at retirement age. Note that the simulation horizon varies greatly between birth cohorts. Whereas the majority of our oldest cohort (1937-41) is already retired in 2005, and their pensions can be observed, the youngest birth cohort (1967-71) is aged 34-38 in that year and up to 33 years of their future employment/unemployment spells and earnings have to be simulated. This simulation involves various steps.
First, we project future individual work patterns on the basis of estimated labor market histories accounting for cohort effects. This projection is based on our estimated tobit models to predict for each individual in our sample unconditional expected durations in labor market state j at age t until retirement age, conditional on a set of explanatory variables Z which include cohort effects. Let this expected value be denoted by E(Yjt|Zjt). The time spent in a particular state at age t is then calculated as the difference of the expected values at age
t and (t -1) as max[0,yjt=E(Yjt|Zjt)-E(Yji,t-1|Zj,t-1)].
Second, we simulate future relative earnings for each individual in our sample based on expected values (not conditionally on employment) derived from our estimated wage equations. These simulations are based on the simulated cumulated durations derived in the previous step. For example, an individual’s expected cumulated duration of unemployment at age t determines, together with the other explanatory variables in the wage equation evaluated at that age, the individual’s expected relative wage. In addition to the mean we also simulate the variance of projected wages on the basis of the distribution of wages observed in our estimation sample.17
17 This is done by randomly drawing residuals from the distributions of the error terms u
i and vit and adding them to the simulated wages.
Third, putting together simulated future employment/unemployment durations and earnings at age t we calculate for each individual the number of pension points until her retirement age. Adding these – adjusted by the number of pension points acquired for non-employment spells – to the number of already acquired pension points in the base year 2005 yields the expected total number of pension points an individual is expected to earn until retirement. Since early retirement is still the rule rather than the exception in Germany, despite the associated substantial reduction of the pension entitlement (see Section 2.2), we have to model the future evolution of the effective retirement age.
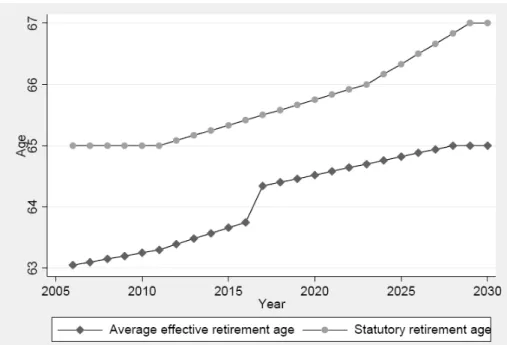
We do this in a simplified way by extrapolating the distribution of the effective retirement age of people retiring in 2006 (see Figure A2 in the Appendix) by a common factor that should reflect the recently enacted long-term increase of the statutory retirement age from 65 to 67 years (see Section 2.2).18 Since we focus on old-age pensions here, we apply the same factor to men and women and – in our base scenario – also to East and West Germany.19 Since the average effective retirement age in 2006 was about 63 years, this implies a long-term increase to 65 years in the simulation. As shown by Figure 1, the expected increase in the effective retirement age is not linear. This is due to the abolishment of early retirement options for unemployed and women, which implies a relatively strong increase in the expected retirement age of people in the birth cohorts 1947-56.
18 It is difficult to quantify the effects of the recent pension reforms effective retirment age in the distant future. Berkel and Börsch-Supan (2004) estimate that the pension reforms in 1992 and 1999 which enacted the adjustment factors for early retirement pensions have increased the average retirement age by two years for men and less than one year for women. In 2006, the average retirement age of women was actually above and that for men below the values implied by these estimates. Gender differences in changes of the retirement age could be related to the inclusion of disability pensions in these estimates. For old-age pensions, there is a clear positive trend in the effective retirement age for both men and women.
19 In the more optimistic labor market scenario for East Germany discussed in Section 4.4 below we assume that the effective retirement age converges between the two regions.
Figure 1 Adjustment of the effective to changes in the legal retirment age
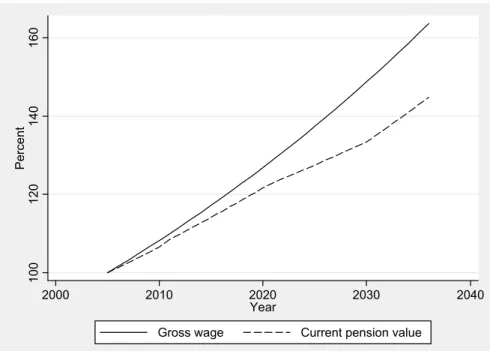
Fourth, based on the simulated individual pension points and projections of the current pension value we derive individual pension benefits. As discussed in Section 2.2, the current pension value (CPV) is determined by the growth rate of the average gross wage in the economy and some adjustment factors to the pension formula. Following the Ageing Working Group (AWG), the average real gross wage in the economy is projected to grow at an annual rate of 1.6 % (European Commission 2005). Given this projection, the CPV is calculated using the formula in Section 2.2.
Figure 2 shows the development of gross wages and the CPV in the simulation period. Due to the adjustment factors in the pension formula, there is an increasing divergence between the average gross wage and the CPV. Since population aging will peak during the 2030s, and this is accounted for in the „sustainability factor“ included in the CPV formula, the difference between gross wages and the CPV will reach a maximum towards the end of the simulation period. By then, the CPV will fall short of the average gross wage by almost 20 percentage points.
Figure 2 Development of the average gross wage and the current pension value in the simulation period 100 120 140 160 Percent 2000 2010 2020 2030 2040 Year
Gross wage Current pension value
The final step in the calculation of future public pensions is to project the population structure over the whole simulation period. Starting with a representative sample of the German population born between 1937 and 1971 we apply a “static ageing” procedure which adjusts the SOEP weighting factors to the marginal distributions of a few demographic variables derived from a household projection of DIW Berlin (see Buslei et al. 2007, pp. 29-33). These variables include the age, gender and education of the household head, region of residence, and type of household (couples/singles, with/without children). The static aging procedure uses a reweighting procedure developed by Merz et al. (2004).
4 Simulation
Results
4.1
Employment and unemployment until retirement
As described in Section 3.3, for the younger birth cohorts we have to simulate a large part of their labor market behavior until retirement. Starting from our base year 2005 and using the estimated cohort effects we simulate for each individual the cumulated employment and unemployment durations until the expected individual retirement age. In our base scenario we assume that these cohort effects estimated over a period of high and increasing unemployment, especially in East Germany, also determine future labor market behavior across birth cohorts. In the following simulation of the cumulated employment and unemployment durations the individual retirement age differs across age cohorts but is
assumed to be determined by the current legal retirement age of 65 years. This assumption will be relaxed when we simulate the level of pension benefits below.
Table 2 summarizes our simulation results for full-time employment and unemployment by region, gender and the level of education.20 Simulation results for cohorts refer to future populations in the year of retirement. They are derived using the method of static aging to adjust SOEP weighting factors to account for demographic change (Section 3.3). Differences in simulation results across birth cohorts thus not only represent pure cohort effects but also structural changes in the population across cohorts.21
Table 2 Simulated years of cumulated employment/unemployment durations until retirement
West Germany East Germany
Full-time
employment Unemployment Full-time employment Unemployment Education level: Low Medium High Low Medium High Low/Medium High Low/Medium High
Men Cohort 1937-41 39.1 40.9 35.2 3.7 1.7 0.8 40.4 37.2 2.3 1.4 Cohort 1942-46 38.6 39.4 34.3 4.0 2.1 1.3 39.4 36.5 3.6 2.1 Cohort 1947-51 36.4 38.9 33.6 4.6 2.6 1.5 38.7 34.5 4.6 2.9 Cohort 1952-56 37.4 39.0 33.4 5.4 2.7 1.8 37.9 33.7 6.1 3.0 Cohort 1957-61 36.4 37.4 32.8 6.6 3.2 2.2 36.2 33.2 7.9 3.9 Cohort 1962-66 35.3 36.4 33.7 8.2 3.1 2.0 36.1 32.3 8.0 4.1 Cohort 1967-71 36.5 37.6 32.2 7.2 3.4 2.0 35.7 31.3 9.4 5.2 Average 37.3 38.9 33.5 5.2 2.6 1.7 37.6 34.3 6.2 3.1 Women Cohort 1937-41 15.5 15.5 17.4 1.0 0.7 0.5 30.6 34.8 3.1 1.8 Cohort 1942-46 14.9 16.5 18.7 1.2 0.9 0.7 31.2 32.9 5.4 3.0 Cohort 1947-51 16.0 17.0 19.7 1.7 0.9 1.0 30.5 33.1 6.9 3.8 Cohort 1952-56 16.1 16.5 19.1 2.2 1.1 1.4 29.1 32.4 8.9 4.4 Cohort 1957-61 15.5 16.2 18.7 2.6 1.2 1.3 28.4 31.5 9.9 4.8 Cohort 1962-66 14.5 16.0 19.1 2.9 1.5 1.3 26.3 28.8 11.5 6.4 Cohort 1967-71 14.0 16.6 19.8 3.2 1.1 1.0 24.0 26.6 13.3 7.0 Average 15.2 16.4 19.1 2.1 1.1 1.1 28.4 31.3 8.9 4.7
Notes: Cumulated durations at the time of retirement under the assumption the legal retirement age is 65 years.
Simulation results derived using SOEP weighing factors and static aging to forecast future population structure.
Source: SOEP, SUFVSKT2005, own calculations.
Simulation results for West German men show that the cumulated duration of employment in the younger birth cohorts declines by about 3 years relative to the oldest cohort, and that this
20 To save space, we focus on these two states here. Simulation results for part-time employment and non-employment of women are reported and discussed in Steiner and Geyer (2009).
decline is similar for all education groups. Differences related to the level of education are more pronounced regarding changes in the cumulated duration of unemployment across birth cohorts: For people with low education it almost doubles from about 3.7 years in the oldest birth cohort to 7.2 years in the youngest cohort. Although the relative change across birth cohorts is similar for the other two education groups, the youngest birth cohort of West German men with medium education accumulate only about 3 years, those with higher education 2 years unemployment until retirement.
For West German women, changes in the cumulated duration of full-time employment across birth cohorts differ by the level of education. In the low education group it falls from 15.5 years in the oldest cohort to 14 years in the youngest, for women with medium or higher education full-time employment increases in the younger birth cohorts. Changes in the cumulated duration of unemployment across cohorts also differ by the level of education, although the younger cohorts accumulate somewhat more unemployment over their life-cycle than the older cohorts in all education groups. Note that the low average level of unemployment, relative to both West German men and especially East German women, is related to the much greater importance non-employment spells, often related to child-rearing activities, have for West German women.22
In East Germany, younger male birth cohorts experience a dramatic decline in employment and increase in unemployment durations. In the group with low or median education, the simulated duration in full-time employment from about 40 in the oldest to less than 36 years in the youngest cohort, in the high education group from about 37 to 31 years. Correspondingly, the simulated duration of unemployment in the group of persons with low or medium education soars from about 2 years in the oldest to more than 9 years in the youngest birth cohort. Unemployment also rises sharply for East German men with higher education, 1.4 years in the oldest to more than 5 years in the youngest birth cohort. This clearly shows the long-term consequences of the catastrophic labor market situation in East Germany.
Even worse seems the likely evolution of employment and unemployment for younger birth cohorts of East German women. The simulated duration of full-time employment falls 21 Changes in the simulated cumulated employment and unemployment durations between cohorts
therefore differ from estimated cohort effects as reported in Tables A2 and A3 in the Appendix. 22 The cumulated duration of non-employment of West German women has declined across birth
cohorts in all education groups. For example, in the high education group non-employment duration is estimated to decline from 14 years to about 11 years. In contrast, non-employment of East German women in the high education group is expected to increase slightly across cohorts, although starting from a very low level of less than 2 years (see Steiner and Geyer 2009, Chapter 4.3.1).
from more than 30 years in the oldest to 24 years in the youngest cohort for women with low or median education, and from almost 35 years to less than 27 years in the high education group. The cumulated duration of unemployment of East German women with low or median education more than quadruples from about 3 years in the oldest to about 13 years in the youngest cohort. The increase in unemployment across birth cohorts is also substantial for the high education group for whom the simulated duration increases to 7 years in the youngest cohort. This dramatic increase of female unemployment can only partly be related to differences in non-employment between East and West Germany.
4.2
The effects of pension reforms on the average pension level
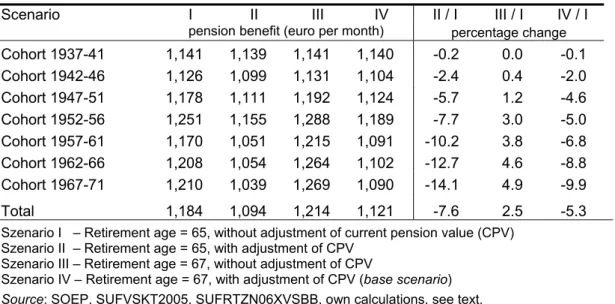
The introduction of the demographic adjustment factor in the pension formula and the phasing-in of a higher statutory retirement age described in Section 2.2 will have heterogeneous effects on individual pension levels across birth cohorts. While the pension reductions due to the adjustment factor will be larger for younger birth cohorts, the effects of the increase of the statutory retirement age will depend on the adjustment of the effective retirement age across birth cohorts. In the following we assume that the effective retirement age adjusts to the increase in the statutory retirement age from 65 to 67 years as described in Section 2.2, i.e. will also increase by two years over the phase-in period. To get an impression on the relative impact of these two policy reforms, Table 3 presents simulated pension benefits23 for four alternative scenarios for West German men. In the first two scenarios the statutory retirement age is kept at 65 while the adjustment factor is introduced in Scenario I but not in Scenario II. This latter difference also distinguishes Scenario III and
Scenario IV which also allow for the legislated increase in the statutory retirement age. We present these calculations for West German men, for whom we do not find large cohort effects in employment and unemployment durations. This allows us to abstract from cohort effects in employment histories and disentangle the reform effects in a simple way. For the other groups we document simulation results in Table A6 in the appendix.
The relative stability of employment histories across cohorts is reflected by the stability of pension benefits across cohorts under the Scenario I. In the absence of reforms, the pension benefit remains well above 1000 € per month for all cohorts. This changes when the legislated slower growth rate of the current pension value due to the demographic
23 As we do not model income taxation in this paper, all pension benefits are gross amounts. However, we do substract pensioners’ own contribution to the health and long-term care insurance. That is, here and in the following we report the effective amount of pension payment (“Rentenzahlbetrag”) in the terminology of the German pension insurance.
sustainability factor is allowed for. In Scenario II, the pension level of younger cohorts declines relative to the oldest cohort. As expected and shown by the relative change in the pension benefit under Scenario I and Scenario II, the negative impact of the introduction of the adjustment factor is the bigger, the younger the age cohort. The youngest two age cohorts have to bear a reduction in the pension benefit of 13-14 percent due to this adjustment factor, compared to an average reduction across all cohorts of less than 8 percent.
Table 3 Impact of pension reforms on the average pension benefit by birth cohort – West German men
Scenario I II III IV II / I III / I IV / I pension benefit (euro per month) percentage change Cohort 1937-41 1,141 1,139 1,141 1,140 -0.2 0.0 -0.1 Cohort 1942-46 1,126 1,099 1,131 1,104 -2.4 0.4 -2.0 Cohort 1947-51 1,178 1,111 1,192 1,124 -5.7 1.2 -4.6 Cohort 1952-56 1,251 1,155 1,288 1,189 -7.7 3.0 -5.0 Cohort 1957-61 1,170 1,051 1,215 1,091 -10.2 3.8 -6.8 Cohort 1962-66 1,208 1,054 1,264 1,102 -12.7 4.6 -8.8 Cohort 1967-71 1,210 1,039 1,269 1,090 -14.1 4.9 -9.9 Total 1,184 1,094 1,214 1,121 -7.6 2.5 -5.3
Szenario I – Retirement age = 65, without adjustment of current pension value (CPV) Szenario II – Retirement age = 65, with adjustment of CPV
Szenario III – Retirement age = 67, without adjustment of CPV
Szenario IV – Retirement age = 67, with adjustment of CPV (base scenario)
Source: SOEP, SUFVSKT2005, SUFRTZN06XVSBB, own calculations, see text.
Due to the slow phase-in of the statutory retirement age, which reaches 67 years only in 2029, the largest effects of this policy change occur for the two youngest birth cohorts. As shown by the relative change in the pension value under Scenario III and Scenario I in Table 3, the extension of the working life reduces the effect of the lower pension growth for the two youngest birth cohorts by almost 5.
Comparing the evolution of pension benefits across birth cohorts under Scenario III and Scenario IV shows that the assumed adjustment of the effective retirement age to the increased statutory retirement age partly compensates for the slower CPV growth rate. As shown by the column referring to Scenario IV, the net effect of these two policy changes is a fairly stable level of pension benefits of West German men across birth cohorts. However comparing this scenario to the one without adjustment of the pension formula and increase of the retirement age (Scenario I) reveals that the pension benefit is reduced by almost 10 percent for the youngest birth cohort, compared to an average reduction of only about 5 percent across all cohorts.
4.3
The level and distribution of pension benefits in the base scenario
Our simulation results on the level and distribution of pension benefits across birth cohorts presented in this section refer to Scenario I which includes the already legislated changes concerning the adjustment factor and the increase of the statutory retirement age. In general, we report pension benefits at the individual retirement age. In the case of two-person households, the simulations refer to the date when both spouses are retired. All pension benefits are discounted by the growth rate of real wages to make them comparable across birth cohorts. Due to the lower growth rate of pension benefits relative to wages the current pension value for younger birth cohorts will decline, although pension benefits will continue to grow in real terms. The sample is restricted to persons who were not civil servants or self-employed in the base year 2005. This restriction excludes very low pensions resulting from brief employment spells under the social security system, e.g. of persons who acquired pension entitlements at the beginning of their career but subsequently became civil servants. The analysis is restricted to own pensions derived from the public pension scheme which are by far the most important source of income in old age for the great majority of the population.
Average pension levels and replacement rates
Table 4 shows remarkable differences in the amount and the replacement rate of individual gross pension benefits stratified by cohort, gender, and region. The replacement rate is defined as the ratio of the amount of the pension benefit to the average gross wage in East and West Germany, respectively.24
Compared to all other groups, West German males across all birth cohorts can expect to receive the highest pension benefits. The slight negative trend in this group’s pension benefit across birth cohorts is, as analyzed in the previous section, mainly driven by the lower CPV growth rate due to the demographic adjustment factor. The youngest cohorts receive a pension that is still about 95 percent of the pension of the oldest cohort. The gross replacement rate of West German men hovers in the youngest birth cohort still reaches about 45 percent and is only 2 percentage points less than the replacement rate of the oldest cohort.25
The own pension received by women is, on average across all birth cohorts, less than half the amount received by men in West Germany. On average, their pension benefit is less
24 The average monthly gross wage in 2005 was 2,433 € in West Germany and 2,057 € in East Germany. We use regional wages to account for differences in the cost of living the economy. 25 Note that this replacement rate links the individual pension amount and the average monthly gross
than the one received by women in East Germany. In contrast to all other groups, however, the pension benefit received by younger cohorts of West German women is substantially higher than that obtained by the older cohorts. This is the more remarkable as the older cohorts are not affected by the demographic CPV adjustment and shows the importance of the increasing labor market attachment of younger women in West Germany. Still, the youngest cohort of West German women reaches a replacement rate of only 24 percent.
Table 4 Pension benefits and replacement rates across birth cohorts by region and gender
West Germany East Germany
Cohort Average Men Women Men Women
Pension benefit (€ per month)
1937-41 863 1,140 449 886 646 1942-46 810 1,104 540 996 720 1947-51 808 1,124 544 898 792 1952-56 812 1,189 560 804 708 1957-61 765 1,091 542 680 706 1962-66 804 1,102 606 663 592 1967-71 770 1,090 591 594 466 Average 804 1,121 554 801 680 Replacement rate (in percent)
1937-41 36.4 46.8 43.1 18.5 31.4 1942-46 34.8 45.4 48.4 22.2 35.0 1947-51 34.5 46.2 43.7 22.4 38.5 1952-56 34.8 48.9 39.1 23.0 34.4 1957-61 32.7 44.8 33.1 22.3 34.3 1962-66 34.0 45.3 32.2 24.9 28.8 1967-71 32.3 44.8 28.9 24.3 22.6 Average 34.2 46.1 39.0 22.8 33.0
Notes: The sample is restricted to persons who were not civil servants or self-employed in the base
year 2005. The replacement rate is the ratio of the monthly pension benefit to the average monthly gross wage in East and West Germany, respectively.
Source: SOEP, SUFVSKT2005, SUFRTZN06XVSBB, own calculations.
Looking at simulation results for East Germany, the evolution of pension benefits across birth cohorts looks much different. Whereas the average pension benefit of East German women is almost 700 € per month, and thus more than 100 € above the amount obtained by women in West Germany, it is only 466 € for the youngest birth cohort. This is only about 70 percent of the pension benefit received by the oldest cohort of women in East Germany. As shown in the previous section, about 10 percentage points are due to the net effect of the demographic adjustment factor and the increase in the retirement age. Thus, about 20 percent of the reduction of the pension benefit in the youngest age cohort of East German women would be related to increased unemployment and lower wages.
For East German males the development is even more dramatic. Whereas East German men in the oldest birth cohort reach a pension benefit of about 900 €, birth cohorts 1952-6 and younger have to expect a substantially smaller amount. The pension benefit of the youngest birth cohort of a bit less than 600 € is only two third of the amount received by the oldest cohort of East German men. The youngest birth cohort was about to enter the labor market when the wall came down and was especially hard hit by the catastrophic development of the East German labor market.
The distribution of individual pension benefits
Table 5 shows how individual pension benefits are distributed across birth cohorts. To have a sufficient number of people in each income class, which we group by intervals of 300 €, we have pooled birth cohorts. The upper part of the table contains the distribution of pension benefits across all birth cohorts, the middle part for cohorts born 1937-1951, and the lower part for cohorts born 1952-1971.
Table 5 Distribution of pension benefits across birth cohorts by region and gender, shares in percent
West Germany East Germany Income class (in €) Total Men Women Men Women
Cohorts 1937-71 0-300 7.8 0.1 18.0 0.2 1.9 301-600 23.6 2.3 40.1 19.6 36.7 601-900 30.7 19.4 32.4 49.1 46.2 901-1200 23.4 42.9 8.0 25.9 13.5 1201-1500 9.9 23.2 1.5 4.6 1.6 1501+ 4.6 12.1 0.1 0.6 0.0 Cohorts 1937-51 0-300 11.5 0.3 27.7 0.4 2.6 301-600 18.4 2.4 36.5 3.5 22.7 601-900 27.8 20.9 23.2 45.5 54.1 901-1200 25.6 40.3 9.6 39.7 18.8 1201-1500 11.3 23.2 2.7 9.5 1.8 1501+ 5.3 12.9 0.3 1.4 0.0 Cohorts 1952-71 0-300 5.0 0.0 11.2 0.0 1.4 301-600 27.5 2.3 42.6 31.4 46.6 601-900 32.9 18.1 38.8 51.8 40.7 901-1200 21.7 45.0 6.8 15.7 9.8 1201-1500 8.9 23.2 0.7 1.0 1.5 1501+ 4.1 11.4 0.0 0.0 0.0
On average across all cohorts, more than 40 percent of all pension benefits of West German men are in the income category 901-1200 €, while almost 50 percent of all men in East Germany obtain pensions between 601 and 900 Euro. The share of pensions exceeding 1200 Euro per month is neglible for women. For men in East Germany, the share of pensions exceeding 1200 Euro drops form about 10 percent among the older to almost zero in the younger cohorts. In contrast, about a third of all men in West Germany obtain relatively high pensions, and this share changes little between the older and younger age cohorts.
From a policy perspective, the share of pension benefits below 600 € is important because this amount is close to the average means-tested subsistence level for single pensioners (“Grundsicherung im Alter”).26 A single pensioner with an income below that threshold would be entitled to receive social assistance up to that limit by the state. Since we focus on individual pensions and do not take into account other household incomes we can, of course, make no strong statements concerning poverty issues. Still, the extent to which own old-age pensions lift the retired out of poverty is of substantial interest for social policy.
Whereas the share of West German men receiving pensions below 600 Euro is less than 3 percent even among younger age cohorts, one out of three East German men in the younger birth cohorts will receive a pension below this amount. While this share will change little in West Germany, it will increase dramatically from about 4 to more than 30 percent in East Germany. The already high share of low pensions among East German women will roughly double, from about 25 percent in the older to almost 50 percent in the younger cohorts. The share of low pensions is even higher among West German women, although it is expected to fall slightly from about 60 in the older to 55 percent in the younger cohorts.
The distribution of pension benefits by the level of education
The distribution of pension benefits in the total population disguises important differences by the level of education which is one of the major factors shaping life-time earnings. Thus, to shed some light on these differences, Table 6 reports means and percentiles of pension benefits for the birth cohorts 1952-71. We focus on the younger cohorts here to save space and, more importantly, because in these cohorts the share of people with low pensions is expected to be extremely high, especially in East Germany.27
Looking first at the simulation results for West German men, the group with relatively high average pensions, Table 6 reveals that for about a fourth of all people in the group with
26 The Federal Statistical Office reports an average gross amount of 627 € in 2006 for individuals aged 65 and older (DESTATIS 2008).
a low level of education the expected pension benefit is below 660 €, and thus only marginally higher than the minimum pension. Even the median pension of 740 Euro for this group is only 100 € above the minimum pension. The distribution of pension benefits among East German men with low or medium education is similar as for West German men with low education, although the median is even a bit smaller. Compared to West German men with medium education, pension benefits in East Germany are substantially smaller at all percentiles of the distribution.
Table 6 Distribution of pension benefits by level of eduction, cohorts 1952-71 means and percentiles (in € per month)
Percentile
Education level Mean 5 10 25 50 75 95
Men West Low 761 526 571 657 742 821 1,091 Medium 1,079 765 826 935 1,046 1,207 1,506 High 1,281 833 956 1,073 1,253 1,504 1,747 Total 1,121 688 784 930 1,089 1,290 1,652 Men East Low/Medium 746 477 514 600 719 881 1,062 High 908 550 596 716 886 1,073 1,315 Total 801 489 535 626 784 940 1,206 Women West Low 350 211 230 268 309 376 638 Medium 569 230 266 387 571 707 987 High 640 244 328 444 636 808 1,101 Total 554 223 261 348 527 709 1,020 Women East Low/Medium 608 319 398 503 603 700 902 High 790 478 527 604 751 955 1,182 Total 680 362 443 549 640 792 1,105 Overall total 804 268 332 533 767 1,044 1,481
Notes: Percentiles refer to the individual pension benefit.
Source: SOEP, SUFVSKT2005, SUFRTZN06XVSBB, own calculations.
As shown by Table 6, the picture is much different for women. Pension benefits of West German women with low education are very small: The median in the younger age cohorts is only a little more than 300 €, and even the 95 percentile is only a modest amount of 640 Euro, which exactly amounts to the current value of the minimum pension. These very 27 As already mentioned in Section 3.1, we had to aggregate low and medium levels of education