Original article
An enhanced topologically significant directed random walk in cancer
classification using gene expression datasets
Choon Sen Seah
a, Shahreen Kasim
a,⇑, Mohd Farhan Md Fudzee
a, Jeffrey Mark Law Tze Ping
a,
Mohd Saberi Mohamad
b, Rd Rohmat Saedudin
c, Mohd Arfian Ismail
da
Soft Computing and Data Mining Centre, Faculty of Computer Sciences and Information Technology, Universiti Tun Hussein Onn, Malaysia b
Faculty of Creative Technology and Heritage, Universiti Malaysia Kelantan, Karung Berkunci 01, 16300 Bachok, Kelantan, Malaysia c
School of Industrial Engineering, Telkom University, 40257 Bandung, West Java, Indonesia
dFaculty of Computer Systems and Software Engineering, Universiti Malaysia Pahang, Pahang, Malaysia
a r t i c l e i n f o
Article history:
Received 21 September 2017 Revised 8 November 2017 Accepted 9 November 2017 Available online 20 November 2017
Keywords:
Directed random walk algorithm Group specific tuning parameter Pathway
a b s t r a c t
Microarray technology has become one of the elementary tools for researchers to study the genome of organisms. As the complexity and heterogeneity of cancer is being increasingly appreciated through genomic analysis, cancerous classification is an emerging important trend. Significant directed random walk is proposed as one of the cancerous classification approach which have higher sensitivity of risk gene prediction and higher accuracy of cancer classification. In this paper, the methodology and material used for the experiment are presented. Tuning parameter selection method and weight as parameter are applied in proposed approach. Gene expression dataset is used as the input datasets while pathway data-set is used to build a directed graph, as reference datadata-sets, to complete the bias process in random walk approach. In addition, we demonstrate that our approach can improve sensitive predictions with higher accuracy and biological meaningful classification result. Comparison result takes place between signifi-cant directed random walk and directed random walk to show the improvement in term of sensitivity of prediction and accuracy of cancer classification.
Ó2017 The Authors. Production and hosting by Elsevier B.V. on behalf of King Saud University. This is an open access article under the CC BY-NC-ND license (http://creativecommons.org/licenses/by-nc-nd/4.0/).
1. Introduction
Early detection is one of the key elements in the reduction of mortality rate among disease carriers. The accurate determination type of cancer provides adequate early treatment and also to make sure that the treatment is efficient. For example, early malignant pleural mesothelioma is optimally treated by extrapleural pneu-monectomy followed by radiochemotherapy, whereas metastatic lung cancer is cured by chemotherapy only (Kirk, 2007). Anticancer strategies are build based on tumor morphology (morphogenesis). As technology grows, many researchers executed various inves-tigations on the gene expression patterns and studied the gene mutation (Shao et al., 2011; Fahey, 2010). Microarray has been
an experimental tool to extract functional information from the genome (Bair, 2013). In recent years, many researchers used microarray to profile the gene expression patterns of abnormal and normal gene in cancer (Srivastava et al., 2014; Lin et al., 2016). These kinds of studies shed light on obtaining bio-markers for cancer classification. Cancer classification enable doctors to get some insights about gene expression patterns such as gene function and interaction between genes.
Microarray has been adopted to profile gene expression data-sets, and, applied in cancer classification. The success rate of cancer classification on the tools is largely dependent on data mining (Young, 2016). This is because, among gene expression datasets, only a part gives significant expression levels towards cancer. Therefore, a classification tools that can identify cancerous genes with high accuracy is needed. There are several types of cancer pre-diction and cancer classification approach (Young, 2016; Malla, 2017).
In recent years, the random walk algorithm has been used by several researchers (Revathy and Amalraj, 2011; Li and Li, 2012; Petrochilos et al., 2013; Lan et al., 2016; Matteo and Random, 2017) to enable a more efficient process of cancer classification.
https://doi.org/10.1016/j.sjbs.2017.11.024
1319-562X/Ó2017 The Authors. Production and hosting by Elsevier B.V. on behalf of King Saud University. This is an open access article under the CC BY-NC-ND license (http://creativecommons.org/licenses/by-nc-nd/4.0/).
⇑Corresponding author.
E-mail address:[email protected](S. Kasim). Peer review under responsibility of King Saud University.
Production and hosting by Elsevier
Contents lists available atScienceDirect
Saudi Journal of Biological Sciences
In 2011, Revathy studied the usage of random walk in the improve-ment of cancer classification accuracy (Revathy and Amalraj, 2011). Through a multi-directed graph, the Random Walk with Restart on Multigraphs (RWRM) that was introduced by Li is able to identify gene with higher area under curve (AUC) value (Li and Li, 2012). Petrochilos introduced the Walktrap which is a random-walk-based community detection algorithm to identify biological modules predisposing to cancer growth in gene expres-sion datasets (Petrochilos et al., 2013). Bi-random walk, proposed by Lan in 2016, is used to identify potential miRNA environmental factor interaction (Lan et al., 2016). In 2017, random walk with restart probability was introduced by Matteo, has the ability to rank cancerous gene with respect to cancer modules (Matteo and Random, 2017).
By using directed graphs to represent the random walk, the probability of random walk is no longer 0.5 for both, the forward and backward step (Suki and Frey, 2017), and has instead, a bias probability of random walk which comes from a present walker that establishes a potential direction. When the bias is small, the walk exhibits a positive asymptotic speed in the bias direction, while when the bias become large, the walk starts spending huge amounts of time in bias, and constant direction before eventually backtracking and continuing march off to infinity (Yano, 2011). Hence, the results for every experiment no longer fluctuates broadly due to a more systematic use of random walk with a bias probability.
In Codling’s research, he derived a biased telegraph equation from different turning probabilities which, is applied based on direction of the movement (Codling et al., 2008). A similar analogy is extended by Zlatic´, through his research, whereby the paramet-ric equations of motion is applied to study the features of biased random walks versus parameter values (Zlatic et al., 2010). In 2013, Liu developed the directed random walk to great effect, which is based off a biased type random walk (Liu et al., 2013). Due to limitation of the algorithm, directed random walk algo-rithm is not focusing on enhanced the sensitivity of prediction. Besides, the accuracy of cancer classification can be further enhanced. This model was developed to classify the cancer gene by the implementation of a directed graph. The DRW proved to be a success in classifying cancer genes by instigating an initial node as well as the restart the probability when the vector drops to a certain value. Hence, a proposed method for efficient cancer classification is the significant directed random walk which, is the enhancement of the directed random walk.
In this study, we considerably extend our preliminary work (Seah et al., 2017). The restart probability parameter in directed random walk (Revathy and Amalraj, 2011) is being studied and improvement is being considered by expanding the initial param-eters of the directed random walk, taking the weight of each bio-logical pathways and their relationship with genes into account. The sensitivity of prediction is enhanced by enhanced the bond between two genes within the gene expression data.
The restart probability parameter is tuned in the range of 0.1–0.9 in order to justify the optimum and most suitable restart probability for the corresponding datasets. Datasets are divided into training and test set by K-fold cross validation. Classifier is built and experimented to justify the results of classification. The reliability of the classifier is proved through the accuracy of cancer classification. With lung cancer dataset used as the benchmark dataset, its implementation in the directed random walk is anal-ysed (Liu et al., 2013). The results are then compared with previous works. The contribution of this approach are lies as below:
We test the tuning parameter selection method with more datasets.
We improve directed random walk by implementation of
weight as parameter.
We provide the detailed analysis of the proposed significant directed random walk through extended experiments, which conducted with six gene expression datasets.
We report statistically significant results by comparison with previous work.
In Section 2, we present the datasets that used during the experiment and the details of the methodology of proposed approach in. In Section3, we present the results and discussion of cancer prediction and cancer classification. Lastly, we draw the conclusion in Section4.
2. Materials and methods 2.1. Experimental data
The proposed algorithm, significant directed random walk, is tested with six different input datasets and a group of reference datasets. The input datasets are briefly described in Section2.1.1, while the reference datasets are presented in Section2.1.2. 2.1.1. Input datasets
The purpose of the experiment is to evaluate the effectiveness of the significant directed random walk (sDRW) approach in six publicly available gene expression datasets. These datasets are obtained from the web-based database of National Centre for Biotechnology Information (NCBI), Gene Expression Omnibus (GEO). GEO database stores original submitter-supplied records as well as curated datasets. These datasets are briefly described as follows:
1. Lung Cancer Dataset (Landi et al., 2008): The GEO ID of the cho-sen lung cancer dataset is GSE10072. It consists of 107 samples, which 58 are cancer, while 49 are normal tissues samples. These samples were collected from 20 non-smokers, 26 former smokers and 28 current smokers. The platform to prepare the affymetrix microarray gene expression dataset is GPL96. The ID of the samples falls from between GSM254625 until GSM254731.
2. Liver Cancer Dataset (Tsuchiya et al., 2010): The GEO ID of cho-sen liver cancer dataset is GSE17856. It consists of 95 samples but only 87 samples are chosen as sample datasets. Out of these 87 samples, 43 are cancer samples and 44 are normal samples. These 87 samples are Hepatocellular Carcinoma tissue samples while the remaining 8 samples are metastatic liver cancer sam-ples. The cancer cells found in metastatic liver cancer are not liver cells because they are migrants from other parts of the body (Roessler et al., 2015). The platform to prepare the affyme-trix microarray gene expression dataset is GPL6480. The ID of samples that is used in the experiment are from GSM446165 to GSM446251.
3. Thyroid Cancer Dataset (Yu et al., 2008): The GEO ID of chosen thyroid cancer dataset is GSE5364. This dataset consists of sev-eral cancer types but only the thyroid cancer dataset is chosen as the sample dataset. Out of 341 samples, 51 are related to thy-roid dataset which are 35 cancer samples and 16 normal sam-ples. The platform to prepare Affymetrix microarray gene expression dataset is GPL96. The ID of thyroid samples are between GSM121979 and GSM122029.
4. Stomach Cancer Dataset (D’Errico et al., 2009): The GEO ID of chosen stomach cancer dataset is GSE13911. It is a dataset that mainly focuses on Microsatellite Instability (MSI) and Microsatellite Stable (MSS) issues which resulted DNA
Mismatch Repair gene, does not function normally. This dataset consists of 38 cancer samples and 31 normal samples. It is pre-pared with the Affymetrix Human Genome U133 plus 2.0 Array, with platform ID of GPL570. The samples ID are between GSM350411 and GSM350479.
5. Kidney Cancer Dataset (Dalgliesh et al., 2010): The GEO ID of chosen kidney cancer dataset is GSE17895. It focuses on Renal Cell Carcinoma which is also known as kidney cancer that orig-inates in the lining of proximal convoluted tubule (small tubes in the kidney that transport urine) (Gaur et al., 2017). It consists of 138 cancer samples and 22 normal samples. It is prepared with Affymetrix GeneChip Human Genome U133 Plus 2.0 Array with platform ID of GPL9101. The samples ID are between GSM444445 to GSM444610.
6. Breast Cancer Dataset (Pawitan et al., 2005): The GEO ID of cho-sen breast cancer dataset is GSE1456. It was prepared on two different Affymetrix platform, GPL96 and GPL97. The results from GPL96 will be used as the input dataset which are 22 poor samples and 130 good samples. Breast cancer patients who died within 5 years are considered poor samples while those patients that can survive more than 5 years without any addi-tional reported events are consider as good samples. The sam-ples ID within GPL96 are GSM107072 until GSM107231. 2.1.2. References datasets
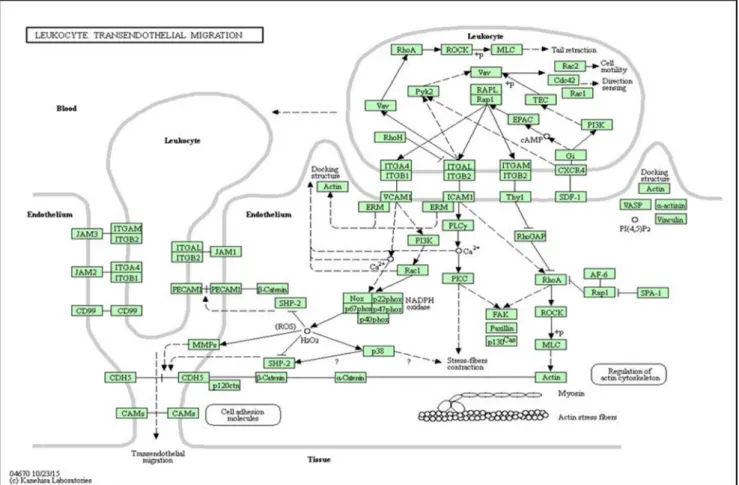
References datasets are also known as additional datasets that supports the experiments. In the experiment of the proposed sig-nificant directed random walk, directed graphs are used as the ref-erence data. These directed graphs are built from 300 pathway datasets.Fig. 1shows the example of pathway dataset, Leukocyte Transendothelial Migration (KEGG PATHWAY, 2017). This directed
graph consists of 150 metabolic and 150 non-metabolic pathways. The pathway datasets were obtained from Kyoto Encyclopedia of Genes and Genomes (KEGG) Pathway Database.
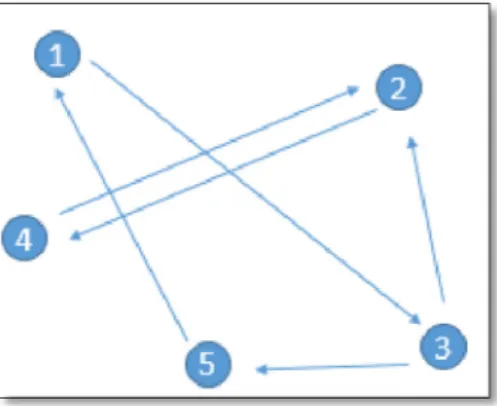
KEGG pathways are converted into directed graph using Sub-pathwayMiner package in R programming (Li et al., 2009). This directed graph covers 4113 nodes (genes) and 40875 directed edges. The directed edge represents the interaction between genes. The interaction between genes can be found from the pathway datasets.Fig. 2 shows a simple illustration of a single pathway from a complete pathway dataset whereby the influence of a par-ticular gene onto a corresponding gene is represented by the direc-tion of the arrowheads. Gene A influences gene B, while gene B influences gene C. Gene C influences both genes E and D, which, both, influence gene F.Fig. 3displays the illustration of the influ-ence between genes. In graph theory, eigenvector centrality is used to measure the influence of node in a network (Meghanathan, 2015).Fig. 4shows the illustration of the significance of genes per-taining to their weights. The weight of each gene is determined by the number of corresponding genes connected. The higher the number of corresponding gene connected, the heavier the weight of the gene, the higher its significance. Thus, gene C is regarded as highly significant, compared to gene A and B.Fig. 5shows the highlighted genes in single pathway and their weights inTable 1. The red highlighted genes, EPAC, Rap1, ITGAL, Pyk2, Vav, RhoA shows a simple pathway within the biological pathway, Leukocyte Transendothelial Migration (KEGG PATHWAY, 2017). These six genes are used to show the relationship between connection and weight. The highest weight, 11.38365 belongs to gene, Vav, which is activated by two different genes (ITGAL and Pyk2), as shown in Fig. 5. A gene is important if it play the roles in being influences by other genes (Draghici et al., 2007).
2.2. Methodology
This section contains the approaches in constructing significant directed random walk. In order to improve existing biased random walk (directed random walk), directed random walk has been studied and tested. According to Liu, in his studies (Liu et al., 2013), the restart probability was set as 0.7. In sDRW, restart prob-ability has been tuned with a range of 0.1–0.9. After several exper-iments, more risk pathways have been predicted and the results of the experiments shows improvement towards the sensitivity of cancer prediction and accuracy of cancer classification. Another approach in the construction of the sDRW looks to the relevance of weight in determining the significant level towards cancerous mutation, as was utilized by Playdon (Playdon et al., 2013). The relationship of weight between two nearest genes in a pathway has been used as a key parameter to differentiate the cancerous gene and normal gene. Hence, the tuning parameter selection and weight as parameter for algorithm performance optimization will be implemented into the sDRW to enable result enhancement, which are, the sensitivity of cancer prediction and accuracy of can-cer classification.
2.2.1. Significant directed random walk (sDRW)
Significant directed random walk (sDRW) is an improved biased random walk that is used in cancerous gene prediction and classi-fication. This approach makes specific hypotheses about the pre-dictive significance of relative gene expression by providing a range of restart probability in different cancer datasets. Although such approach may not represent the accuracy of every datasets, it shows the optimum accuracy of different datasets with different restart probabilities. The second approach in sDRW implements weight as one of its parameter. The weight of genes is different which is dictated by the influence by previous genes. If the gene is influenced by many genes, represented by the direction of arrowheads, it will have higher weight compared to the rest. Fig. 6illustrates the whole structure of sDRW.
2.2.1.1. Tuning parameter selection. During preliminary work, the tuning parameter selection is used in the directed random walk algorithm (Seah et al., 2017). Directed random walk algorithm might excluded some informative genes in selected pathway due to the limitation in single, constant restart probability. With only a single, constant restart probability, the optimum results cannot be obtained. This is because different datasets have different pat-tern of pathways. For example, cancer datasets, A and B have dif-ferent variety of biological pathways and these biological pathways play an important role in determining cancerous genes. Therefore, the tuning parameter selection is proposed in significant directed random walk in order to find out the optimum restart probability for the corresponding cancer datasets.
Tuning parameter selection is aimed to estimate the nearby optimum parameter for pathway (Misman et al., 2014). It is also used to identify an effective predictive model and cancerous clas-sification. Therefore, tuning parameter selection can lead to better performance of sDRW compare to DRW.
Directed random walk algorithm is using a constant restart probability,r, also known as gamma (Liu et al., 2013). Restart prob-ability plays an important role in determining the needs of restart-ing the random walk process. In significant directed random walk,
Fig. 2.Simple illustration of single pathway data.
Fig. 3.Simple illustration of the relationship between genes.
Fig. 4.Simple illustration of relationship of weight among genes.
Fig. 5.Highlighted genes to represent a single pathway.
Table 1
Weight of highlighted gene inFig. 5.
Nodes EPAC Rap1 ITGAL Pyk2 Vav RhoA
the restart probability is used as tuning parameter (Seah et al., 2017). Restart probability is applied to estimate the probability of the node to move into the neighbouring nodes or goes backward to the previous nodes. With a variety of restart probabilities, the sDRW can list all the risk pathways that are topologically impor-tant and significant to the corresponding cancerous genes. This can identify all the risk pathways though the processing time will increase by 9 times due to the processing of 9 different restart probabilities. This is because with variety of restart probabilities, the process of random walk will increase regardless to the number of restart probabilities.
In directed random walk algorithm, restart probability is set as 0.7. Instead of only 0.7, sDRW is using additional of eight restart probabilities in the initial stage of experiment. The eight restart probabilities are 0.1, 0.2, 0.3, 0.4, 0.5, 0.6, 0.8, and 0.9. Of Course, 0.7 is also used in sDRW. The significant genes within pathways can be selected and classified with better accuracy by using differ-ent restart probability.
The process is consisting of three main steps. Firstly, the genes in microarray datasets are selected and grouped based on their prior pathway information from the pathway datasets. This pro-cess repeats for each pathway in the pathway datasets and some genes might be excluded in the process. This is because the gene in gene expression datasets cannot be matched or cannot be found in pathway datasets/directed graph. TheP-values of genes is calcu-lated and the significant level of genes is differentiated according to theP-values. The calculation process is followed by the calculat-ing of weight, t-score, and reproducible power of pathways. Pseudo-code of tuning parameter selection in sDRW is shown in Fig. 7. The reproducibility of gene will determine the robustness and significant level towards cancer. The higher the reproducibility of genes, the more the robustness and significant level of respec-tive gene towards cancer (Jadamba and Shin, 2014). Pathway that contain higher significant level of gene will be predicted as risk pathway and further evaluated by restart probabilities. With different number of nine restart probabilities, the process of
evaluation will go through nine times and the final selected risk pathways will vary according to the restart probabilities.
The evaluation method is evaluated by the optimum number of risk pathways that matches with the corresponding input datasets. For example, out of nine restart probabilities, 0.1 have the most number of selected number of pathways in lung cancer dataset. Hence, 0.1 is set as the default restart probability for lung cancer dataset. Note that, different cancer dataset requires different restart probability. If there are two restart probabilities that have same number of selected risk pathways, further evaluation steps will be taken. The number of significant genes will be referred to, for this evaluation step and the highest number of risk genes selected by the corresponding restart probability will be set as default for the corresponding cancer dataset. For example, the restart probability of 0.2 and 0.6 have selected three risk pathways for stomach cancer dataset. However, with the restart probability of 0.2, 53 significant genes are selected while, the restart probabil-ity of 0.6 selected 72 significant genes. Hence, 0.6 will be set as the default restart probability for stomach cancer datasets. Evaluation method will be further enhanced based on the accuracy of classification.
2.2.1.2. Weight as parameter. The weight of every single gene is dif-ferent, depending on the number of other genes influencing it. Thus, the higher the number of influence, the higher the weight of the gene. With sDRW, weight is presented as one of the impor-tant parameter in determining the relationship between genes (Seah et al., 2017). sDRW had proved that weight of genes can affect the attraction bond between genes which will lead to higher vector (Montenegro, 2009). In sDRW, the cost of travelling from node to node is vector. The cost can be measure by different units, depending on the application. Directed graph is defined as weight graph when the weight value of each gene is attached to the correspond node.
Relationship between genes, also known as direction from gene towards next gene is fixed by pathway datasets. Since the pathway
datasets are converted into directed graph, hence matrix can be made based on directed graph. Simple illustration of pathway is shown inFig. 8with corresponding matrix inTable 2.
Weight of gene is corresponding between towards and forward of random walk. With directed graph, it is lead biasedly towards the selected gene (Pawitan et al., 2005). Formally, sDRW is defined as
Wtþ1¼ ð1rÞðMÞ
N1þN2
2
þrWt ð1Þ
whereWt+1is the vector, the cost of travelling towards next gene
whileris the restart probability with a range of 0.1 until 0.9.Mis an adjacency matrix developed from the original directed graph. As weight is one of the parameter and playing an important role in determine the connectivity between genes. Hence, weight of two connected genes,N1andN2is used as average between both
genes to obtain a stable connectivity.Wtis a vector ofNnode which
is transmitted fromN-1node (Seah et al., 2017).
InFig. 5, the relationship between the gene can be written as EPAC -> Rap1 -> ITGAL -> Pyk2 -> Vav -> RhoA. Vector of sDRW will be calculated based on the gene shown inFig. 5. Initial vector, W0 of first nodes (1) is zero because it is an initial node. Hence,
W0¼0 W1¼ ð10:4Þð1Þ 2:338914þ8:47301 2 þ0:4ð0Þ ¼3:243577 W2¼ ð10:4Þð1Þ 8:47301þ6:1441 2 þ0:4ð3:243577Þ ¼4:385133þ1:297431 ¼5:682564 W3¼ ð10:4Þð1Þ 6:1441þ3:102989 2 þ0:4ð5:682564Þ ¼2:774127þ2:273026 ¼5:047153 W4¼ ð10:4Þð1Þ 3:102989þ11:38365 2 þ0:4ð5:047153Þ ¼4:345992þ2:018861 ¼6:364853 W5¼ ð10:4Þð1Þ 11:38365þ5:149393 2 þ0:4ð6:364853Þ ¼4:959913þ2:545941 ¼7:505854
Table 3shows the resulted vector of sDRW after 6th walk. The fluctuation of vector happened because the weight if gene is influ-encing the reading. Weight plays an important role to attract the other nodes.
If the nodes have strong connectivity between each other, hence the vector will be higher and this vector will be contributed to the next walk.T-test score is also used in sDRW during initial probabil-ity, hence the magnitude oft-test score will contributed to the weight adjustments. Therefore, the genes which have higher weight are topologically important towards cancerous and signifi-cantly different compare to other normal genes.
Fig. 9shows the illustration of directed graph formation from different pathways. Each shape indicates different biological path-ways that topologically important to different cancers. Initially, random walk will start from A, 1 or I. It will randomly select the significant important genes based on the weight of the next gene. For example, the walker will walk towards 2 from 1 during single pathway. When pathways are combined to form directed graph, the walker will walk randomly towards any direction that have set in directed graph. But if B have higher weight compare to 2, hence walker will prefer walk toward B instead of 2. With different restart probabilities toward different input datasets, the walker will be prevented walk with only one criteria. The walker will eval-uate the suitable restart probability and calculate the most suitable path for the correspond dataset.
In sDRW, tuning parameter selection and weight parameter is combined to evaluate any possibility that might happened in order to optimize the prediction and classification of input datasets. The restart probabilities of 0.1 until 0.9 will be used for all input data-sets even though there is a default optimum restart probability for each dataset. This is because some restart probabilities had pre-dicted different pathways as risk pathways compared to default restart probability. And the risk pathways contained cancerous gene as well. In order to not missing any cancerous classification, hence, all restart probability will be used and the default restart probability will be bold in order to show the different in terms of number of risk pathway, number of risk gene and area under curve for accuracy purposed.
3. Results and discussion
In this section, performance of sDRW showcases two methods. The methods are used to study the effectiveness and the perfor-mance of sDRW, which are sensitivity of cancer prediction, and accuracy of cancer classification.
3.1. Cancer prediction
Prediction method is used to predict the risk pathways and sig-nificant genes before classifying the genes. Gene expression data-sets are being implemented and run on directed graph with its weight. By going through sDRW, the walker will study the vector andP-values of each gene from the pathway. If the pathways con-tain genes that haveP-value less than 0.05, then the pathway is used in constructing directed graph (Štefka and Holenˇ a, 2013). This is becauseP-value will determine the significant towards cancer mutation. Experiment had been run with six different input data-sets. First, risk pathways are predicted and with these detected risk pathways, further prediction is able to take place by figuring out the risk genes among the risk pathways. Hence, the restart
proba-Fig. 8.Simple illustration of pathway dataset.
Table 2
Adjacency matrix of relationship of gene.
A 1 2 3 4 5 1 0 0 1 0 0 2 0 0 0 1 0 3 0 1 0 0 1 4 0 0 0 0 0 5 1 0 0 0 0
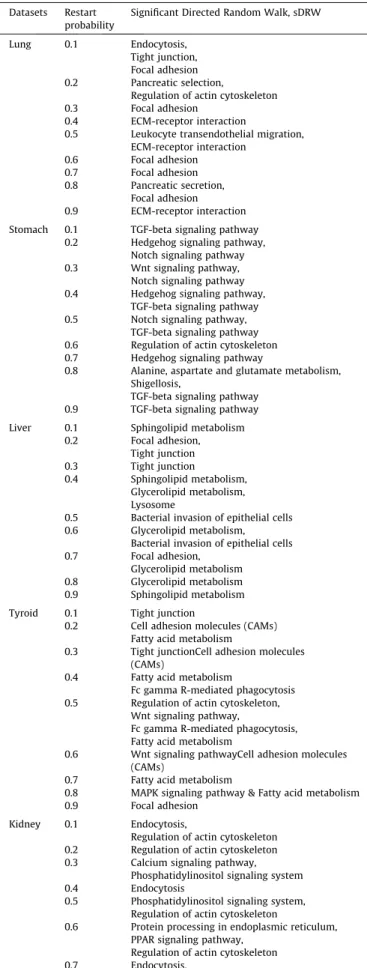
bility that detects most pathways, in comparison to the rest, is set as the optimum restart probability for the correspond dataset. The sensitivity of prediction will be counted based on the number of pathways detected by the optimum restart probability. Hence, the optimum restart probability that predicts the most number of pathways is the most effective regardless of the number of risk genes detected.Table 4shows the name of risk pathway, in differ-ent dataset that had been predicted to be significantly towards cancerous mutation. The detected risk pathways are used to fur-ther extended in the prediction of significant genes.
sDRW was developed based on DRW. Comparison will be taken to evaluate the performance and effectiveness of sDRW with its successes towards increasing the sensitivity of prediction and accuracy of binary classification towards gene expression dataset. Six input datasets had applied in sDRW and DRW. Firstly, the risk pathways that predicted by both algorithm are presented in term of name, and number of detected pathways. Table 5 shows the comparison of name of risk pathway that predicted by sDRW and DRW. Six datasets had applied in the experiment and the experi-ment had run for nine times due to different restart probabilities. Different number of risk pathways had been predicted and there are some restart probabilities that can identify more risk pathways compare to the other restart probabilities.Table 6shows the com-parison of number of risk pathways that predicted by sDRW and DRW with the correspond different in term of number. The table clearly identify the improvement of sDRW with more predicted risk pathways.
Fig. 10presents the number of risk pathways that are detected by sDRW and DRW against six different cancer datasets. The com-parison between the sDRW and DRW with lung cancer dataset shows the sDRW predicting the highest number of risk pathway, 3 against the restart probability of 0.1. The comparison between the sDRW and DRW with stomach cancer dataset shows the sDRW predicting the highest number of risk pathway, 3 against the restart probability of 0.8. The comparison between the sDRW and DRW shows liver cancer dataset with the sDRW predicting the highest number of risk pathway, 3 against the restart probability of 0.4. The comparison between the sDRW and DRW with thyroid
Table 3
Result of vector from first node to sixth node. Vector,W Significant Directed Random Walk
W0 0 W1 3.243577 W2 5.682564 W3 5.047153 W4 6.364853 W5 7.505854
Fig. 9.Complex illustration of pathway dataset.
Table 4
Name of risk pathway that predicted by sDRW. Datasets Restart
probability
Significant Directed Random Walk, sDRW
Lung 0.1 Endocytosis, Tight junction, Focal adhesion 0.2 Pancreatic selection,
Regulation of actin cytoskeleton 0.3 Focal adhesion
0.4 ECM-receptor interaction
0.5 Leukocyte transendothelial migration, ECM-receptor interaction 0.6 Focal adhesion 0.7 Focal adhesion 0.8 Pancreatic secretion, Focal adhesion 0.9 ECM-receptor interaction Stomach 0.1 TGF-beta signaling pathway
0.2 Hedgehog signaling pathway, Notch signaling pathway 0.3 Wnt signaling pathway,
Notch signaling pathway 0.4 Hedgehog signaling pathway,
TGF-beta signaling pathway 0.5 Notch signaling pathway,
TGF-beta signaling pathway 0.6 Regulation of actin cytoskeleton 0.7 Hedgehog signaling pathway
0.8 Alanine, aspartate and glutamate metabolism, Shigellosis,
TGF-beta signaling pathway 0.9 TGF-beta signaling pathway Liver 0.1 Sphingolipid metabolism
0.2 Focal adhesion, Tight junction 0.3 Tight junction 0.4 Sphingolipid metabolism, Glycerolipid metabolism, Lysosome
0.5 Bacterial invasion of epithelial cells 0.6 Glycerolipid metabolism,
Bacterial invasion of epithelial cells 0.7 Focal adhesion,
Glycerolipid metabolism 0.8 Glycerolipid metabolism 0.9 Sphingolipid metabolism Tyroid 0.1 Tight junction
0.2 Cell adhesion molecules (CAMs) Fatty acid metabolism
0.3 Tight junctionCell adhesion molecules (CAMs)
0.4 Fatty acid metabolism
Fc gamma R-mediated phagocytosis 0.5 Regulation of actin cytoskeleton,
Wnt signaling pathway,
Fc gamma R-mediated phagocytosis, Fatty acid metabolism
0.6 Wnt signaling pathwayCell adhesion molecules (CAMs)
0.7 Fatty acid metabolism
0.8 MAPK signaling pathway & Fatty acid metabolism 0.9 Focal adhesion
Kidney 0.1 Endocytosis,
Regulation of actin cytoskeleton 0.2 Regulation of actin cytoskeleton 0.3 Calcium signaling pathway,
Phosphatidylinositol signaling system 0.4 Endocytosis
0.5 Phosphatidylinositol signaling system, Regulation of actin cytoskeleton
0.6 Protein processing in endoplasmic reticulum, PPAR signaling pathway,
Regulation of actin cytoskeleton 0.7 Endocytosis,
Regulation of actin cytoskeleton
cancer dataset shows the sDRW predicting the highest number of risk pathway, 4 against the restart probability of 0.5. The compar-ison between the sDRW and DRW with kidney cancer dataset shows the sDRW predicting the highest number of risk pathway, 3 against the restart probability of 0.6. The comparison between the sDRW and DRW with liver cancer dataset shows the sDRW pre-dicting the highest number of risk pathway, 3 against the restart probability of 0.4.
3.2. Cancer classification
Binary classification has been used to classify the genes of input datasets into cancerous genes or normal genes (Gao et al., 2009). In this experiment, all input datasets have been divided into test set and training set based on 5-fold cross validation. Four-fifths of the samples were used as training set while the remaining one-fifth was used as test set.
Table 4(continued) Datasets Restart
probability
Significant Directed Random Walk, sDRW 0.8 PPAR signaling pathway
0.9 Calcium signaling pathway
Breast 0.1 Neuroactive ligand-receptor interaction 0.2 Glycerophospholipid metabolism 0.3 Neuroactive ligand-receptor interaction 0.4 Adipocytokine signaling pathway,
Fatty acid metabolism, Jak-STAT signaling pathway
0.5 Cytokine-cytokine receptor interaction, Fatty acid metabolism
0.6 Jak-STAT signaling pathway
0.7 Neuroactive ligand-receptor interaction 0.8 Chemokine signaling pathway 0.9 Adipocytokine signaling pathway,
Glycerophospholipid metabolism
Table 5
Name of risk pathway that predicted by sDRW and DRW. Datasets Restart
probability
Significant Directed Random Walk, sDRW Directed Random Walk, DRW
Lung 0.1 Endocytosis, Tight junction, Focal adhesion
Tight junction
0.2 Pancreatic selection,
Regulation of actin cytoskeleton
ECM-receptor interaction 0.3 Focal adhesion ECM-receptor interaction 0.4 ECM-receptor interaction ECM-receptor interaction,
Focal adhesion 0.5 Leukocyte transendothelial migration,
ECM-receptor interaction
ECM-receptor interaction, Focal adhesion
0.6 Focal adhesion Leukocyte transendothelial migration
0.7 Focal adhesion Focal adhesion
0.8 Pancreatic secretion, Focal adhesion
Focal adhesion 0.9 ECM-receptor interaction Pancreatic secretion Stomach 0.1 TGF-beta signaling pathway TGF-beta signaling pathway
0.2 Hedgehog signaling pathway, Notch signaling pathway
Hedgehog signaling pathway 0.3 Wnt signaling pathway,
Notch signaling pathway
Wnt signaling pathway 0.4 Hedgehog signaling pathway,
TGF-beta signaling pathway
Hedgehog signaling pathway, TGF-beta signaling pathway 0.5 Notch signaling pathway,
TGF-beta signaling pathway
Notch signaling pathway 0.6 Regulation of actin cytoskeleton Regulation of actin cytoskeleton 0.7 Hedgehog signaling pathway Hedgehog signaling pathway 0.8 Alanine, aspartate and glutamate metabolism,
Shigellosis,
TGF-beta signaling pathway
Alanine, aspartate and glutamate metabolism, Shigellosis
0.9 TGF-beta signaling pathway TGF-beta signaling pathway Liver 0.1 Sphingolipid metabolism Sphingolipid metabolism
0.2 Focal adhesion, Tight junction
Focal adhesion, Sphingolipid metabolism 0.3 Tight junction Sphingolipid metabolism 0.4 Sphingolipid metabolism,
Glycerolipid metabolism, Lysosome
Sphingolipid metabolism, Tight junction
0.5 Bacterial invasion of epithelial cells Bacterial invasion of epithelial cells 0.6 Glycerolipid metabolism,
Bacterial invasion of epithelial cells
Glycerolipid metabolism 0.7 Focal adhesion,
Glycerolipid metabolism
Focal adhesion 0.8 Glycerolipid metabolism Sphingolipid metabolism 0.9 Sphingolipid metabolism Glycerolipid metabolism Tyroid 0.1 Tight junction Cell adhesion molecules (CAMs)
0.2 Cell adhesion molecules (CAMs) Fatty acid metabolism
Cell adhesion molecules (CAMs) 0.3 Tight junctionCell adhesion molecules
(CAMs)
Tight junction,Cell adhesion molecules (CAMs)
Table 5(continued)
Datasets Restart probability
Significant Directed Random Walk, sDRW Directed Random Walk, DRW
0.4 Fatty acid metabolism
Fc gamma R-mediated phagocytosis
Tight junction,
Fc gamma R-mediated phagocytosis 0.5 Regulation of actin cytoskeleton,
Wnt signaling pathway,
Fc gamma R-mediated phagocytosis, Fatty acid metabolism
Regulation of actin cytoskeleton, Fc gamma R-mediated phagocytosis
0.6 Wnt signaling pathwayCell adhesion molecules (CAMs)
Wnt signaling pathway,Cell adhesion molecules (CAMs)
0.7 Fatty acid metabolism Fatty acid metabolism 0.8 MAPK signaling pathway & Fatty acid metabolism MAPK signaling pathway
0.9 Focal adhesion Focal adhesion
Kidney 0.1 Endocytosis,
Regulation of actin cytoskeleton
Regulation of actin cytoskeleton 0.2 Regulation of actin cytoskeleton Regulation of actin cytoskeleton 0.3 Calcium signaling pathway,
Phosphatidylinositol signaling system
Regulation of actin cytoskeleton, Phosphatidylinositol signaling system
0.4 Endocytosis Endocytosis
0.5 Phosphatidylinositol signaling system, Regulation of actin cytoskeleton
Phosphatidylinositol signaling system, Regulation of actin cytoskeleton 0.6 Protein processing in endoplasmic reticulum,
PPAR signaling pathway, Regulation of actin cytoskeleton
Regulation of actin cytoskeleton
0.7 Endocytosis,
Regulation of actin cytoskeleton
Endocytosis,
Regulation of actin cytoskeleton 0.8 PPAR signaling pathway PPAR signaling pathway 0.9 Calcium signaling pathway Endocytosis
Regulation of actin cytoskeleton Breast 0.1 Neuroactive ligand-receptor interaction Adipocytokine signaling pathway
0.2 Glycerophospholipid metabolism Glycerophospholipid metabolism 0.3 Neuroactive ligand-receptor interaction Neuroactive ligand-receptor interaction 0.4 Adipocytokine signaling pathway,
Fatty acid metabolism, Jak-STAT signaling pathway
Fatty acid metabolism
0.5 Cytokine-cytokine receptor interaction, Fatty acid metabolism
Cytokine-cytokine receptor interaction 0.6 Jak-STAT signaling pathway Jak-STAT signaling pathway 0.7 Neuroactive ligand-receptor interaction Adipocytokine signaling pathway,
Neuroactive ligand-receptor interaction 0.8 Chemokine signaling pathway Chemokine signaling pathway 0.9 Adipocytokine signaling pathway,
Glycerophospholipid metabolism
Adipocytokine signaling pathway, Fatty acid metabolism
Table 6
Number of risk pathway detected by sDRW and DRW.
Datasets Method Restart probabilities,r
0.1 0.2 0.3 0.4 0.5 0.6 0.7 0.8 0.9
Lung, sDRW 3 2 1 1 2 1 1 2 1
GSE10072 DRW 1 1 1 2 2 1 1 1 1
Detected Extra pathway 2 1 0 1 0 0 0 1 0
Stomach, sDRW 1 2 2 2 2 1 1 3 1
GSE13911 DRW 1 1 1 2 1 1 1 2 1
Detected Extra pathway 0 1 1 0 1 0 0 1 0
Liver, sDRW 1 2 1 3 1 2 2 1 1
GSE17856 DRW 1 2 1 2 1 1 1 1 1
Detected Extra pathway 0 0 0 1 0 1 1 0 0
Tyroid, sDRW 1 2 2 2 4 2 1 2 1
GSE5364 DRW 1 1 2 2 2 2 1 1 1
Detected Extra pathway 0 1 0 0 2 0 0 1 0
Kidney, sDRW 2 1 2 1 2 3 2 1 1
GSE17895 DRW 1 1 2 1 2 1 2 1 2
Detected Extra pathway 1 0 0 0 0 2 0 0 1
Breast, sDRW 1 1 1 3 2 1 1 1 2
GSE1456 DRW 1 1 1 1 1 1 2 1 2
Detected Extra pathway 0 0 0 2 1 0 1 0 0
*
Training set is further split into three equal-sized subsets in order to select the best pathway marker set. Out of three subsets, two were used as marker evaluation subset to build classifier and rank the pathway marker. While the remain one subset of training set was used as feature selection dataset for assessing which pathway marker set produced the best classification perfor-mance.T-test statistics of pathway activities of the two subsets had been calculated in order to build classifier. They had been ranked by theP-values in increasing order. Out of 300 pathways, 50 top ranked pathways were selected as feature to build logistic regres-sion model. Pathways were added sequentially to train the logistic regression model. While the performance of the classifier was measured by evaluating the area under the receiver operating
characteristics curve (AUC) on the feature selection dataset [39]. Two marker pathway subsets were rotated to test and the signifi-cant pathway from the correspond subset will be kept in feature set if the AUC is increased and more than 0.9. Process is repeated for the top 50 pathway markers in order to optimize the perfor-mance of classifier and obtain the best feature set.
After optimized the performance of classifier, test set is used to evaluate the performance of classifier. Pathway marker in the selective best feature set is used in classifier.Table 7shows the AUC of each dataset in different restart probabilities.
Besides, comparison of number of cancerous genes that detected by sDRW and DRW is presented inTable 8. sDRW had successfully predicted more significant genes compare to DRW.
This result had proved that sDRW are more sensitive in gene pre-diction.Table 9shows the comparison of AUC after classification between sDRW and DRW. Comparison of AUC had proved that sDRW are better in terms of cancer classification due to higher accuracy.
Fig. 11shows the number of cancerous genes that are detected by sDRW and DRW. The optimum restart probability is chosen based on the highest number of risk pathway, which is, detected by that corresponding restart probability. The optimum restart probability for lung cancer dataset is 0.1, with the highest number of cancerous gene detection, 268. With the same restart probabil-ity, the DRW detected 63 cancerous genes, which is less than sDRW, at about 205 genes. The optimum restart probability for
stomach cancer dataset is 0.8, with the highest number of cancer-ous gene detection, 89. With the same restart probability, the DRW detected 48 cancerous genes, which is less than sDRW, by approx-imately 41 genes. Even though restart probability 0.3 has detected more genes compare to the other restart probabilities, the detected pathways at the corresponding restart probabilities are only 2. Hence, it will not be set as the default restart probability. The opti-mum restart probability for liver cancer dataset is 0.4, with the highest number of cancerous gene detection, 82. With the same restart probability, the sDRW detected 73 cancerous genes, which is less than DRW, by about 9 genes. Overall, restart probability 0.2 detected more genes but only detected two pathways. Compared to lesser number of detected genes, restart probability 0.4 shows
Table 7
AUC of every datasets against restart probabilities from 0.1 to 0.9 in sDRW. Datasets Restart Probabilities,r
0.1 0.2 0.3 0.4 0.5 0.6 0.7 0.8 0.9 Lung 0.9676 0.9702 0.9818 0.9764 0.9819 0.9877 0.9877 0.9582 0.9871 Stomach 0.9472 0.9749 0.9362 0.8935 0.9356 0.9642 0.9215 0.9784 0.95478 Liver 0.9469 0.9844 0.9427 0.9629 0.9428 0.9525 0.9635 0.9836 0.9684 Tyroid 0.9426 0.9579 0.9869 0.9258 0.9538 0.9125 0.9312 0.9216 0.9528 Kidney 0.9615 0.9472 0.9637 0.9578 0.9472 0.9478 0.9573 0.9268 0.9637 Breast 0.8493 0.7042 0.7296 0.9508 0.8941 0.8251 0.8466 0.9943 0.9467 Table 8
Number of cancerous gene detected by sDRW and DRW.
Datasets Method Restart Probabilities,r
0.1 0.2 0.3 0.4 0.5 0.6 0.7 0.8 0.9 Lung, sDRW 268 160 118 49 112 118 118 118 49 GSE10072 DRW 63 49 49 167 167 63 118 118 45 Increment of percentage, % 325.3968 226.5306 140.8163 70.6597 32.9341 87.3016 0 0 8.8889 Stomach, sDRW 41 53 109 65 70 108 24 89 41 GSE13911 DRW 41 24 80 65 29 108 24 48 41 Increment of percentage, % 0 120.8333 36.25 0 141.3793 0 0 85.4167 0 Liver, sDRW 21 170 61 73 40 67 136 109 21 GSE17856 DRW 21 130 21 82 40 27 109 21 109 Increment of percentage, % 0 30.7692 190.4762 10.9756 0 148.1481 24.7706 4.1905 80.7339 Tyroid, sDRW 23 29 39 33 98 52 13 76 51 GSE5364 DRW 16 16 39 43 9 52 13 63 51 Increment of percentage, % 43.75 81.25 0 23.2558 988.8889 0 0 20.6349 0 Kidney, sDRW 73 39 175 34 53 94 73 19 161 GSE17895 DRW 39 39 53 34 53 39 73 19 73 Increment of percentage, % 87.1795 0 230.1887 0 0 141.0256 0 0 120.5479 Breast, sDRW 19 12 19 44 35 21 19 23 26 GSE1456 DRW 14 12 19 9 26 21 33 23 23 Increment of percentage, % 35.7143 0 0 388.8889 34.6138 0 42.4242 0 13.0435 *
The boldris the optimum restart probability for sDRW.
Table 9
Comparison of AUC between sDRW and DRW.
Dataset Method Restart Probabilities,r
0.1 0.2 0.3 0.4 0.5 0.6 0.7 0.8 0.9 Lung, sDRW 0.9676 0.9702 0.9818 0.9764 0.9819 0.9877 0.9877 0.9582 0.9871 GSE10072 DRW 0.9636 0.9761 0.9699 0.976 0.963 0.9817 0.9764 0.9764 0.9816 Stomach, sDRW 0.9472 0.9749 0.9362 0.8935 0.9356 0.9642 0.9215 0.9784 0.95478 GSE13911 DRW 0.9362 0.9235 0.9424 0.9531 0.9235 0.9642 0.9148 0.9548 0.9642 Liver, sDRW 0.9469 0.9844 0.9427 0.9629 0.9428 0.9525 0.9635 0.9836 0.9684 GSE17856 DRW 0.9225 0.9528 0.9483 0.9468 0.9241 0.9216 0.9574 0.9748 0.9425 Tyroid, sDRW 0.9426 0.9579 0.9869 0.9258 0.9538 0.9125 0.9312 0.9216 0.9528 GSE5364 DRW 0.9461 0.9472 0.9572 0.9462 0.9136 0.8467 0.9318 0.9127 0.9424 Kidney, sDRW 0.9615 0.9472 0.9637 0.9578 0.9472 0.9478 0.9573 0.9268 0.9637 GSE17895 DRW 0.9437 0.9426 0.9259 0.9471 0.9421 0.9431 0.9841 0.9144 0.9258 Breast, sDRW 0.8493 0.7042 0.7296 0.9508 0.8941 0.8251 0.8466 0.9943 0.9467 GSE1456 DRW 0.6379 0.7821 0.6872 0.9496 0.9135 0.7258 0.5984 0.9546 0.9268
its significance by detecting more pathways. The optimum restart probability for thyroid cancer dataset is 0.5, with the highest num-ber of cancerous gene detection, 98. With the same restart proba-bility, the DRW detected 9 cancerous genes, which is less than sDRW, by about 89 genes. The optimum restart probability for kid-ney cancer dataset is 0.6, with the highest number of cancerous gene detection, 94. With the same restart probability, the DRW detected 39 cancerous genes, which is less than sDRW, by about 55 genes. The optimum restart probability for breast cancer dataset is 0.4, with the highest number of cancerous gene detection, 44. With the same restart probability, the DRW detected 9 cancerous genes, which is less than sDRW, by about 35 genes.
From the experiments, we concluded that the sDRW is less effective on liver cancer dataset, which detects 9 genes less com-pared to DRW. Overall, sDRW is more effective in proving the sen-sitivity of the risk gene prediction.
4. Conclusion
In this paper, we proposed a significant directed random walk approach based on tuning parameter selection and weight as parameter for cancer classification using gene expression datasets. This approach is used as cancer classification which studied the relationship of gene expression data and cancerous gene. The main objective of this paper is to prove the effectiveness and perfor-mance of the proposed approach against directed random walk. The comparison between these two algorithms is done by compar-ing the sensitivity of cancer prediction and accuracy of cancer clas-sification. Throughout the experiment results, this approach had proved to have higher sensitivity of cancerous prediction and more accurate cancer classification.
First, tuning parameter selection is used to highlight the opti-mum restart probability for correspond dataset by testing with
all nine restart probabilities. Then, the optimum restart probability will be chosen based on the most detected number of pathways. This is because only a complete biological pathway will generate protein, and with more biological pathway, more genes can be detected. Then weight among genes will be added into the path-way while walker is working on the directed graph for cancer pre-diction. The connectivity among gene plays an important role in determining the vector which will determine the walker to walk along the pathway. Finally, five-fold cross validation is used to train the classifier and classify the significant gene that detected by sDRW. The results demonstrated that the proposed approach is more effective, and feasible, for cancer classification compared to directed random walk.
Acknowledgment
We would like to thank the Universiti Tun Hussein Onn Malay-sia and Ministry of Higher Education, MalayMalay-sia for supporting this research under the Fundamental of Research Grant Scheme re-search grants (Vot numbers: 1559) also thanks to Gates IT Solution Sdn Bhd for the whole support.
References
Bair, E., 2013. Identification of significant features in DNA microarray data. Wiley Interdiscipl. Rev.: Comput. Stat. 5 (4), 309–325.
Codling, E., Plank, M., Benhamou, S., 2008. Random walk models in biology. J. Roy. Soc. Interface 5 (25), 813–834.
D’Errico, M., Rinaldis, E., Blasi, M., Viti, V., Falchetti, M., Calcagnile, A., et al., 2009. Genome-wide expression profile of sporadic gastric cancers with microsatellite instability. Eur. J. Cancer 45 (3), 461–469.
Dalgliesh, G., Furge, K., Greenman, C., Chen, L., Bignell, G., Butler, A., et al., 2010. Systematic sequencing of renal carcinoma reveals inactivation of histone modifying genes. Nature 463 (7279), 360–363.
Draghici, S., Khatri, P., Tarca, A., Amin, K., Done, A., Voichita, C., et al., 2007. A systems biology approach for pathway level analysis. Genome Res. 17 (10), 1537–1545.
Fahey, T., 2010. Identification of borderline thyroid tumors by gene expression array analysis. Yearbook Surg. 2010, 181–182.
Gao, X., Chen, F., Song, F., Jin, Z., 2009. Influence of feature weight on text categorization performance of Bayesian classifier. J. Comput. Appl. 28 (12), 3080–3083.
Gaur, S., Turkbey, B., Choyke, P., 2017. Hereditary renal tumor syndromes: update on diagnosis and management. Seminars Ultrasound. CT MRI. 38 (1), 59–71.
Jadamba, E., Shin, M., 2014. A novel approach to significant pathway identification using pathway interaction network from PPI data. BioChip J. 8 (1), 22–27. KEGG PATHWAY: Leukocyte transendothelial migration – Homo sapiens (human)
[Internet]. Genome.jp. 2017 [cited 2 September 2017]. Available from: <http:// www.genome.jp/kegg-bin/show_pathway?hsa04670>.
Kirk, A., 2007. 8 Pulmonary resection for metastatic colorectal cancer. Lung Cancer 57 (3).
Lan, W., Wang, J., Li, M., Lu, C., Wu, F., et al., 2016. Predicting microRNA-environmental factor interactions based on bi-random walk and multi-label learning. 2016 IEEE International Conference on Bioinformatics and Biomedicine (BIBM), pp. 27–32.
Landi, M., Dracheva, T., Rotunno, M., Figueroa, J., Liu, H., Dasgupta, A., et al., 2008. Gene expression signature of cigarette smoking and its role in lung adenocarcinoma development and survival. PLoS ONE 3 (2), e1651.
Li, C., Li, X., Miao, Y., Wang, Q., Jiang, W., Xu, C., et al., 2009. SubpathwayMiner: a software package for flexible identification of pathways. Nucleic Acids Res. 37 (19). e131-e131.
Li, Y., Li, J., 2012. Disease gene identification by random walk on multigraphs merging heterogeneous genomic and phenotype data. BMC Genomics. 13 (Suppl 7), S27.
Lin, L., Lin, Y., Jin, Y., Zheng, C., 2016. Retraction notice to microarray analysis of microRNA expression in liver cancer tissues and normal control [GENE 523/2 (2014) 158–160]. Gene 578 (1), 137.
Liu, W., Li, C., Xu, Y., Yang, H., Yao, Q., Han, J., et al., 2013. Topologically inferring risk-active pathways toward precise cancer classification by directed random walk. Bioinformatics 29 (17), 2169–2177.
Malla, Y., 2017. A machine learning approach for early prediction of breast cancer. Int. J. Eng. Comput. Sci.
Matteo, R., Giorgio, V., 2017. Random walking on functional interaction networks to rank genes involved in cancer. 8th International Conference on Artificial Intelligence Applications and Innovations (AIAI), pp. 66–75.
Meghanathan, N., 2015. Exploiting the discriminating power of the eigenvector centrality measure to detect graph isomorphism. Int. J. Found. Comput. Sci. Technol. 5 (6), 01–13.
Misman, M., Mohamad, M., Deris, S., Hashim, S., 2014. A group-specific tuning parameter for hybrid of SVM and SCAD in identification of informative genes and pathways. Int. J. Data Min. Bioinform. 10 (2), 146.
Montenegro, R., 2009. The simple random walk and max-degree walk on a directed graph. Random Struct. Algorithms 34 (3), 395–407.
Pawitan, Y., Bjöhle, J., Amler, L., Borg, A., Egyhazi, S., Hall, P., et al., 2005. Gene expression profiling spares early breast cancer patients from adjuvant therapy: derived and validated in two population-based cohorts. Breast Cancer Res. 7 (6).
Petrochilos, D., Shojaie, A., Gennari, J., Abernethy, N., 2013. Using random walks to identify cancer-associated modules in expression data. BioData Mining 6 (1).
Playdon, M., Matthews, S., Thompson, H., 2013. Weight change patterns and breast cancer risk: a brief review and analysis. Crit. Rev. Eukaryot. Gene Expr. 23 (2), 159–169.
Revathy, N., Amalraj, D., 2011. Accurate cancer classification using expressions of very few genes. Int. J. Comput. Appl. 14 (4), 19–22.
Roessler, S., Lin, G., Forgues, M., Budhu, A., Hoover, S., Simpson, R., et al., 2015. Integrative genomic and transcriptomic characterization of matched primary and metastatic liver and colorectal carcinoma. Int. J. Biol. Sci. 11 (1), 88–98.
Seah, C., Kasim, S., Mohamad, M., 2017. Specific tuning parameter for directed random walk algorithm cancer classification. Int. J. Adv. Sci., Eng. and Inform. Technol. 7 (1), 176.
Seah, C., Kasim, S., Fudzee, M., Mohamad, M., 2017. A direct proof of significant directed random walk. IOP Conf. Series: Mater. Sci. Eng. 235, 012004.
Shao, X., Chen, Z., Miao, M., Cen, J., Shen, H., 2011. Development of a Bead-based liquid array for analysis of gene expression profiling. Progress Biochem. Biophys. 38 (7), 661–669.
Srivastava, P., Mangal, M., Agarwal, S., 2014. Understanding the transcriptional regulation of cervix cancer using microarray gene expression data and promoter sequence analysis of a curated gene set. Gene 535 (2), 233–238.
Štefka, D., Holenˇ a, M., 2013. Performance of classification confidence measures in dynamic classifier systems. Neural Network World. 23 (4), 299–320.
Suki, B., Frey, U., 2017. A time-varying biased random walk approach to human growth. Sci. Rep. 7 (1).
Tsuchiya, M., Parker, J., Kono, H., Matsuda, M., Fujii, H., Rusyn, I., 2010. Gene expression in nontumoral liver tissue and recurrence-free survival in hepatitis C virus-positive hepatocellular carcinoma. Molecular Cancer. 9 (1), 74.
Yano, K., 2011. Random walk in a finite directed graph subject to a road coloring. J. Theor. Probab. 26 (1), 259–283.
Young, Craft D., 2016. Pathway-informed classification system (PICS) for cancer analysis using gene expression data. Cancer Informat., 151
Yu, K., Ganesan, K., Tan, L., Laban, M., Wu, J., Zhao, X., et al., 2008. A Precisely regulated gene expression cassette potently modulates metastasis and survival in multiple solid cancers. PLoS Genet. 4 (7), e1000129.
Zlatic, V., Gabrielli, A., Caldarelli, G., 2010. Topologically biased random walk and community finding in networks. Phys. Rev. E 82 (6).