Resistance to Airflow and Moisture Loss of Table Grapes Inside
Multi-scale Packaging
By
Mduduzi Elijah Khulekani Ngcobo
Dissertation presented for the degree of Doctor of Philosophy in the Faculty of AgriSciences at Stellenbosch University
Promoter: Prof. Umezuruike Linus Opara
Postharvest Technology Research Laboratory, South African Research Chair in Postharvest Technology, Department of Horticultural Science, Faculty of AgriSciences
Co-promoter: Prof. Chris J. Meyer
Department of Mechanical and Mechatronics Engineering, Faculty of Engineering
DECLARATION
By submitting this dissertation electronically, I declare that the entirety of the work contained therein is my own, original work, and that I have not previously in its entirety or in part submitted it for obtaining any qualification.
March 2013
Copyright © 2013 Stellenbosch University
SUMMARY
Postharvest quality of fresh table grapes is usually preserved through cooling using cold air. However, cooling efficiencies are affected by the multi-scale packaging that is commercially used for handling grapes after harvest. There is usually spatial temperature variability of grapes that often results in undesirable quality variations during postharvest handling and marketing. This heterogeneity of grape berry temperature inside multi-packages is largely due to uneven cold airflow patterns that are caused by airflow resistance through multi-package components. The aims of this study were therefore to conduct an in-depth experimental investigation of the contribution of grape multi-packaging components to total airflow resistance, cooling rates and patterns of grapes inside the different commercially used multi-packages, and to assess the effects of these multi-packages on table grape postharvest quality attributes. A comprehensive study of moisture loss from grapes during postharvest storage and handling, as well as a preliminary investigation of the applicability of computational fluid dynamics (CFD) modeling in predicting the transport phenomena of heat and mass transfer of grapes during cooling and cold storage in multi-packages were included in this study.
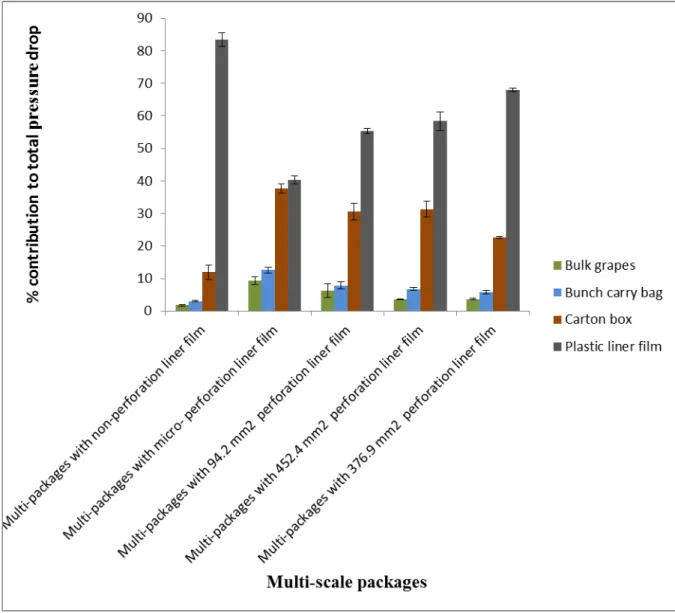
Total pressure drop through different table grapes packages were measured and the percentage contribution of each package component and the fruit bulk were determined. The liner films contributed significantly to total pressure drop for all the package combinations studied, ranging from 40.33±1.15% for micro-perforated liner film to 83.34±2.13 % for non-perforated liner film. The total pressure drop through the grape bulk (1.40±0.01 % to 9.41±1.23 %) was the least compared to the different packaging combinations with different levels of liner perforation.
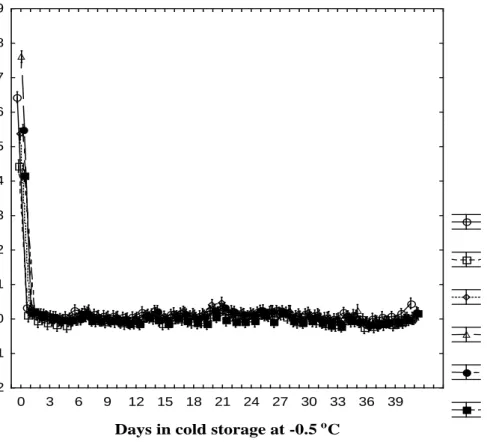
The cooling rates of grapes in the 4.5 kg multi-packaging were significantly (P<0.05) slower than that of grapes in 5 kg punnet multi-packaging, where the 4.5 kg box resulted in a seven-eighths cooling time of 30.30-46.14% and 12.69-25.00% more than that of open-top and clamshell punnet multi-packages, respectively. After 35 days in cold storage at -0.5°C, grape bunches in the 5 kg punnet box combination (open-top and clamshell) had weight loss of 2.01 – 3.12%, while the bunches in the 4.5 kg box combination had only 1.08% weight loss.
During the investigation of the effect of different carton liners on the cooling rate and quality attributes of ‘Regal seedless’ table grapes in cold storage, the non-perforated liner films maintained relative humidity (RH) close to 100 %. This high humidity inside non-perforated liner films resulted in delayed loss of stem quality but significantly (P ≤ 0.05) increased the incidence of SO2 injury and berry drop during storage compared to perforated liners. The perforated liners improved fruit cooling rates but significantly (P ≤ 0.05) reduced RH. The low RH in perforated liners also resulted in an increase in stem dehydration and browning compared to non-perforated liners.
The moisture loss rate from grapes packed in non-perforated liner films was significantly (P<0.05) lower compared to the moisture loss rate from grapes packed in perforated liner films (120 x 2 mm and 36 x 4 mm). The effective moisture diffusivity values for stem parts packed in non-perforated liner films were lower than the values obtained for stem parts stored without packaging liners, and varied from 5.06x10⁻¹⁴ to 1.05x10⁻¹³ m2s-1. The dehydration rate of stem parts was inversely proportional to the size (diameter) of the stem parts. Dehydration rate of stems exposed (without liners) to circulating cold air was significantly (P<0.05) higher than the dehydration rates of stems packed in non-perforated liner film. Empirical models were successfully applied to describe the dehydration kinetics of the different parts of the stem.
The potential of cold storage humidification in reducing grape stem dehydration was investigated. Humidification delayed and reduced the rate of stem dehydration and browning; however, it increased SO2 injury incidence on table grape bunches and caused wetting of the packages.
The flow phenomenon during cooling and handling of packed table grapes was also studied using a computational fluid dynamic (CFD) model and validated using experimental results. There was good agreement between measured and predicted results. The result demonstrated clearly the applicability of CFD models to determine optimum table grape packaging and cooling procedures.
OPSOMMING
Naoes kwaliteit van vars tafeldruiwe word gewoonlik behou deur middel van verkoeling van die produk met koue lug. Ongelukkig word die effektiwiteit van dié verkoeling beïnvloed deur die multivlakverpakking wat kommersieel gebruik word vir die naoes hantering van druiwe. Daar is gewoonlik ruimtelike variasie in die temperatuur van die druiwe wat ongewenste variasie in die kwaliteit van die druiwe veroorsaak tydens naoes hantering en bemarking. Die heterogene druiwetemperature binne die multivlakverpakkings word grootliks veroorsaak deur onegalige lugvloeipatrone van die koue lug as gevolg van die weerstand wat die verskillende komponente van die multivlakverpakkings teen lugvloei bied. Die doel van hierdie studie was dus om ‘n indiepte eksperimentele ondersoek te doen om die
bydrae van multivlakverpakking op totale lugvloeiweerstand, verkoelingstempo’s en –patrone van druiwe binne kommersieël gebruikte multivlakverpakkings te ondersoek, asook
die effek van die multivalkverpakking op die naoes kwaliteit van druiwe te bepaal. ‘n Omvattende studie van vogverlies van druiwe tydens naoes opberging en hantering, asook ‘n voorlopige ondersoek na die bruikbaarheid van ‘n berekende vloei dinamika (BVD) model om die bewegingsfenomeen van hitte en massa oordrag van druiwe tydens verkoeling en koelopberging in multivlakverpakkings te voorspel, was ook by die studie ingesluit.
Die totale drukverskil deur verskillende tafeldruif verpakkingssisteme is gemeet en die persentasie wat deur elke verpakkingskomponent en die vruglading bygedra is, is bereken. Van al die verpakkingskombinasies wat gemeet is, het die voeringfilms betekenisvol tot die totale drukverskil bygedra, en het gewissel van 40.33±1.15% vir die mikro geperforeerde voeringfilm tot 83.34±2.13 % vir die nie-geperforeerde voeringfilm. Die totale drukverskil oor die druiflading (1.40±0.01 % to 9.41±1.23 %) was die minste in vergelyking met die verskillende verpakkingskombinasies met die verskillende vlakke van voeringperforasies.
Die verkoelingstempos van die druiwe in die 4.5 kg multiverpakking was betekenisvol (P<0.05) stadiger as vir die druiwe in die 5 kg handmandjie (‘punnet’) multiverpakking. Die 4.5 kg karton het ‘n seweagstes verkoelingstyd van 30.30-46.14% en 12.69-25.00% langer, respektiewelik, as oop-vertoon en toeslaan-‘punnet’ multiverpakkings gehad. Na 35 dae van koelopberging by -0.5°C het druiwetrosse in die 5 kg ‘punnet’-kartonkombinasies
(oop-vertoon en toeslaan-’punnet’) ‘n massaverlies van 2.01 – 3.12% gehad, terwyl die trosse in die 4.5 kg kartonkombinasie slegs ‘n 1.08% massaverlies gehad het.
In die ondersoek na die effek van verskillende kartonvoerings op die verkoelingstempo en kwaliteitseienskappe van ‘Regal seedless’ tafeldruiwe tydens koelopbering, het die nie-geperforeerde kartonvoerings ‘n relatiewe humiditeit (RH) van byna 100 % gehandhaaf. Hierdie hoë humiditeit in die nie-geperforeerde voeringfilms het ‘n verlies in stingelkwaliteit vertraag, maar het die voorkoms van SO2-skade en loskorrels betekenisvol (P < 0.05) verhoog in vergelyking met geperforeerde voerings. Die geperforeerde voerings het vrugverkoelingstempos verbeter, maar het die RH betekenisvol (P ≤ 0.05) verlaag. Die lae
RH in die geperforeerde voerings het gelei tot ‘n verhoging in stingeluitdroging en –verbruining in vergelyking met die nie-geperforeerde voerings.
Die vogverliestempo uit druiwe verpak in nie-geperforeerde voeringfilms was betekenisvol (P<0.05) stadiger in vergelyking met druiwe verpak in geperforeerde voeringfilms (120 x 2 mm and 36 x 4 mm). Die effektiewe vogdiffusiewaardes vir stingelgedeeltes verpak in nie-geperforeerde voeringfilms was stadiger as vir stingelgedeeltes wat verpak is sonder verpakkingsvoerings, en het gevarieer van 5.06x10⁻¹⁴ – 1.05x10⁻¹³ m2s-1. Die uitdrogingstempo van stingelgedeeltes was omgekeerd eweredig aan die grootte (deursnit) van die stingelgedeeltes. Die uitdrogingstempo van stingels wat blootgestel was (sonder voerings) aan sirkulerende koue lug was betekenisvol (P<0.05) hoër as die uitdrogingstempos van stingels wat verpak was in nie-geperforeerde voeringfilms. Empiriese modelle is gebruik om die uitdrogingskinetika van die verskillende stingelgedeeltes te beskryf.
Die potensiaal van koelkamer humidifisering in die vermindering van die uitdroging van druifstingels is ondersoek. Humidifisering het stingeluitdroging vertraag en het die tempo van stingeluitdroging en -verbruining verminder, maar dit het die voorkoms van SO2-skade op die tafeldruiftrosse verhoog en het die verpakkings laat nat word.
Die bewegingsfenomeen tydens verkoeling en hantering van verpakte tafeldruiwe is ook ondersoek deur gebruik te maak van ‘n BVD model en is bevestig met eksperimentele
resultate. Daar was goeie ooreenstemming tussen gemete en voorspelde resultate. Die resultaat demonstreer duidelik die toepaslikheid van BVD-modelle om die optimum tafeldruifverpakkings- en verkoelingsprosedures te bepaal.
ACKNOWLEDGEMENT
The author would like to thank and acknowledge the following people and organisations for their great contributions:
Prof. Umezuruike Linus Opara, South African Research Chair in Postharvest Technology (SARChI), for his guidance, mentorship, and support through this entire research study
Dr. Mulugeta Delele, Postharvest Technology Research Lab, I am indebted, this study would not been easily accomplished without your great expertise, support, friendship and guidance. Dr. Pankaj Pathare, Postharvest Technology Research Lab, for your assistance during dehydration section of this study.
PPECB for their financial support and allowing me to be further developed through acquisition of new skills.
Postharvest Innovation Programme (PHI-2), for financially supporting the project, ‘Packaging for the Future’, of which this study was part of.
Ms Rebogile Mphahlele and Mr Goodman Sibiya, PPECB, for your tireless assistance in data collection during this entire study, you ensured that all my trials were running smoothly. Ms. Nazneen Ebrahim, Postharvest Technology Research Lab, for assistance in ensuring smooth running of projects, from purchasing project consumables to booking vehicles for collecting fruits.
Dr. Mariana Jooste, Department of Horticultural Science, for all the assistance, guidance and encouragement.
My lovely wife, Phumzile Ngcobo, your support, encouragement and love has enabled me to successfully complete this study.
My beautiful daughter, Ms Mafuzamahle Ngcobo, when the going got tough, your pretty smile gave me a reason to soldier on. May this be symbolic for you as you grow up, that you can accomplish anything in life, as long as you put your heart and mind to it.
Finally I would like to give thanks to the Almighty for it was His will that this study be successfully completed, and for giving me strength and wisdom from day to day.
TABLE OF CONTENTS DECLARATION ... i SUMMARY ... ii OPSOMMING ... iv ACKNOWLEDGEMENT ... vii LIST OF PUBLICATIONS ... x NOTE ... xii 1. General Introduction ... 1 1.1 Introduction ... 1 1.2 Refrigeration ... 1 1.3 Packaging ... 2
1.4 Postharvest quality of horticultural produce ... 3
1.5 Postharvest handling systems performance evaluation methodologies ... 3
1.6 Objectives and outline of the dissertation ... 5
2. Literature Review ... 12
2.1. Introduction ... 12
2.2 Table grapes refrigeration systems ... 15
2.2.1 Pre-cooling system ... 15
2.2.2 Table grape storage system ... 17
2.2.3 Refrigerated trucks, reefer containers and reefer vessels (ships) ... 17
2.2.4 Refrigerated display cabinets ... 19
2.3 Table grape packaging ... 21
2.4 Assessment of pre-cooling, storage and packaging ... 22
2.4.1 Experimental techniques for measuring and quantifying airflow within cold chain .... 22
2.4.2 Mathematical methods used to quantify and predict airflow ... 35
2.5 Table grape postharvest quality defects developing during cold storage and handling ... 39 2.5.1 Moisture loss ... 39 2.5.2 Berry drop ... 40 2.5.3 Decay ... 43 2.5.4 SO2 injury ... 46 2.6 Conclusion ... 47 PAPER 1 ... 68
Resistance to airflow through 4.5 kg multi-scale packaging of table grapes ... 68
PAPER 2 ... 87
Effects of packaging liner films on cooling rate and quality attributes of table grapes (cv. Regal Seedless) ... 87
PAPER 3 ... 111
Performance of punnet multi-packaging for table grapes based on airflow, cooling rates and fruit quality ... 111
PAPER 4 ... 139
Moisture loss characteristics of fresh table grapes packed in different film liners during cold storage ... 139
PAPER 5 ... 162
Moisture diffusivity of table grape stems during low temperature storage conditions ... 162
PAPER 6 ... 183
Investigating the Potential of a Humidification System to Control Moisture Loss and Quality of Table Grapes (cv. ‘Crimson Seedless’) during Cold Storage ... 183
PAPER 7 ... 201
Investigating the effects of table grape package components and stacking on airflow, heat and mass transfer using 3-D CFD modelling ... 201
LIST OF PUBLICATIONS
1. Papers published on international journals:
1.1 Paper 1, published as:
Ngcobo M.E.K., Delele M.A., Opara U.L., Zietsman C.J., Meyer C.J. 2012. Resistance to airflow and cooling patterns through multi-scale packaging of table grapes. Int. J. Refrig. 35 (2), 445-452.
1.2 Paper 2, published as:
Ngcobo M.E.K., Opara U.L., Thiart G.D. 2012. Effects of packaging liners on cooling rate and quality attributes of table grape (cv. Regal Seedless). Packaging Technol. Sci. 25(2), 73-84.
1.3 Paper 3, published as:
Ngcobo M.E.K., Delele M.A., Opara U.L., Meyer C.J. 2013. Performance of multi-packaging for table grapes based on airflow, cooling rates and fruit quality. J Food Eng. 116, 613-621.
1.4 Paper 4, published as:
Ngcobo M.E.K., Delele M.A., Pathare P.J., Chen L., Opara U.L., Meyer C.J. 2012. Moisture loss characteristics of fresh table grapes packed in different film liners during cold storage. Biosystems Eng. 113 (4), 363-370.
1.5 Paper 7, published as:
Delele M.A., Ngcobo M.E.K., Opara U.L., Meyer C.J. 2012. Investigating the Effects of Table Grape Package Components and Stacking on Airflow, Heat and Mass Transfer Using 3-D CFD Modelling. Food Bioprocess Technol. DOI 10.1007/s11947-012-0895-5.
2 Manuscript under review:
2.1 Paper 5, submitted as:
Ngcobo M.E.K., Pathare P.B., Delele M.A., Opara U.L., Meyer C.J. Moisture
diffusivity of table grape stems during low temperature storage conditions. Submitted to Biosystems Engineering.
2.2 Paper 6, submitted as:
Ngcobo M.E.K., Delele M.A., Opara U.L., Meyer C.J. Investigating the Potential of Humidification System to Control Moisture Loss and Quality of Table Grapes during Cold Storage. Submitted to Postharvest Biology and Technology.
3. Conference presentations
3.1 Ngcobo M.E.K., Opara U.L., Thiart Thiart G.D. 2011. Effects of multi-packaging on heat and mass transfer of table grapes during cold storage (Poster). 6th International CIGR Technical Symposium: Towards a sustainable food chain. Nantes, France (18 – 20th April 2011).
3.2 Ngcobo M.E.K., Delele M.A., Opara U.L. Heat transfer and external attributes of ‘Regal seedless’ table grapes inside multi-layered packaging during postharvest cooling and storage. All African Horticultural Congress (AAHC): Horticulture for Humanity. Skukuza, South Africa (15-20 January 2012)
3.3 Ngcobo M.E.K., Delele M.A., Opara U.L. Comparative performance of multi-scale packages with punnets on heat and mass transfer of table grapes. 7th International CIGR Technical Symposium: Innovating the food value chain. Stellenbosch, South Africa (25-29 November 2012)
NOTE
This dissertation presents a compilation of manuscripts where each chapter is an individual entity and some repetition between chapters, therefore, has been unavoidable.
1.
General Introduction
1.1 Introduction
Table grapes and other fruits destined for export are usually consumed in the distant markets at least three weeks after they have been harvested. This brings about the need for postharvest technologies such as cooling to be employed in order to maintain harvest quality. The efficiency and success of cooling and perhaps other postharvest technologies is usually affected by other necessary practices and applications within the value chain. Factors affecting the effectiveness of cooling include the lag time which is the time taken between packing and the start of pre-cooling, package designs (Thompson et al., 1998), and human error.
Table grapes are packed in multi-scale packages and cooled down to -0.5 °C and should be maintained at this temperature for the duration of the value chain. However, grape berries deteriorate during postharvest handling in the cold chain (Nelson, 1978) and this is often ascribed to inefficient cooling, poor temperature management and improper packaging (Thompson et al., 1998). Deterioration of table grapes is characterized by stem dehydration and browning due to moisture loss, decay, berry drop and SO2 injury (Nelson, 1978; Valero et al., 2006). These quality defects could be alleviated through improvements in cooling efficiencies and packaging systems.
1.2 Refrigeration
Cooling is one of the main techniques used to preserve the postharvest quality of horticultural products. This is due to the widely reported ability of low temperatures to reduce biochemical reactions (such as respiration), retard the growth of microbial organisms (Brosnan and Sun, 2001; Arin and Akdemir, 2004) and minimize moisture loss. The relationship between product temperature and biochemical reaction follows van’t Hoff’s rule, which states that the rate of most chemical and biochemical reactions increases two to three times with every 10 degrees rise in product temperature (Hardenburg et al, 1986; Brosnan and Sun, 2001; Kays
and Paull, 2004). Hence, cooling plays an important role in reducing these biochemical reactions.
In many postharvest produce refrigeration systems, cooling is achieved using cold air. This means that during produce cooling heat is transferred primarily by convection and therefore, produce temperature and its homogeneity is largely governed by the patterns of airflow (Smale et al., 2006; Moureh and Flick, 2004; Moureh et al., 2009; Zou et al., 2006). Previous studies have shown significant spatial temperature variability in some food refrigerated systems, with non-uniform airflow implicated as a major cause of this variability (Brosnan and Sun, 2001; Smale et al., 2006). Temperature variability causes quality variation among fruit in the same consignment and promotes postharvest losses and waste.
1.3 Packaging
Packaging has been practiced for as long as fresh produce has been traded (Wills et al., 2007). Its importance in the fresh produce industry has involved two main functions, which are to assemble the produce into convenient units for handling (unitization), and to protect the produce during distribution, storage and marketing. However, modern packages and packaging for horticultural produce are now expected to meet a range of basic requirements such as sufficient mechanical strength and facilitatation of easy disposal, reuse or recycling (Wills et al., 2007). Apart from protecting contents against damage during transportation and distribution of fruit and vegetables, package containers are often used during precooling (Vigneault and Goyette, 2002). To ensure efficient cooling during postharvest handling, the packaging should allow for sufficient airflow (Thompson et al., 1998). However, the combination of packaging and the fruit usually induce some airflow resistance and thus negatively affecting cooling efficiency (Delele et al. 2008). The non-homogeneous flow of the cooling air inside the stack could also cause uneven cooling and product quality (Alvarez and Flick, 1999a, Alvarez and Flick, 1999b, Alvarez and Flick, 2007; Verboven et al., 2006). Many studies have reported on vent-hole ratio, fruit physical properties, and fruit stacking pattern as important components to be considered for improving airflow through fruit packages (Chau et al., 1985; Vingeault and Goyette, 2002). The more vent area there is on packages, the better the airflow through fruit packaging. Depending on the packaging material used to make fruit packages, there is usually a tradeoff between the number of
ventilation holes and package mechanical strength requirements. Vingeault and Goyette (2002) recommended a vent-hole ratio of 25–27% for good airflow through plastic boxes and de Castro et al. (2005) recommended a vent-hole ratio of 8-16% of the surface of the container to optimise the use of energy. There is therefore a need for science based packaging designs (Pathare et al., 2012 see Food and Bioprocess Technology) to ensure efficient airflow and cooling of fruits while fulfilling other packaging requirements for the different postharvest applications.
1.4 Postharvest quality of horticultural produce
The importance of temperature management in maintaining the quality of fresh fruit and vegetables is well documented (Kader, 1992). Apart from the reduction of biochemical reactions associated with fruit senescence, proper cooling reduces the rate of quality and moisture losses of fruit. Poor cooling and cold chain breakages tend to promote produce moisture loss and reduce marketability of fruits and vegetables (Thompson et al., 1998). Previous studies have shown significant loss of firmness and weight from strawberries due to delayed cooling (Nunes et al., 1994; Nunes et al., 1995; Thompson et al., 1998). Table grapes suffer rapid moisture loss if temperatures are not well managed. Moisture loss of grapes manifests as dry and brittle stems which appear just under 2 % of weight loss and berries show signs only after 5% of moisture loss (Thompson et al., 1998). Moisture loss symptoms such as loss of firmness and dull colour in strawberries, as well as stem dehydration and browning in table grapes seriously detract the consumers’ interest of buying affected produce. Good cold chain management is therefore of utmost importance to ensure the marketability and competitiveness of produce in the distant markets.
1.5 Postharvest handling systems performance evaluation methodologies
The performance of postharvest packaging is usually evaluated using experimental methods such as measuring product cooling rates (Chonhenchob and Singh, 2005) and airflow using probes. The commonly used experimental method for the improvement of airflow through postharvest packages is the pressure drop method. Many researchers have used Darcy–
Forchheimer and Ramsin equations to develop correlations to estimate pressure drop through bulk produce and packages containing horticultural produce (Chau et al., 1985; Smale, 2004; van der Sman, 2002; Verboven et al., 2004; Vingeault and Goyette, 2002; Vingeault et al., 2004).
These experimental methods are fairly easy to use; however, they tend to be intrusive and destructive in nature (Ferrua and Singh, 2009). To date, the South African perishable industries utilize such experimental methods for testing postharvest packaging performance and improvements. Although the experimental methods work, they also have limited scope for sustainable packaging design due to high cost of instrumentation and the time required to gather appropriate data for meaningful results (Ferrua et al., 2009). Another limitation is based on the fact that the packaging has to be manufactured before its performance can be tested, thereby increasing costs especially in cases where the manufactured package performs poorly.
Numerical modelling has gained popularity in the past decade within the agricultural and food industry research (Xia and Sun, 2002 and Norton and Sun, 2006). Many researchers have used mathematical modelling methodologies for the design and improvements of horticultural packages (Tanner et al., 2002a; Tanner et al., 2002b) and others have used numerical tools such as computational fluid dynamics (CFD) (Verboven et al. 2006; Zou et al., 2006; Opara and Zou, 2007; Delele et al., 2008; Tutar et al., 2009). However, any numerically developed model would still require experimental validation to ensure its relevance and applicability to a wide range of conditions.
In this study, table grapes are the fruit of interest due to its complex multi-layered packaging system. There are many different multi-package combinations that are used commercially to pack and handle grapes after harvest. Cooling is usually commenced after the grapes have been packed in these multi-packages. However, there are postharvest quality problems such as moisture loss which manifests as stem (rachis) drying and browning, SO2 damage and decay that are reported to be associated with poor postharvest cold chain management (Valero et al., 2006) and these quality defects reduce the marketability of grapes. To mitigate
the problem of poor quality that is mainly ascribed to an inadequate cold chain (Nelson 1978), it is important to improve the cooling airflow through the table grape packaging.
1.6 Objectives and outline of the dissertation
This dissertation aims to investigate the performance of the different grape multi-packages in terms of cooling and fruit quality attributes during postharvest storage and handling for improvement of packaging designs and cold chain performance.
The specific objectives are to:
• Investigate the airflow resistance through the different components of table grape multi-scale packages
• Compare the cooling performance and quality of table grapes in different multi-packages;
• Conduct a comprehensive study of table grape moisture loss in different packages and test the application of drying models in moisture loss from grape stems;
• Investigate the application of postharvest cold storage humidification on the quality of grapes; and
• Investigate the heat and mass transfer processes of packed table grapes using computational fluid dynamics (CFD)
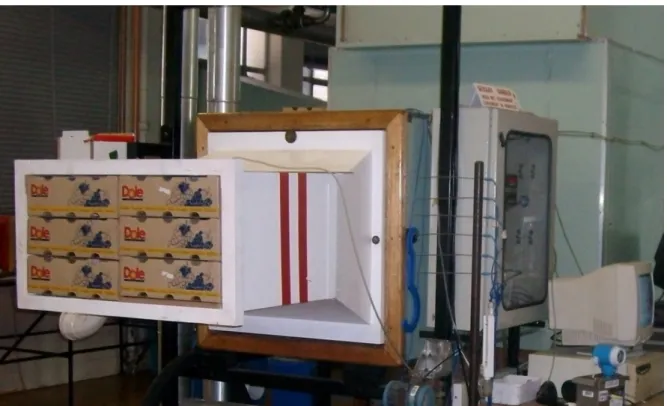
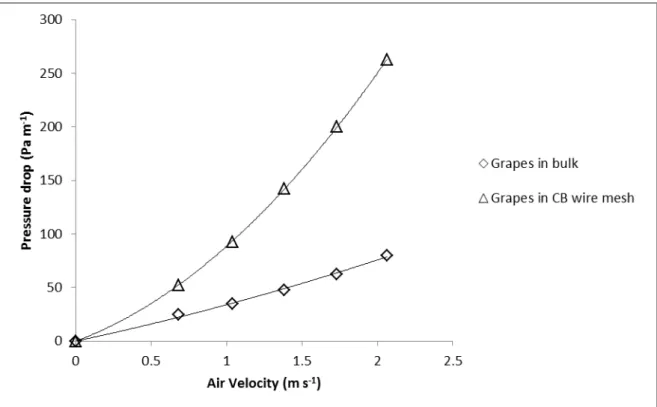
To address the set out objectives, the dissertation is arranged into three parts. The first part covers an in-depth comparative study of performance of different grapes multi-packages in terms of cooling rates and their effects on grapes quality attributes (Papers 1; 2 and 3). In Paper 1, the resistance to airflow by the different table grape multi-package combinations was studied. This is achieved determining the percentage contribution of each grape packaging component and grape bunches to total resistance to airflow of multi-packaging. The pressure drop as a function of incoming airflow is characterized for each packaging component and for the grapes bunches. The different components of the grape multi-packaging included the carton boxes; liner films and bunch carry-bags. Such work has never been reported before for the multi-scale packaging.
Based on the results obtained in Paper 1, the effect of six different liner films on the cooling rates and quality attributes of table grapes is studied in Paper 2. The cooling rates and patterns of grapes inside the different liner films were compared in conjunction with resulting effects on different postharvest quality attributes of grapes namely: grape stem condition; bunch weight loss and berry drop; colour changes; SO2 injury and decay development under both cold storage and shelf-life storage. No study has been reported, that characterizes the postharvest quality defects of grapes to the different multi-packages. Therefore the results from this study give a deeper understanding on the performance of multi-scale packaging of table grapes taking into consideration the postharvest quality of grapes.
Part of Paper 3 is an extension of work done in Papers 1 and 2, where the contribution of grape punnet multi-packaging components to total airflow resistance was investigated (Paper 3). Another part of Paper 3 looks at the cooling rates and patterns of grapes in different multi-packages stacked on pallets. The cooling rates and patterns were also studied in conjunction with changes in grape quality attribute changes.
The second part of the dissertaion covers a comprehensive study of grapes moisture loss (Papers 4; 5 and 6). In Paper 4 the total moisture loss of grape bunches is characterized into individual parts that make up the bunch. The different parts of the bunch include grape berries and stems. However, the stems are further divided into spheres (i.e. cap like structure connecting stems to berries); small; intermediate and large cylinder parts of the stem. No work has been reported in literature on grape moisture loss which considered the different parts that make up the grape bunch individually under cold storage conditions. In Paper 5, the application of drying models is investigated in predicting the dehydration of grape stems during cold storage in multi-packages. In literature no work has been reported on the application of drying models on the moisture loss studies.
In Paper 6, the potential of humidification for controlling postharvest moisture loss is investigated. Previous studies (Lichter et al., 2011), have shown some potential improvements in the control of stem quality and weight loss of some grapes cultivars as associated with an increase in humidity. However, these studies were conducted under high
temperature conditions that prevail during marketing of the grapes in some markets (Lichter et al., 2011). In this study, a humidification system was applied during cold storage conditions.
The third part of the dissertation involves a preliminary investigation of heat and moisture transfer using computational fluid dynamics (CFD) modelling (Paper 7). Table grape multi-packaging is very complex and therefore numerical modelling would be a bit difficult due to the different geometries and boundary conditions that need to be considered to study the flow. However, attempts were made to develop CFD models for heat and mass transfer from grapes in multi-packages during cooling. These models were validated using experimental results obtained from earlier work reported in Papers 1, 2 and 3, and there was a good agreement between the models and the experimental data.
In the last chapter of the dissertation, a general discussion and conclusion of the work is reported.
References
Arin S., and Akdemir S. 2004. Quality properties changing of grapes during storage period. J. Biol. Sci. 4(2), 253-257.
Alvarez, G., and Flick, D. 1999a. Analysis of heterogeneous cooling of agricultural products inside bins. Part I: Aerodynamic study. J. Food Eng. 39, 227–237.
Alvarez, G., and Flick, D. 1999b. Analysis of heterogeneous cooling of agricultural products inside bins. Part II: Thermal study. J. Food Eng. 39, 239–245.
Alvarez, G., and Flick, D. 2007. Modelling turbulent flow and heat transfer using macro-porous media approach used to predict cooling kinetics of stacks of food products. J. Food Eng. 80, 391–401.
Brosnan T., and Da-Wen S. 2001. Precooling techniques and applications for horticultural products. Int. J. Refrig. 24, 154-170.
Chau K.V., Gaffney J.J., Baird C.D., Church G.A. 1985. Resistance to Air Flow of Oranges In Bulk and in Cartons. ASAE. 28 (6), 2083-2088.
Chonhenchob V, and Singh SP. 2005. Packaging performance comparison for distribution and export of Papaya fruit. Packag. Technol. Sci. 18, 125–131.
de Castro L.R., Vigneault C., Cortez L.A.B., 2005. Cooling performance of horticultural produce in containers with peripheral openings. Postharvest Biol. Technol. 38 (3), 254-261.
Delele M.A., Tijskens E., Atalay Y.T., Ho Q.T., Ramon H., Nicolaï B.M., Verboven P. 2008. Combined discrete element and CFD modelling of airflow through random stacking of horticultural products in vented boxes. J. Food Eng. 89, 33-41.
Ferrua M.J. and Singh R.P. 2009. Modeling the forced-air cooling process of fresh strawberry packages, Part I: Numerical model. Int. J. Refrig. 32, 335 – 348.
Hardenburg R, E., Watada A,E., Yi Wang, C. 1986. The Commercial Storage of Fruits, Vegetables, and Florist and Nursery Stocks. U.S. Department of Agriculture.
Kader, A.A., 1992. Postharvest biology and technology: an overview. In: A.A. Kader (Editor), Postharvest Technology of Horticultural Crops. University of California., Division of Agriculture and Natural Resources, Publ., 3311: 1520.
Kays S.J., and Paull R.E, 2004. Postharvest Biology. Exon Press, USA.
Lichter A., Kaplunov T., Zutahy Y., Daus A., Alchanatis V., Ostrovsky V., Lurie S. 2011. Physical and visual properties of grape rachis as affected by water vapour pressure deficit. Postharvest Biol. Technol. 59, 25-33.
Moureh J., and Flick D. 2004. Airflow pattern and temperature distribution in a typical refrigerated truck configuration loaded with pallets. Int. J. Refrig. 27, 464-474.
Moureh J., Tapsoba S., Derens E., Flick D. 2009. Air velocity characteristics within vented pallets loaded in a refrigerated vehicle with and without air ducts. Int. J. Refrig. 32 (2), 220-234
Nelson K.E. 1978. Pre-cooling – its significance to the market quality of table grapes. Int. J. Refrig. 1, 207 – 215.
Norton T. and Sun Da-Wen. 2006. Computational fluid dynamics (CFD) – an effective and efficient design and analysis tool for food industry: A review. Trends Food Sci. Technol. 17, 600 – 620.
Nunes M.C.N., Brecht J.K., Sargent S.A., Morais A.M.M.B. 1994. Physical and chemical quality characteristics of strawberries after storage are reduced by a short delay to cooling. Postharvest Biol. and Technol. 6, 17-28.
Nunes M.C.N., Brecht J.K., Sargent S.A., Morais A.M.M.B. 1995. Effects of delays to cooling and wrapping on strawberry quality (cv. Sweet Charlie). Food Control. 6 (6), 323-328.
Opara L.U. and Zou Q. 2007. Sensitivity Analysis of a CFD Modelling System for Airflow and Heat Transfer of Fresh Food Packaging: Inlet Air Flow Velocity and Inside-Package Configurations. J. Food Eng. 3(5), Article 16.
Smale, N.J. 2004. Mathematical modelling of airflow in the shipping systems: model development and testing. Ph.D. thesis, Massey University, Palmerston North, New Zealand.
Smale N.J., Moureh J., and Cortella G., 2006. A review of numerical models of airflow in refrigerated food applications. Int. J. Refrig. 29, 911 – 930.
Tanner D.J., Cleland A.C., and Opara L.U. (2002a). A generalized mathematical modelling methodology for design of horticultural food packages exposed to refrigerated conditions: Part 2: Heat transfer modelling and testing. Int. J. Refrig. 25, 54 – 65. Tanner D.J., Cleland A.C., and Robertson T.R. (2002b). A generalized mathematical
modelling methodology for design of horticultural food packages exposed to refrigerated conditions: Part 3: mass transfer modelling and testing. Int. J. Refrig. 25, 43 – 53.
Thompson J.F., Mitchell F.G., Rumsey T.R., Kasmire R.F., Crisosto C.H. 1998. Commercial cooling of fruits, vegetables, and flowers. Regents of the University of California. USA
Tutar M., Erdogdu F., Toka B. 2009. Computational modeling of airflow patterns and heat transfer prediction through stacked layers’ products in a vented box during cooling. Int. J. Refrig. 32, 295 – 306.
van der Sman, R.G.M., 2002. Prediction of airflow through a vented box by the Darcy-Forchheimer equation. J. Food Eng. 55, 49-57.
Vigneault C., and Goyette B. 2002. Design of plastic container opening to optimize forced– air cooling of fruits and vegetables. ASAE. 18(1), 73–76.
Vigneault, C., Markarian, N.R., da Silva, A., Goyette, B., 2004. Pressure drop during forced-air ventilation of various horticultural produce in containers with different opening configurations. Trans. ASAE. 47 (3), 807-814.
Verboven, P., Hoang, M.L., Baelmans, M., Nicolai, B.M., 2004. Airflow through beds of apples and chicory roots. Biosystems Eng. 88 (1), 117-125.
Verboven, P., Flick, D., Nicolaï, B.M., Alvarez, G., 2006. Modelling transport phenomena in refrigerated food bulks, packages and stacks: basics and advances. Int. J. Refrig. 29, 985–997.
Valero D., Valverde J.M., Martínez-Romero D., Guillén F., Castillo S., and Serrano M. 2006. The combination of modified atmosphere packaging with eugenol or thymol to maintain quality, safety and functional properties of table grapes. Postharvest Biol. Technol. 41, 317 – 327.
Wills R., McGlasson B., Graham D., and Joyce D. 2007. Postharvest: An introduction to the physiology and handling of fruit, vegetables and ornamentals. University of New South Wales Press Ltd. Australia.
Xia B. and Sun Da-Wen. (2002). Application of computational fluid dynamics (CFD) in the food industry: A review. Comput. Electron. Agric. 34, 5 – 24.
Zou, Q., Opara, L.U., McKibbin, R., 2006. A CFD modelling system for airflow and heat transfer in ventilated packaging for fresh foods: I. Initial analysis and development of mathematical models. J. Food Eng. 77, 1037-1047.
2.
Literature Review
Postharvest handling systems of table grapes and measurement of resistance
to airflow inside horticultural packages
Nomenclature
Abox box face area, m2
Ahole vent hole area, m2
a resistance coefficient, kg s(b-2)m-(b+2)
b resistance exponent
eff
d effective product diameter, m
h
D package hydraulic diameter, m
κ Darcy permeability, m2
p pressure, Pa
O vent hole ratio, %
u velocity vector, m s-1
β Forchheimer drag coefficient, m-1
ε porosity
µ dynamic viscosity
ρ density, kg m-3
2.1. Introduction
Table grapes is the second largest export crop from South Africa consisting of about 45 million cartons exported (PPECB, 2012), and therefore contributes a significant percentage to the South African economy. The fruit is a cluster consisting of stems and berries (Winkler et al., 1974). The stems (rachis, branches, and pedicels), on which berries are borne, constitute 2 to 6 percent of the total weight at maturity, differing with variety. The skin of the berries accounts for 5% to 12% of the total weight and consists of an epidermis which is composed of 6-10 layers of small, thick-walled cells. The skin is covered with a thin waxlike layer know
as cutin which consistitutes about 1-2 % of the total weight of the skin. The cutin consists mainly of oleanolic acid, and long chain alcohols with traces of ester, fatty acids, aldehydes, and paraffins. The cutin protects the berries against water loss and the attack of organisms. The thickness and toughness of the skin differ among varieties and are factors in the degree of resistance of table grapes to handling injury in packaging, transport, and storage (Winkler et al., 1974).
Table grapes are non-climacteric fruit, which means they do not continue to ripen after harvest and for this reason they should be harvested when they reach optimum maturity (Ginsburg et al., 1978; Hardenburg et al., 1986). However, fruit quality tends to deteriorate rapidly during postharvest handling and storage, thus reducing shelf-life during marketing. Deterioration of table grape quality is mainly characterized by weight loss, stem (rachis) dehydration and browning, colour changes, accelerated berry softening, berry drop and high incidence of berry decay due mainly to Botrytis cinerea (Nelson, 1978; Valero et al., 2006). Sulphur dioxide gas (released by SO2 pad) is used to control decay caused by fungi such as
Botrytis cinerea, which grows well in the optimum storage condition [−0.5°C to 0°C, 95%
relative humidity (RH)] for table grape (Ginsburg et al., 1978). However, the presence of SO2 gas may also cause various degrees of injury to the grapes (Zoffoli et al., 2008; Harvey and Uota, 1978).
Cooling is the main technique that is widely employed to reduce postharvest related defects of fresh horticultural produce (Hardenburg et al., 1986). However, cooling efficiencies of produce such as fruit in different packages has been reported as a challenge, which often results in spatial variability of fruit temperature inside packages (Smale et al., 2006; Zou et al., 2006a). This variability of fruit temperature has been reported to cause fruit quality variability (Smale et al., 2006). Cooling of horticultural produce is achieved mainly through forced air cooling (FAC), which means that fruit temperature and its homogeneity is largely governed by the patterns of airflow (Smale et al., 2006; Zou et al., 2006a). It is therefore important that fruit packaging allows sufficient airflow in order to achieve good cooling efficiencies. Table grapes are packed in multi-scale packages to ensure good protection of fruit; however, they still suffer postharvest quality losses during cold storage and handling in the cold chain due in part to effects of packaging and packaging components on airflow patterns and produce cooling rates.
Airflow can be described as the resulting motion of air molecules when subjected to unbalanced forces and pressure differences (Tutar et al., 2009; van der Sman, 2002). During pre-cooling of table grapes, air is forced through the fruit package in response to a pressure gradient between the two sides of pallets. In the subsequent stages of the cold chain, post pre-cooling (FAC) stage, the air is not actively forced through fruit packages due to the aerodynamics of facilities and equipment used, as well as the airflow resistance caused by packaging. Since the target temperature of produce is reached during pre-cooling, the subsequent cold chain stages are required to supply sufficient airflow to maintain low product temperatures and remove respiratory heat. In these latter stages of the cold chain, cooling of packed produce could therefore be achieved primarily through conduction as the cold air circulates around fruit packages rather than being forced through packages (Nelson, 1978).
The cold chain can be segmented into four main refrigerated systems namely: cooling and storage facilities; refrigerated transport which is subdivided into road, sea and air transport; distribution centres and refrigerated displays in super-markets. Once pre-cooled the horticultural products should be handled from one segment of the chain to the next with minimal to no breakages of the cold chain. This requires good temperature management throughout the chain. However, this cold chain requirement is not always adhered to in practice, either due to human error or to poor designs of the refrigeration infrastructure being used. Since temperature homogeneity of products is governed by the patterns of air flow in refrigerated systems (Smale et al., 2006), the knowledge air flow patterns in the different refrigeration systems is imperative for proper packaging designs, cooling efficiencies and good temperature management within the cold chain.
Air flow improvement in different cold chain applications is a well-established research field in postharvest. A lot of work has been reported on the improvement of packaging design, fruit stacking inside packages and stacking patterns of fruit packages on pallets for efficient air flow and cooling (Chau et al., 1985; Haas et al., 1976; Neale and Messer 1976; Neale and Messer, 1978; Verboven et al., 2004; Vigneault and Goyette, 2002; Vigneault et al., 2004; de Castro et al., 2005; Zou et al., 2006a;b ; Ferrua and Singh, 2009b; Tutar et al., 2009). Many
researchers have reported on airflow distribution inside refrigerated storage rooms (Foster et al., 2002; 2003); refrigerated transport (Moureh et al., 2002; Moureh et al., 2004; Moureh et al., 2009c; James et al., 2006) and refrigerated display cabinets (Field et al., 2006; Amin et al., 2009; Amin et al., 2011).
In literature different techniques were used to measure and quantify airflow in the different applications within the cold chain. These techniques are either experimental or predictive. The experimental techniques could be divided into intrusive and non-intrusive techniques (Childs et al., 2000). The main differences between intrusive and non-intrusive techniques lie on the degree of contact between the measuring instrument and the medium being measured. During the intrusive measurement, the measuring device is in direct contact with the medium of interest, e.g. probes and air velocity meters in an air stream; while for the non-intrusive measurement, the medium of interest is observed remotely (Childs et al., 2000). The intrusive methods can be further divided into direct-intrusive and indirect intrusive measuring techniques. Prediction methods include different numerical modelling and simulation.
The objective of this chapter is to review table grape postharvest cold chain handling systems, including techniques used to assess the performance in cold chain systems and table grape postharvest quality defects.
2.2 Table grapes refrigeration systems
Table grape refrigeration systems could be divided into pre-cooling and cold storage; refrigerated transport and display cabinets. The commonality between all these refrigeration systems is that they use cold air as a cooling medium.
Pre-cooling has been defined as the rapid removal of field heat from freshly harvested produce in order to slow down metabolism and reduce deterioration prior to transport or storage (Brosnan and Sun, 2001). During table grape pre-cooling, FAC is used to rapidly remove field heat and this technique has also been referred to as forced convection (Nelson, 1978). The term FAC has been used to describe the cooling of fruits or similar contents of packages by cold air forced through containers by a static head (Guillou, 1960). Storage of grapes for periods from a week to one month requires pre-cooling to the storage temperature of -0.5°C at a relative humidity of 95% and higher if possible (Ginsburg et al., 1978). The pre-cooling is a separate operation from the normal storage in refrigerated room, as most storage rooms designed for holding the produce have neither the capacity nor the air movement needed for rapid cooling (Hardenburg et al., 1986).
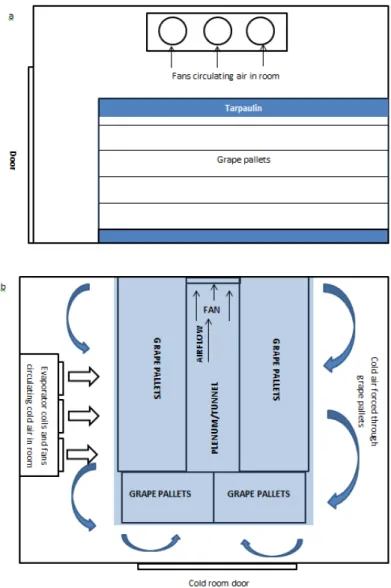
During FAC of table grapes inside refrigerated rooms, fruit pallets are placed in two parallel lanes forming a channel and then a tarpaulin is placed over the top of pallets covering the open channel (Fig. 1b), (Thompson et al., 1998; Ferrua and Singh, 2009a). Following the placement of a tarpaulin over pallets, a fan is sealed against the channel and then switched on to remove air from the channel and thus creating a pressure difference between two sides of the pallets (Fig. 1). Cold air circulating inside the cold room is then forced through the packed products in response to the created pressure gradient and thus convectively cooling the fruit (Thompson et al., 1998). Other pre-cooling facilities are equipped with a racking system, where grape pallets are placed in parallel lanes and with two layers of pallets on top of each other in racks (Fig. 2). In this system the suction fans are situated on top of the tunnel near the roof and the tarpaulin is suspended down from roof to seal off the channel between the two lanes (rows of pallets) (Fig. 2).
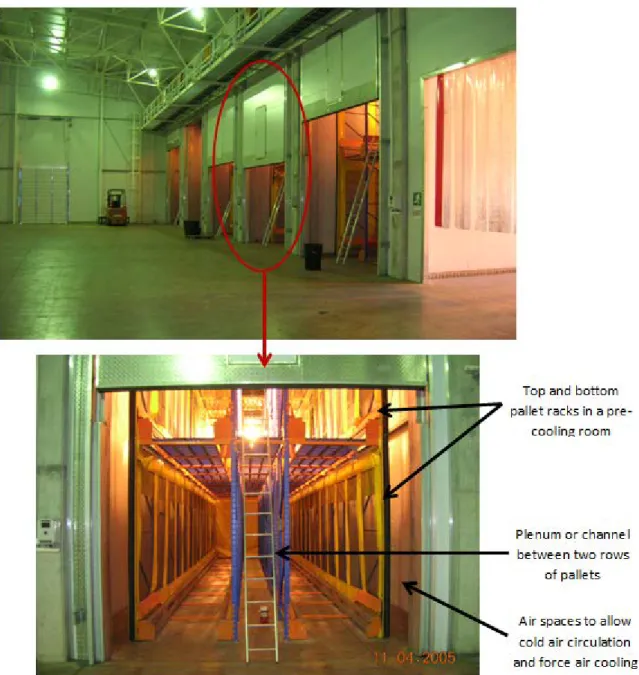
Some of the table grape cold store facilities have a number of small sized rooms (Winkler et al., 1974), holding a few grape pallets at a time (Figure 2). These smaller rooms are often referred to as pre-cooling rooms or tunnels. Other cooling facilities have bigger warehouse-type refrigerated room, where pallets are arranged in a pre-cooling tunnel setup and a number of these pre-cooling tunnels are built in the same refrigerated room. Each tunnel is made up of 18 to 20 pallets on average and they each have individual fans forcing cold air through packages.
2.2.2 Table grape storage system
Although not ideal for table grapes quality, sometimes grapes are stored for some period until either a shipping opportunity becomes available (especially in the production countries) or the buying power of consumers increases (mostly in importing countries and supermarkets). During grape storage, air must be circulated sufficiently to keep a cold storage room at even temperature throughout the room (Hardenburg et al., 1986). Since table grapes are pre-cooled to the desired pulp temperatures prior to cold storage, a high air velocity is unnecessary and usually undesirable. Only enough air movement should be provided to remove respiratory heat and heat entering the room (Hardenburg et al., 1986). A simplified arrangement of a typical cold room is such that cold air is discharged from the evaporator coils into the room with the aid of fans. The evaporators are usually situated near the ceiling of the room, and so the cold air sweeps the ceiling (Fig. 1) and circulates past the produce and is then returned to the evaporator with absorbed heat from the produce (Thompson et al., 1998). Amos (2005), characterised airflow in a commercial cold store and he found that there was an uneven distribution of airflow within the cold store. He reported that the top layers and side columns of bins tended to receive sufficient airflow, while the central positions received lower airflow. The temperature results indicated that the hot spots coincided with the area of lowest airflow (Amos, 2005). Chourasia and Goswami (2007), also found some temperature and airflow variability inside a potato cold store, with some areas showing possible hot and cold spots. Xie et al. (2006), used CFD modelling to study the effect of design parameters (such as corner baffle, the stack mode of foodstuffs, etc.) on the flow and temperature fields of a cold store and they found that all these design parameters, especially the stack mode of foodstuffs, greatly influenced the flow and temperature fields inside the cold store (Xie et al., 2006).
2.2.3 Refrigerated trucks, reefer containers and reefer vessels (ships)
Refrigerated truck trailers do not have enough air flow or refrigeration capacity to cool perishable commodities rapidly (Thompson et al., 1998; Moureh and Flick, 2004). For this
reason table grapes and other horticultural products should always be properly cooled to desired product temperature (-0.5°C for grapes) before loading in refrigerated trucks (Thompson et al., 1998).
Smale et al. (2006) stated that from an aerodynamic perspective, the key characteristic of transport equipment is the placement of both the air delivery and return on the same face. This configuration is almost universally used, as it is practical to place all the refrigerating equipment at one end of the transport unit (Smale et al., 2006). The drawback of this asymmetrical design is the presence of a strong pathway between the two sections, implying high velocities in the front of the refrigerated enclosure (Fig. 3) (Smale et al., 2006; Moureh and Flick, 2004; Moureh et al., 2009c). In addition, the compactness of the cargo and high resistance to airflow due to narrow air spaces between pallets result in an uneven air distribution in the cargo where stagnant zones with poor ventilation can be observed in the rear part of the vehicle (Smale et al., 2006).
Moureh et al. (2009c) characterised air velocity within ventilated packages inside a refrigerated vehicle with or without an air duct. The authors reported that vehicles without air ducts tended to have poor air velocities at rear positions (near doors), while by comparison, the use of air ducts contributes significantly to a more even distribution throughout the container by improving air supply towards the rear, whilst reducing airflow intensity at the front (Moureh et al., 2009c).
Tanner and Amos (2003) reported significant spatial variability in temperature along the length and width of reefer containers during shipping of kiwifruits. Punt and Huysamer (2005) reported that plum pallets positioned near the doors responded poorly to changes in set-point temperature of the reefer container while those positioned near the cooling unit responded well during shipping of plums under dual temperature regimes of -0.5 °C (2 days); 7.5 °C (5 days) and -1 °C (for the remainder of the journey). These results could also be attributed to the aerodynamics of reefer containers where the rear positions (near doors) are associated with poor airflow velocities.
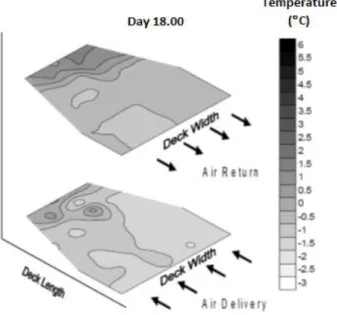
The aerodynamics in reefer vessels (ships) is also similar to that found in reefer containers and refrigerated trailers, where both the delivery and the return air ducts are on the same side. Tanner and Amos (2003) found significant variability in temperatures along the length of the vessel deck (Fig. 4), probably due to compactness of loaded pallets bringing about resistance to airflow. They attributed this temperature variability to a possibility of insufficient airflow in the deck. They also reported that the largest cause of variability in pallet temperature was related to slow rate of cooling after placement in the cargo hold. The results from their study indicated that it took up to 10 days for the kiwi fruit temperatures to reach steady state (Tanner and Amos, 2003).
The resistance to airflow through packed products in refrigerated transport systems could be related to the tight loading arrangement of pallets inside the transport confinement and possibly also the misalignment of the ventilation holes between fruit packages.
2.2.4 Refrigerated display cabinets
In supermarkets, open-type refrigerated display cabinets (RDCs) are used extensively to merchandise perishable food at suitable temperatures (Fig. 5) (Moureh et al., 2009a). A typical RDC consists of a limited container, insulating heat shell and a small refrigerating unit. The refrigeration system controls product storage temperatures by removing all of the heat gain from components of the display case. RDCs operate by circulating cold air around the displayed products (Moureh et al., 2009a). Two or more fans circulate the air through an evaporator heat exchanger from the inlet to the outlet section (Moureh et al., 2009a).
Display cabinets are known to be the weakest link from the cold chain point of view and, therefore, particular attention needs to be paid to their design (Cortella, 2002). The main challenge facing the efficiency of refrigerated display cabinets is to prevent warm ambient air in the supermarket from entering the open display cabinet system, thereby adding the heat load to the display’s refrigeration system and causing inefficient cooling. Refrigerated air curtains (which are cold turbulent air jets) are usually used in open display cabinets of
supermarkets as a barrier between the warm ambient air and the cold refrigerated air (Field and Loth, 2006; Moureh et al., 2009a). Most studies regarding the improvement of efficiency in open refrigerated display cases focus on improving the performance of these air curtains through improvement of cabinet designs (Amin et al., 2011). Amin et al. (2011) studied the effect of variables (such as jet throw angle, height of the opening, airflow rate ratio, etc) on the entrainment and penetration of outside ambient air into the refrigerated cabinet system, and they also investigated the relationship between these variables and the infiltration. They found a strong and direct relationship between jet exit Reynolds number and offset angle. Reynolds number defines how turbulent or laminar the air flow is; the higher the Reynolds number is, the more turbulent the flow becomes. The increase in Reynolds number resulted in an increase in absolute infiltration rate. The offset angle resulted in similar effects on absolute infiltration rate as the Reynolds number. They also reported that although the relationship between infiltration and the tested variables (i.e. jet throw angle, height of the opening, and flow rate ratio), was significant, the effect of each variable was better pictured in combination with other variables (Amin et al., 2011). Amin et al. (2012) studied the effect of what they referred to as ‘secondary variables’ on the efficiency of the air curtain. These secondary variables included the turbulence intensity of the air curtain jet at its discharge nozzle, average percentage of the space between the shelves that was filled with food products, difference between the temperatures of ambient air and the jet at the discharge nozzle, as well as the relative humidity between the aforementioned locations. They found that the temperature and relative humidity changes were of little or no importance, while the turbulence intensity changes infiltration rate almost linearly and the food level (amount of food on shelf) varies it in a nonlinear manner (Amin et al., 2012).
Field and Loth (2006) measured air velocity and temperatures of the air curtains in a refrigerated display case in order to better understand the fluid dynamics which governs the entrainment. The results obtained from their study showed that the entrainment of the ambient air was governed by a variety of eddy engulfing structures. Eddy is defined as the swirling of a fluid (e.g. air) and the reverse current created when the fluid flows past an obstacle. They also reported that the flow measurement results indicated negatively-buoyant acceleration following the jet exhaust, followed by a more linear curtain growth characteristic of isothermal wall jets (Field and Loth, 2006).
Moureh et al. (2009a) studied the use of mist flow whereby fine water droplets are injected into the air curtain to improve the performance of refrigerated display cabinets. They found that the deposition and evaporation of droplets on the surface of products partially compensate the radiative heat gained by the products by removing from it the amount of latent heat of the evaporated droplets (Moureh et al., 2009a).
2.3 Table grape packaging
In order to maximise the cooling efficiency and maintain temperature homogeneity of packed products, the total ventilation areas of fruit packages should be large enough not to restrict the airflow (Pathare et al., 2012). The vent positions should cover most of the walls and the bottom (and the top if the container includes a cover) of the container and not affect the container structure (de Castro et al. 2004; Arifin and Chau 1987; Vigneault and Goyette 2002). Several experimental studies have been reported in the literature to elucidate the influence of different package vent designs on the efficiency of the forced-air precooling process. The importance of these design criteria does not change with the size of the container since vent openings of individual consumer package, reusable box or standard pallet-size container play all the same major role in the efficiency of the cooling process (Émond et al., 1996).
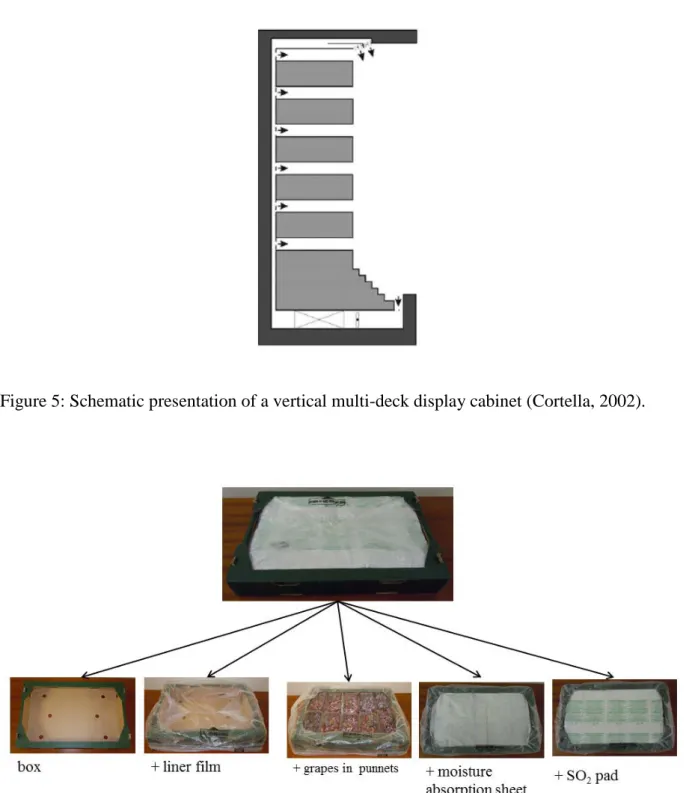
Table grapes are packed in different multi-scale packages (Fig. 6). Most of the published work on table grape packaging has focussed on modified atmosphere packaging (MAP) as an alternative to controlling decay and postharvest quality of grapes (Artés-Hernández et al., 2006; Candir et al., 2012; Costa et al., 2011; Ustun et al., 2012; Valero et al., 2006; Zoffoli et al., 1999). There is, therefore, a very limited knowledge on the effects of table grape multi-packages on resistance to airflow and cooling performance. In literature, the resistance to airflow through fruit packages has largely been related to the amount of vent-hole area of packages, product porosity, and fluid properties (Chau et al., 1985; Haas et al., 1976; Vigneault and Goyette, 2002; Vigneault et al., 2004; Neale and Messer, 1976; Neale and Messer, 1978; Zou et al., 2006a). Based on extensive experimental research, de Castro et al.
(2005) recommended a vent-hole ratio of 8-16% of the surface of the container to optimise the use of energy.
Resistance to airflow may even be higher during table grape cooling due to the fact that grape bunches are packed inside multi-scale packages. These multi-scale packages include the carton boxes with multiple inner packaging materials which include carton liner films, SO2 pad, moisture absorption sheets and bunch carry bags.
2.4 Assessment of pre-cooling, storage and packaging
The assessment of airflow, cooling and moisture loss characteristics within the cold chain systems could be done using experimental and mathematical techniques. This section reviews the principles and application of these techniques.
2.4.1 Experimental techniques for measuring and quantifying airflow within cold chain
The experimental techniques can be subdivided into direct intrusive; indirect intrusive and non-intrusive methods.
Direct intrusive methods
The direct intrusive methods include all techniques that measure airflow directly; however, they are intrusive in nature in that the instruments used for measuring are in direct contact with the air flow fields. These include hot-wire and vane anemometers.
Hotwire anemometer
The “hotwire anemometer” is a well-known transducer and has been used for many years in measuring mean and fluctuating flow velocities (Al khalfioui et al., 2003; Sanyal et al.,
2006). It usually refers to the use of a small (2–5µmin diameter) electrically heated element placed in a fluid with the aim of measuring the flow velocity of that fluid (Al khalfioui et al., 2003). The commonly used wire materials include the platinum, platinum– iridium and tungsten (Sanyal et al., 2006). The hotwire meter may be operated either in constant current or in constant temperature mode (Sanyal et al., 2006). In the first method, an electric circuit is adjusted to feed a constant current to the hotwire. The current and the wire resistance define the power being fed to the wire, which is a function of the flow velocity. The second mode of hotwire operation is known as constant-temperature mode. In a constant-temperature anemometer (CTA), resistance and temperature are maintained at constant values; so when fluid velocity increases the system also increases the current through the sensor to restore equilibrium. Consequently, voltage drop across the element increases, thus giving a voltage signal dependent on fluid velocity (Sanyal et al., 2006).
The principle of constant-temperature anemometry was discovered experimentally in 1909. A thin uniform wire, kept at constant resistance and temperature (by an adjusted continuous electric current) and immersed in a uniform transverse wind, dissipates heat convectively in proportion to the temperature elevation of the wire above that of the passing air, and also in proportion to the square-root of the wind velocity (Anon, 1917).
Hot wire anemometry has a number of qualities, which includes an easy implementation and low cost. However, its main drawback is its high operating temperature as well as its high sensitivity to variations in the fluid temperature (Al khalfioui et al., 2003). Other disadvantages include the intrusive nature of the instrument during measurement, which often disrupt the parameter being measured. This happens either because they induce singular main loss in the air network or they generate some natural convection as a result of their operating temperature (Al khalfioui et al., 2003). In addition, the hotwire anemometer is a local measurement which has to be reproduced many times in order to get a profile of velocity allowing the determination of a volumetric flow (Al khalfioui et al., 2003; Glaniger et al., 2000).
The hot-wire anemometer has been widely used by many researchers to measure airflow during cooling and other applications in the cold chain (Alvarez and Flick, 1999; Irving and Shepherd, 1982; Foster et al., 2002; Hammond et al., 2011; Laguerre et al., 2012; Moureh et al., 2009a; Xie et al., 2006).
Xie et al. (2006) and Foster et al. (2007) used hotwire anemometers to measure the fan outlet velocity and air jet velocity across the width of the air curtain at the door of cold rooms, respectively. Moureh et al. (2009b) used an original experimental technique which consisted of indirect velocity measurement by means of heat transfer analogy for hot wire anemometry. They measured internal macroscopic velocities within porous fruit boxes. Alvarez and Flick, (1999) measured air velocity and turbulence intensity inside fruit bins containing spheres and upstream of the pallets using a constant temperature hot-wire anemometer. However, they found that the use of a single hot wire made it impossible to separate the two components (xandy) of the velocity vector, and another challenge they encountered was that the velocity and turbulence between the spheres could not be measured without removing some spheres, which meant that two rows of spheres had to be removed each time to accommodate the hot wire. This removal of the spheres may have modified the velocity field to some extent (Alvarez and Flick, 1999).
Irving and Shepherd (1982) used hot wire anemometers to measure air circulation rate inside integral refrigerated shipping containers. They found that the hot wire anemometers tended to overestimate the flow rate by 5 to 40% during their experiments (Irving and Shepherd, 1982).
Some researchers used hotwire anemometers to measure the discharge velocity and turbulence across the air discharge grille (ADG) of refrigerated display cabinets (Hammond et al., 2011; Laguerre et al., 2012). Moureh et al. (2009a) also used a constant temperature hot wire anemometer to measure air velocity in a refrigerated display cabinet (RDC). They reported that the hotwire probe could be used to measure the time-averaged velocities, but did not give any information on flow turbulence due to the long response time (2 s).
Vane anemometers
Vane anemometers have been used for many years to measure velocities in ducts (Ower and Pankhurst; 1966), weather stations and ventilation systems. The mechanical instruments are made of rotating blades (vane) which are orientated at an angle to the incoming air stream and pointers moving over a graduated dial marked with scales of feet or metres (Ower and Pankhurst; 1966). The instrument is based on the principle that air forces acting on the vane cause the spindle to rotate at a rate depending mainly on the air speed. However, to determine air speed using the mechanical vane anemometer, a stop watch is required in order to measure time taken for a number of ‘feet or metres of air’, as shown by the indicating mechanism, to pass the instrument’s ducts (Ower and Pankhurst; 1966). Modern digital vane anemometers indicate velocity readings (m/s) directly on an odometer counter, an illuminated screen, or feed an electric signal to a data logging system.
Foster et al. (2002) used mini vane anemometers based on the impeller unit of Krestrel K1001 anemometer (diameter 25 mm) to measure air movement through the doorway of a refrigerated room. Irving and Shepherd (1982) also used vane anemometers to measure air circulation rate inside integral refrigerated shipping containers. They found that the vane anemometers overestimated the flow rate by 10 to 55% during their experiments (Irving and Shepherd, 1982).
Indirect intrusive
The indirect intrusive methods include those techniques that measure the parameters in the flow field that could be correlated to the airflow patterns. They are also intrusive in that the instrumentation used is inside the flow field. The indirect intrusive techniques discussed in this review include the tracer gas methods and thermal tracing methods e.g. thermocouples and compact sensors.
Tracer gases
The tracer gas technique is one of the flow visualisation methods, where the movement of a tracer gas is monitored using instruments rather than by visual observation (Tanner et al., 2000; Smale 2004). The tracer techniques generally involve injecting a tracer gas into a flow path and monitoring concentration changes at numerous sample points. Analysis can involve either calculation of a ‘time of gas arrival’ at each of the sample points or concentrations at the sample points to determine the level of mixing (Smale, 2004). Figure 7 shows a typical tracer method setup. In literature, the choice of tracer gas used in each application has largely been associated with the price, availability, accuracy and response time of the measuring sensors (Sherman, 1990; Smale, 2004). Smale (2004) made a cost comparison and response times of different tracer gas instrumentations.
A good tracer gas should comply with certain requirements in order to successfully study flow systems. According to Sherman (1990), an ideal tracer gas must have some of the following properties:
Safety: the presence of the tracer should not pose a hazard to people, materials, or activities in and around the test area. The tracer therefore should be non-flammable, non-toxic, non-allergenic, etc.
Non-reactivity: because conservation of tracer will be used to infer airflow, the tracer gas should not react chemically or physically with any part of the system under study.
Insensibility: the presence of the tracer should in no way affect the processes that are being studied. Thus, an ideal tracer gas should not affect the airflow or air density of the system.
Uniqueness: an ideal tracer should be able to be recognized from all other constituents of air. In general it should not be a normal constituent of air in which it is being placed, but a tracer with non-zero back-ground may be used provided that the background is stable and additional tracer concentration is significantly larger than the (steady) background.