Emerging Chemical Patterns
for Virtual Screening
and Knowledge Discovery
Dissertation zur
Erlangung des Doktorgrades (Dr. rer. nat.) der Mathematisch-Naturwissenschaftlichen Fakult¨at der
Rheinischen Friedrich-Wilhelms-Universit¨at Bonn
vorgelegt von Jens Horst Auer
aus Mayen
Bonn November 2008
Angefertigt mit Genehmigung der Mathematisch-Naturwissenschaftlichen Fakult¨at der Rheinischen Friedrich-Wilhelms-Universit¨at Bonn.
1. Referent: Univ.-Prof. Dr. rer. nat. J¨urgen Bajorath 2. Referent: Univ.-Prof. Dr. rer. nat. Andreas Weber Tag der Promotion: 21.01.2009
Erscheinungsjahr 2009
Diese Dissertation ist auf dem Hochschulschriftenserver der ULB Bonn unter http://hss.ulb.uni-bonn.de/diss_onlineelektronisch publiziert.
Abstract
The adaptation and evaluation of contemporary data mining methods to chemi-cal and biologichemi-cal problems is one of major areas of research in chemoinformatics. Currently, large databases containing millions of small organic compounds are publicly available, and the need for advanced methods to analyze these data in-creases. Most methods used in chemoinformatics, e.g. quantitative structure-activity relationship (QSAR) modeling, decision trees and similarity searching, depend on the availability of large high-quality training data sets. However, in biological settings, the availability of these training sets is rather limited. This is especially true for early stages of drug discovery projects where typically only few active molecules are available. The ability of chemoinformatic methods to gener-alize from small training sets and accurately predict compound properties such as activity, ADME or toxicity is thus crucially important. Additionally, biological data such as results from high-throughput screening (HTS) campaigns is heavily biased towards inactive compounds. This bias presents an additional challenge for the adaptation of data mining methods and distinguishes chemoinformatics data from the standard benchmark scenarios in the data mining community.
Even if a highly accurate classifier would be available, it is still necessary to evaluate the predictions experimentally. These experiments are both costly and time-consuming and the need to optimize resources has driven the development of integrated screening protocols which try to minimize experimental efforts but still reaching high hit rates of active compounds. This integration, termed “sequential screening” benefits from the complementary nature of experimental HTS and computational virtual screening (VS) methods.
In this thesis, a current data mining framework based on class-specific nomi-nal combinations of attributes (emerging patterns) is adapted to chemoinformatic problems and thoroughly evaluated. Combining emerging pattern methodology and the well-known notion of chemical descriptors, emerging chemical patterns (ECP) are defined as class-specific descriptor value range combinations. Each pattern can be thought of as a region in chemical space which is dominated by compounds from one class only. Based on chemical patterns, several experiments are presented which evaluate the performance of pattern-based knowledge min-ing, property prediction, compound ranking and sequential screening. ECP-based classification is implemented and evaluated on four activity classes for the pre-diction of compound potency levels. Compared to decision trees and a Bayesian
binary QSAR method, ECP-based classification produces high accuracy in pos-itive and negative classes even on the basis of very small training set, a result especially valuable to chemoinformatic problems.
The simple nature of ECPs as class-specific descriptor value range combina-tions makes them easily interpretable. This is used to related ECPs to changes in the interaction network of protein-ligand complexes when the binding confor-mation is replaced by a computer-modeled conforconfor-mation in a knowledge mining experiment. ECPs capture well-known energetic differences between binding and energy-minimized conformations and additionally present new insight into these differences on a class level analysis.
Finally, the integration of ECPs and HTS is evaluated in simulated lead-optimization and sequential screening experiments. The high accuracy on very small training sets is exploited to design an iterative simulated lead optimization experiment based on experimental evaluation of randomly selected small training sets. In each iteration, all compounds predicted to be weakly active are removed and the remaining compound set is enriched with highly potent compounds. On this basis, a simulated sequential screening experiment shows that ECP-based ranking recovers 19% of available compounds while reducing the “experimental” effort to 0.2%. These findings illustrate the potential of sequential screening pro-tocols and hopefully increase the popularity of this relatively new methodology.
Acknowledgments
I am grateful to my supervisor Prof. Dr. J¨urgen Bajorath for his guidance and his support during the work on this thesis. I would like to thank Prof. Dr. Andreas Weber for being so kind as to be my second referee. The preparation of this thesis would not have been possible without the advice and help of all my colleagues at the B-IT. They contributed to a wonderful working atmosphere and created many unforgetable moments. Special thanks goes to Ingo Vogt with whom I shared the office for the last three and a half years. He has been a vital partner for scientific and private discussions. I owe many thanks to Martin Vogt and Lisa Peltason for proof-reading. My scientific work has also benefited from collaborations with Eugen Lounkine, Ingo Vogt and Hany E. Ahmed.
Finally, I would like to thank my mother and my family for their support during the last years, especially my girlfriend Heike Woyk who also provided valuable hints for the language and style of my thesis.
List of abbreviations
ADME Absorption, Distribution, Metabolism, and Excretion BIN Binary Qunatitaive Structure-Activity Relationship BZR Benzodiazepine Receptor
DHFR Dihydrofolate Reductase DT Decision Tree
ECP Emerging Chemical Pattern EP Emerging Pattern
GSK3 Glycogen Synthase Kinase-3 Inhibitors HIVPROT HIV Protease Inhibitors
HTS High-Throughput Screening
JECP Jumping Emerging Chemical Pattern JEP Jumping Emerging Pattern
IC50 Half Maximal Inhibitory Concentration
MOE Molecular Operating Environment
QSAR Quantitative Structure-Activity Relationship RMSD Root Mean Square Deviation
TDZD Thiadiazolidinone
TPSA Total Polar Surface Area VS Virtual Screening
Contents
1 Introduction 1 1.1 Related work . . . 3 1.2 Research topics . . . 4 1.3 Thesis Outline . . . 7 2 Methodology 9 2.1 Chemical Descriptors . . . 92.1.1 Descriptor Set 1: 61 Type I and II Descriptors . . . 11
2.1.2 Descriptor Set 2: Type III Descriptors . . . 11
2.1.3 Descriptor Discretization . . . 12
2.2 Mining Emerging Patterns . . . 14
2.2.1 Mining Patterns Related to the Rule of Five . . . 14
2.2.2 Formal Definition of Emerging Chemical Patterns . . . 15
2.2.3 Mining Algorithms . . . 18
2.2.4 Classification . . . 19
2.3 Emerging Chemical Patterns . . . 19
3 ECP Data Mining and Classification 23 3.1 Data Mining for Conformational Differences . . . 23
3.1.1 Data Set . . . 25
3.1.2 Methodology . . . 28
3.1.3 Differences Between Modeled and Bioactive Conformations 29 3.1.4 Class-based Pattern Mining . . . 30
3.1.5 Structural Interpretation of ECPs . . . 32
3.2 ECP Classification . . . 43
3.2.1 Data Set . . . 43
3.2.2 Evaluation . . . 46
3.3 Discussion . . . 53
4 Integration of Virtual and High-Throughput Screening 57
4.1 Simulated Lead Optimization . . . 59
4.2 Simulated Sequential Screening . . . 61
4.2.1 Screening Calculations . . . 64
4.2.2 Pattern Distribution and Composition . . . 68
4.2.3 Screening Performance . . . 69
4.2.4 Dynamic Interaction of VS and HTS . . . 72
4.3 Discussion . . . 77
5 Summary and Conclusion 79 A Chemical Descriptors 83 A.1 61 Uncorrelated Descriptors . . . 83
A.2 3D Descriptors for Conformation Anaylsis . . . 85
B Simulated Lead Optimization 87
C Simulated Sequential Screening 95
D Patterns for Conformation Analysis 97
List of Figures
2.1 Most Expressive Jumping Emerging Pattern . . . 17
2.2 Classification Using JEPs . . . 20
3.1 Exemplary Bioactive and Modeled Conformations . . . 27
3.2 Adenosine Deaminase Binding Site with Bioactive Ligand Confor-mations . . . 34
3.3 Adenosine Deaminase Protein-Ligand Interactions . . . 35
3.4 Ribonuclease A Binding Site with Bioactive Ligand Conformation 37 3.5 Ribonuclease A Protein-Ligand Interactions . . . 39
3.6 Trypsin Binding Site with Bioactive Conformation . . . 41
3.7 Trypsin Protein-Ligand Interactions . . . 41
3.8 Potency Distribution within Compound Activity Classes . . . 44
3.9 Representative Structures for ECP Classification . . . 45
3.10 Top ten Compounds of an individual GSK3 trial . . . 49
4.1 Sequential Screening . . . 58
4.2 Simulated Lead Optimization . . . 60
4.3 Results for Simulated Lead Optimization . . . 62
4.4 Structures of the 12 Most Active DHFR Inhibitors . . . 65
4.5 Most Prominent Descriptors for Sequential Screening . . . 69
4.6 Average Recovery Rates Over 100 Independent Screening Trials . . 71
4.7 Hit Rate for Three Simulated Sequential Screening Runs . . . 72
B.1 Decision Tree Simulated Lead Optimization . . . 87
B.2 Binary QSAR Simulated Lead Optimization . . . 91
C.1 32 DHFR Inhibitors . . . 95
List of Tables
2.1 Classification of Molecular Descriptors . . . 10
2.2 Artificial Sample Data Set . . . 14
2.3 Emerging Patterns for Table 2.2 . . . 15
3.1 Inhibitors, Modeled Conformers, and Discriminatory Patterns . . . 26
3.2 ECPs Discriminating Binding from Modeled Conformations . . . . 30
3.3 Discriminatory Patterns for Adenosine Deaminase Inhibitors . . . 36
3.4 Discriminatory Patterns for Ribonuclease A Inhibitors . . . 38
3.5 Discriminatory Patterns for Trypsin Inhibitors . . . 40
3.6 Compound Classes and Potency Levels . . . 44
3.7 JECPs for Activity Class GSK3 . . . 47
3.8 Comparison of Classification Methods . . . 52
3.9 Prediction Accuracy for Very Small Training Sets . . . 53
4.1 Average ECP Results Over 100 Independent Screening Trials . . . 71
4.2 Top 10 ECP Trials for Selection Sets of 10 Database Compounds . 73 4.3 Top 10 ECP Trials for Selection Sets of 100 Database Compounds 74 4.4 Top 10 ECP Trials for Selection Sets of 500 Database Compounds 75 A.1 61 Uncorrelated Type I and II Descriptors . . . 83
A.2 Type III Descriptor Set . . . 85
D.1 Discriminatory Patterns for Acetylcholine Esterase Inhibitors . . . 97
D.2 Discriminatory Patterns for Carbonic anhydrase Inhibitors . . . 98
D.3 Discriminatory Patterns for Carboxypeptidase Inhibitors . . . 98
D.4 Discriminatory Patterns for Cyclin-dependent Kinase Inhibitors . . 99
D.5 Discriminatory Patterns for Elastase Inhibitors . . . 99
D.6 Discriminatory Patterns for Endothiapepsin Inhibitors . . . 100
D.7 Discriminatory Patterns for Factor Xa Inhibitors . . . 100
D.8 Discriminatory Patterns for FK506 Binding Protein Inhibitors . . . 101
D.9 Discriminatory Patterns for HIV Protease Inhibitors . . . 101
D.10 Discriminatory Patterns for Plasminogen Activator Inhibitors . . . 102
D.11 Discriminatory Patterns for Protein Tyrosine Phosphatase 1b
In-hibitors . . . 102
D.12 Discriminatory Patterns for Protocatechuate3,4-dioxygenase In-hibitors . . . 103
D.13 Discriminatory Patterns for Thermolysin Inhibitors . . . 103
D.14 Discriminatory Patterns for Thrombin Inhibitors . . . 104
1 Introduction
Machine learning algorithms are widely used in chemoinformatics for the predic-tion of compound properties, including physicochemical properties like logP or biological activity. Adapted algorithms include partitioning methods (Rusinko et al., 1999; Stahura and Bajorath, 2003), clustering algorithms (Feher and Schmidt, 2003; Tamura et al., 2002), neural networks (Keser¨u et al., 2000; Sad-owski, 2000), Bayesian models (Labute, 1999; Vogt et al., 2007), decision trees (Rusinko et al., 1999; Stockfisch, 2003) and kernel based methods (Geppert et al., 2008; Harper et al., 2001; Jorissen and Gilson, 2005).
The recent increase in available data for pharmaceutical or biological purposes drives the need for efficient data mining tools to explore, manipulate and analyze these data sets. Commercial data sources, e.g. the MDL drug data report data-base1 or the Wombat database (Olah et al., 2004) and public efforts such as Pub-Chem2 or the ZINC database (Irwin and Shoichet, 2005) collect large amounts of data about organic compounds. PubChem now contains 40 million records about 19 million unique structures including information from more than 1000 biological assays, and the ZINC database contains∼8 million compounds in total and ∼5 million drug-like molecules. Libraries like the MDDR or the Wombat library have also introduced a qualitative advancement in their collection of veri-fied information about compounds from sources like patent information or journal publications. However, the fraction of experimentally tested compounds remains extremely small compared to the estimated number of possible organic molecules (Kirkpatrick and Ellis (2004) cite an estimate of more than 1060 potential small organic molecules) even though high-throughput screening (HTS) technology has made dramatic advances in the last years and enabled the automatic screening of millions of compounds for desired properties in a short time. Faced with this large amount of data, the application of contemporary data mining algorithms is becoming one of the fundamental topics in chemoinformatic research. Tradition-ally, chemoinformatics has borrowed algorithms such as clustering or partitioning
1
MDL Drug Data Report from MDL Information Systems, San Leandro, CA, USA. Available
athttp://www.mdl.com/products/knowledge/drug_data_report/
2
http://pubchem.ncbi.nlm.nih.gov
2
from the data mining community and invented new approaches such as similarity searching based on molecular fingerprints. Many of these algorithms are used to select small subsets from large compound libraries which have a high probability to show desired properties, e.g. activity against a target.
This thesis presents the adaptation of a recently developed pattern mining framework to chemoinformatic problems. It adapts the emerging pattern (EP) mining algorithms to molecular data by using discretized molecular descriptors as attributes. EP mining finds class-specific combinations of attributes with high frequency in a home class but low occurence in a background data set. In this way, class-specific knowledge about molecules will be encoded as combinations of descriptor value ranges. Each combination can be thought of as a class-specific chemical descriptor space dominated by compounds from one class only. Appli-cations of the EP mining framework include molecular classification, ranking and knowledge mining on conformational data sets.
Besides introducing a new data mining method into the chemoinformatics re-search area, special attention is paid to possible efficient integration of computa-tional and experimental methods. Both research areas, computacomputa-tional chemistry or chemoinformatics and the experimentally HTS technology, have made dramatic advances in the last years. It is now possible to automatically screen millions of compounds in reasonable time. However, an undirected brute-force search is very likely to waste valuable resources by inspecting many unpromising compounds. Computational methods are in a sense orthogonal to experimental methods. With computational means, it is possible to screen even larger compound libraries in short time and to access compounds which are not available for experimental testing. Traditionally, both methods are used exclusively (experimental testing is of course also used to validate virtual screening (VS) results). It has been pro-posed that an integration of computational and experimental efforts leads to an improvement in screening methodology by reducing the experimental effort while achieving significant hit rates of active compounds (Bajorath, 2002). Although proposed several years ago, the integrated “sequential screening” paradigm is far from being implemented in standard drug discovery projects and lacks evalua-tion studies. The second part of this thesis is concerned with two “experiments” exploring the potential of sequential screening.
CHAPTER 1. INTRODUCTION 3
1.1 Related work
The application of data mining algorithms to search for hidden knowledge in the form of combinations of features has a long history in chemoinformatics and re-lated fields such as bioinformatics. Given the long tradition of string algorithms in bioinformatics, it is not surprising that many prominent examples are actu-ally string mining methods. Frequent substring mining approaches are used to find repetitive structures such as common subsequences in proteins. These algo-rithms can be efficiently implemented using suffix trees (Gusfield, 1997). Recently, Fischer et al. (2006) have introduced linear-time algorithms to find emerging sub-strings, i.e. substrings frequent in one set but rare in another set of strings.
In chemoinformatics, pattern mining is used in a more general sense than the common data mining concept of frequent pattern mining. Most applications of pattern mining algorithms focus on the discovery of frequent or common sub-structures of sets of molecules. Nicolaou and Pattichis (2006) review the most important algorithms for molecular substructure mining. All these algorithms compute frequent substructures for a set of molecules. However, they do not take class information, e.g. activity, into account and thus cannot be used to compute common substructures which are specific for sets of active compounds in contrast to a background database. Ting and Bailey (2006) present an application of a hypergraph based algorithm which is also used to compute emerging patterns to compute class-specific emerging subgraph patterns. Common to all graph-mining algorithms is that they are computationally expensive and only applicable for small data sets.
Related to common substructure mining, fragment based approaches are some-times used to find common fragments in sets of compounds. In contrast to substructure mining, fragment-based methods typically use a set of predefined fragments to screen a database of molecules. A simple example of a fragment-based approach is the MACCS structural keys fingerprint which assigns to each molecule a bit vector accounting for presence or absence of 166 structural frag-ments. Substructure mining and most fragment-based approaches do not consider combinations of substructures, but are only concerned with the identification of frequent single structural entities. Fragment-based methods are sometimes used to find combinations of class-specific fragments, but they usually use only small combinations of fragments (Lounkine et al., 2008). Sometimes, statistical sam-pling (Lameijer et al., 2006) is used to cut down computation time and escape the problem of exponential growth of possible fragment combinations. Both methods
1.2. RESEARCH TOPICS 4
further restrict the number of fragments by breaking molecules into chemically reasonable parts of ring systems, linkers and side chains. Lameijer et al. (2006) then count co-occurrence of fragments in a stochastic experiment without includ-ing a background database. The experiments described by Lounkine et al. (2008) are closely related to emerging pattern mining since they show how formal con-cept analysis can be used to interactively construct queries on sets of fragments computed from compounds with associated selectivity data. Initial evaluations have shown that typical fragment combinations consist of only a handful of frag-ments and thus the search is restricted to use only four fragfrag-ments at most. It is shown that these combinations of fragments are highly specific for activity classes and thus using a data mining approach to compute class-specific descriptor value combinations seems a promising and reasonable idea.
In a way, similarity searching algorithms like DynaMAD (Eckert and Bajorath, 2006) and CA-DynaMAD (Vogt and Bajorath, 2008) are similar to emerging pattern mining. CA-DynaMAD heuristically computes class-specific combinations of descriptor value ranges which are then used for assessing the probability of test compounds for being active against the same target as the molecules in the training set. Both algorithms first rank class-specific descriptor value ranges3 based on the number of (inactive) database compounds matched by this value range. For classification, they iteratively eliminate database compounds which do not match the top-ranking descriptor value ranges, traversing the descriptors in descending order. The implementation differs, but both methods result in a small set of potentially active compounds and a corresponding descriptor value range set which includes all descriptors used in the iterations. This descriptor set can be interpreted as a class-specific chemical reference space. However, these algorithms do not use data mining methods to explore possible combinations of descriptors, but heuristically select the next descriptors on the basis of their score.
1.2 Research topics
This thesis investigates how current pattern mining methods can be used in drug discovery research. More specifically, it is concerned with the application of pattern mining technologies computing class-specific combinations of discrete attributes to chemical knowledge mining, classification and ranking. The adapta-tion of data mining algorithms is also an interesting experiment from a computer
3The min. and max. values for a descriptor in the active training set are used as the class-specific descriptor value range (min, max).
CHAPTER 1. INTRODUCTION 5
science point of view. Data sets such as results from biological screening cam-paigns are different from the standard benchmark sets used in the data mining community. First, most screening data sets contain intrinsic errors. Experimen-tal screens are often influenced by side effects in an unpredictable way. A data mining methodology must be able to handle error-prone noisy data. Another challenge for data mining algorithms results from the knowledge distribution of active and inactive compounds. Usually, the number of active compounds is much smaller than the number of inactives with differences of several orders of magni-tude. This is especially true for the early stages of drug design projects where typically only a handful of known active compounds are available. A data mining method must be able to generalize well from such a small number of active tem-plate compounds, but still be specific enough to minimize the false-positive rate. Even the simplest classification possible, which would predict all compounds to be inactive regardless of their properties, would yield a high accuracy! A useful chemoinformatic method must be aware of this intrinsic bias and predict activ-ity (or other properties) with high accuracy for both active and inactive cases. In addition to these raw class distribution problems, chemoinformatics data sets often have an additional structural bias. Most data sets are constructed during compound optimization projects by chemical modification and experimental test-ing. Thus, they contain series of analogue structures which are very similar in their constitution and features. This places an additional bias in the data set to-wards compounds with similar structure and makes generalization to structurally different compounds hard to accomplish.
The adaptation of the EP framework poses three questions which are central for this thesis:
Question 1: How can pattern mining-based knowledge be rationalized at the molecular level?
One of the benefits of pattern-based knowledge mining is the easy interpretation of the computed knowledge in form of class-specific combinations of attributes. One of the earliest applications of pattern-mining has been the analysis of cus-tomer shopping baskets (Agrawal et al., 1993) and the resulting patterns could be rationalized by typical customer behavior, e.g. people tend to buy milk and bread in combination. In chemoinformatics and drug discovery, researchers are mostly concerned with structural features of ligands and their interaction with their target protein. Successful pattern mining should lead to patterns which can
1.2. RESEARCH TOPICS 6
well be rationalized chemically by relating the descriptors included in the pattern to changes in the interactions upon formation of the protein-ligand complex.
Question 2: How does a pattern-based classifier perform on biological data?
This question is directly related to the adaptation of the pattern mining frame-work as a chemoinformatic tool. Chemical compounds must be represented in a way that can be used by pattern mining algorithms, meaning transformation of chemical information into nominal attributes.
In chemoinformatics, the focus of computational methods is often on early dis-covery of active compounds instead of maximizing redis-covery rates. This is often done by ranking large databases (compound libraries) and testing only a small fraction of the top-ranked compounds. The standard method here is similar-ity searching, commonly done by using bit-string representations of compounds known as fingerprints (Auer and Bajorath, 2008). However, fingerprints are not class-specific and the creation of class-specific similarity search methods is one of the major research goals. The adaptation of a pattern-based data mining method as a ranking tool would be a major contribution to similarity searching methods.
Question 3: Is it possible to integrate computational and ex-perimental methods in an efficient way such that both meth-ods benefit from the integration?
Virtual Screening and experimental screening are complementary methods having specific strengths and weaknesses (Bajorath, 2002). A tight integration of both methods into a single screening protocol is expected to dramatically reduce the experimental effort while keeping high and early recovery (Bleicher et al., 2003). How this integration can be established is still a question of research.
The proposed integration is relatively new and only few experiments have been reported yet which analyze the results of such a method. Most of these experi-ments solely analyze the performance in terms of active compound recovery but do not look at the dynamic interplay of computational and experimental screening. The availability of many HTS data sets released by PubChem makes it possible to simplify integration experiments to pure computational experiments by replacing the HTS screening phase with a simulated step based on real HTS data. In this way, statistically valid experiments can be designed which can then be thoroughly evaluated.
CHAPTER 1. INTRODUCTION 7
1.3 Thesis Outline
Chapter 2 introduces the fundamental concepts of ECP mining. EPs have been
introduced recently in the data mining field by Dong et al. (1999a) and are adapted to chemoinformatics by representing molecules using molecular descriptors. Since ECP mining algorithms only work on discrete data ( opposite to the continuous nature of most chemical descriptors), the chapter also describes standard dis-cretization techniques to transform continuous descriptors into sets of discrete, non-overlapping value-ranges. The chapter includes an introduction to EP min-ing usmin-ing the well-known example of Lipinski’s Rule of Five (Lipinski et al., 2001) to characterize drug-like compounds and a formal definition of these patterns as combinations of class-specific descriptor value ranges. It also gives a short de-scription of the algorithms used in the experiments.
Chapter 3 evaluates the emerging chemical pattern approach as a tool for
chemoinformatic knowledge mining and property prediction. It shows how ECPs are used to analyze and rationalize differences between bioactive and modeled lig-and conformations, which answers the first research question. Compounds from 18 target classes for which crystallographic data of the binding conformations are available are subjected to a stochastic energy minimization. Binding and computed conformations are joined into a database which is then mined for dif-ferentiating ECPs. The computed patterns are rationalized on a molecular basis by analyzing differences in the interactions of the protein-ligand complexes found in the crystallographic data and a hypothetical protein-ligand complex built by superposing the minimized conformation on the crystallographic binding confor-mation. Patterns described specific differences in the conformations leading to different interaction patterns.
The second research question is addressed by exploring the possibilities of molec-ular classification of active vs. inactive compounds using ECP-based classifiers. ECP-based classification using 61 descriptors derived from 1D or 2D information performs equally well as established binary classification methods. It is further pointed out that the exploration of the exponential space of possible descriptor value range combinations leads to classifiers which allow highly accurate classifi-cation when the training sets are as small as six compounds (three compounds per class).
Chapter 4 focuses on the possible integration of HTS and VS methods and shows
1.3. THESIS OUTLINE 8
compounds with similar biological properties as given by a training set, thus ad-dressing the last research question. Two examples of iterative computational and experimental screening protocols are described. The first simulates a possible it-erative lead-optimization experiment which optimizes a set of compounds with respect to potency. Sequential screening is then shown to be an efficient method-ology integrating computational and experimental screening methods.
Chapter 5 summarizes and discusses the results. The findings in the previous
chapters are discussed with respect to the three research questions stated above. Important aspects of each experiment are related to each of the research questions and the implications are discussed. Finally, the thesis is summarized in short.
2 Methodology
Chemoinformatics has always been concerned with the application of new data mining algorithms to analyse chemical and biological data and predict proper-ties of molecules. In this thesis, a recent pattern-based approach is adapted to chemoinformatics by using molecular data in the form of chemical descriptors. Details of the data mining method and the adaptation to chemistry are described in the remaining parts of this chapter. It starts with the introduction of chemical descriptors as the basis for molecular representation. After introducing and for-mally defining pattern-mining, emerging chemical patterns (ECP) are defined as class-specific combinations of descriptor value ranges.
2.1 Chemical Descriptors
Molecules are represented as entries in databases, associated with numeric at-tributes which encode molecular properties. These properties are generally called molecular or structure descriptors. Terfloth (2003) defines structure descriptors as “a mathematical representation of a molecule resulting from a procedure trans-forming the structural information encoded within a symbolic representation of a molecule”. Simple examples of such a mathematical representation are molecular weight or formal charge which can be easily computed from the chemical formula of a compound. These descriptors are easy to compute, but might not provide useful information about the compounds. Many researchers have defined chemical descriptors for different tasks with different levels of information and complexity. The Dragon software1 currently implements more than 3200 different descriptors.
The Handbook of Molecular Descriptors (Todeschini and Consonni, 2000) lists de-tails and definitions for these descriptors. Table 2.1 divides these descriptors into five categories. Categories I-III relate to the molecular representation needed to compute the descriptor value. Category IV includes descriptors which make use of experimental data, e.g. measured binding affinities and category V includes com-plex descriptors which are derived from combinations of other descriptors. Given the limited amount of available experimental data, it is obvious that descriptors
1
TALETE srl,http://www.talete.mi.it/dragon.htm
2.1. CHEMICAL DESCRIPTORS 10
Table 2.1:Classification of molecular descriptors. Molecular descriptors are partitioned into five classes based on the molecular information needed for their computation (Auer and Bajorath, 2008).
Type Derived from Examples
I Global (bulk) molecular properties (estimated) logP(o/w), atom counts II 2D structure (molecular graph) structural keys, connectivity indices III 3D structure surface properties, radius of gyration IV Biological properties affinity fingerprints
V Combination of descriptors BCUT
of category IV are usually not available although using such data is expected to improve the pure computational methods.
Since the biological activity of compounds is strongly influenced by 3D prop-erties such as complementary molecular shape of ligands and binding pockets, it would be expected that 3D descriptors are generally more sensitive to biological activity than simpler representations. However, this is not necessarily the case. Numerous studies indicate that 2D information is often sufficient to produce ac-curate results (Brown and Martin, 1996; Xue and Bajorath, 2002). In addition, 2D representations are typically much less prone to errors than calculated 3D representations. This is due to the lack of experimentally determined 3D confor-mations of bound ligands and the insufficiency of computational methods to model these conformations. However, when 3D information is available, type-III descrip-tors provide much information about compounds and are certainly high-quality features worth to be used.
The different experiments presented in this thesis use two different sets of de-scriptors. First, a knowledge-mining experiment is described which uses type III descriptors to investigate differences between different conformations of com-pounds, namely conformations in binding mode and computationally generated conformations. A second set of experiments is concerned with classification and ranking of compounds based on their activity. These experiments utilize only 2D information in the form of type I and II descriptors. Both descriptor sets are described in the next two sections. The complete lists of descriptors, including a short description of each descriptor and reference information is listed in tables A.1 and A.2 in appendix A.
CHAPTER 2. METHODOLOGY 11
2.1.1 Descriptor Set 1: 61 Type I and II Descriptors
The first set of descriptors consists of 61 uncorrelated type I and II descriptors se-lected with minimized pairwise correlation and maximized information content in a database of 1.34 million compounds (Xue et al., 2003). This set contains eleven type I descriptors: logP(o/w), abbreviated as logP, total polar surface area TPSA and 9 atom counts, e.g. the number of fluorine (a nF) or chlorine atoms (a nCl). Most of the remaining 50 descriptors are type II descriptors computed from the connectivity information encoded in the molecular graph. This set contains four bond counts, four connectivity indices and adjacency matrix descriptors, eight pharmacophore descriptors, 17 subdivided surface area descriptors and 17 partial charge descriptors. The minimization of pairwise correlation effects has also pos-itive effects on the run time of the computations because the complexity of data mining algorithms depends on the dimensionality of the data. The list of all 61 descriptors is given in appendix table A.1.
2.1.2 Descriptor Set 2: Type III Descriptors
The second descriptor set consists of a total of 67 conformation-dependent (type III) descriptors available in the molecular operating environment (MOE) (Chem-ical Computing Group Inc., version 2007.09). It includes a variety of type III descriptors belonging to five categories: energy, shape, and charge distribution descriptors, molecular surface properties, and volume-dependent descriptors. A subset of these descriptors including, for example, heat of formation, ionization potential, and highest-occupied molecular orbital (HOMO) or lowest unoccupied molecular orbital (LUMO) energies was calculated through MOE’s interface with MOPAC (Stewart, 1990) and the semi-empirical AM1 (Dewar et al., 1985), PM3 (Dewar and Thiel, 1977) and MNDO (Stewart, 1989) methods. Partial charge and potential energy descriptors were calculated with a MOE-internal modified ver-sion of the Merck molecular force field (MMFF94) (Halgren, 1996a,b,c,d; Halgren and Nachbar, 1996). The MOE implementation treats conjugated nitrogens as planar atoms instead of tetrahedral atoms. The radius of gyration (rgyr) serves as a measure of compactness of a molecule and the principal moments of iner-tia (pmi, pmiX, pmiY, pmiZ) account for mass distribution. Surface descriptors include, for example, the total solvent-accessible surface area (ASA) and posi-tively or negaposi-tively charged (ASA+ and ASA-), hydrophobic (ASA H) or polar (ASA P) surface areas. In addition, descriptors depending on the van der Waals volume (vol) are also included, such as molecular density (dens) that is calculated
2.1. CHEMICAL DESCRIPTORS 12
by dividing molecular weight by vol. The calculation of some of these type III descriptors, such as MOPAC descriptors, is computationally expensive. However, all descriptors need to be calculated only once for each data set. The list of all 67 3D descriptors is given in table A.2.
All descriptor calculations are done using MOE. Prior to descriptor calculation, the compounds are “washed” with MOE removing solvents and salts and assigning reasonable protonation states and partial charges. The default settings of MOE are applied.
2.1.3 Descriptor Discretization
Traditionally, pattern mining algorithms use nominal attributes instead of con-tinuous value attributes. Most molecular descriptors are, however, concon-tinuous in nature. One way to handle continuous attributes with pattern mining algorithms is to transform the value range of an attribute into bins and use these bins as new discrete attributes. The way how these bins are derived depends on the discretization algorithm. These algorithms can be divided into supervised and unsupervised algorithms, where algorithms from the first category use the train-ing data to take knowledge about class and value distribution of the continuous data into account. Unsupervised algorithms divide the value range of continuous attributes independent of the class and value distribution of the training data set into bins (Dougherty et al., 1995).
Unsupervised Discretization algorithms include simple equal-interval binning
where a descriptor’s value range is divided into a fixed set of intervals all spanning the same value range. However, equal-interval binning often leads to uneven distributions of the data into the bins, because attribute are often irregularly distributed in their value range (Witten and Frank, 2005). An equal-interval discretization produces many sparsely populated (or even empty) bins and a small number of heavily populated bins, weakening the attribute’s information content. A better unsupervised discretization technique is to derive the bins in a way that all bins contain the same number of attributes, irrespective of their class value. Thisequal-frequencybinning produces a fixed number of equally populated bins. However, since it is still an unsupervised method which does not use the class distribution of the training data available, the resulting binning scheme can also lead to a loss of information, e.g. when the equal-frequency constraint forces a split point between two bins in a way that the first bin is pure, i.e. containing only compounds from one class, but the second bin starts with a small number
CHAPTER 2. METHODOLOGY 13
of instances from the one class and then contains only instances of another class. In this case, giving up the equal-frequency constraint to produce two pure bins would be favorable.
Supervised Discretization techniques make use of the class distribution of the
training instances, e.g. by using statistical error measures such as the χ2 test (Kerber, 1992; Kohavi and Sahami, 1996) or information theory (Fayyad and Irani, 1992). The information theory based discretization from Fayyad and Irani (1992) has shown good results in several applications of EP mining (Li and Wong, 2002a,b; Ramamohanarao and Bailey, 2003) and is subsequently used as the stan-dard discretization algorithm.
The information theory based discretization algorithm utilizes information en-tropy as a measure of pureness for a possible splitting point. In this way, it is similar to the attribute splitting criterion used in decision tree learning (Quin-lan, 1993) and extends this idea to a recursive algorithm to successively split a continuous attribute into bins until a stopping criterion is reached. The stop-ping criterion is based on the minimum description length (MDL) principle and ensures that the number of bins stays reasonably small. The method starts by examination the information entropy of all possible splitting points2. The class information entropy induced by a splitting pointT which split an attributeAand training dataS into two intervals S1 and S2 is defined as
E(A, T, S) = |S1|
|S|Ent(S1) + |S2|
|S|Ent(S2),
with Ent(S) = −Σ|iC=1|P(Ci, S) log(P(Ci, S)) being defined as the entropy of a
dataset S with n classes C = {C1, . . . , Cn}. P(Ci, S) gives the proportion of
instances in S with class Ci. After computing the information entropy of each
splitting point, the one with the minimum class information entropy is selected and the algorithm recursively discretizes both sides of the induced partitioning.
An additional benefit of the information entropy based discretization is that the MDL principle stops the recursion in the first iteration if no good splitting point can be found and thus returns a binning with one bin spanning the whole value range of (−∞,∞). Such attributes provide no information for classification and can thus be removed prior to pattern mining, reducing the dimensionality of the pattern space and computation time.
2A possible splitting point is located only in the middle between two subsequent values from the training set.
2.2. MINING EMERGING PATTERNS 14
Table 2.2:A sample data set with ten compounds and four calculated descriptors: molec-ular weight (MW), logP(octanol/water) (logP), the number of hydrogen bond acceptors (HB-acc) and donors (HB-don). Each descriptor is discretized into two intervals.
Class MW logP HB-acc HB-don
[0,500) [500,∞) (−∞,5] (5,∞) [0,10] (10,∞) [0,5] (5,∞) 1 active × × × × 2 active × × × × 3 active × × × × 4 active × × × × 5 inactive × × × × 6 inactive × × × × 7 inactive × × × × 8 inactive × × × × 9 inactive × × × × 10 inactive × × × ×
2.2 Mining Emerging Patterns
The following sections introduce the concepts and notions of EP mining using a toy data set and then formally define the relevant concepts.
2.2.1 Mining Patterns Related to the Rule of Five
The formal concept of emerging patterns will be introduced in the following using the well known example of Lipinski’s rule of five (Lipinski et al., 2001). For this purpose, consider the model data set reported in table 2.2 that consists of 10 compounds and four descriptors: molecular weight (MW), logP(octanol/water), the number of hydrogen bond acceptors (HB-acc), and the number of hydrogen bond donors (HB-don). The descriptors have been divided into two intervals. Four of the hypothetical compounds are active and the remaining six are inactive. The example data shows that a single descriptor interval is not sufficient to describe the difference between active and inactive compounds. However, using combinations of some of the descriptors might lead to a discriminatory descriptor value range selection. In this example, it would be possible to test all combinations by hand, but for large numbers of descriptors and compounds, due to the expo-nential growth in possible combinations, a computational method that searches the space of all descriptor value range combinations for class-specific patterns is employed. A pattern is simply any combination of descriptor value ranges, e.g. the
CHAPTER 2. METHODOLOGY 15
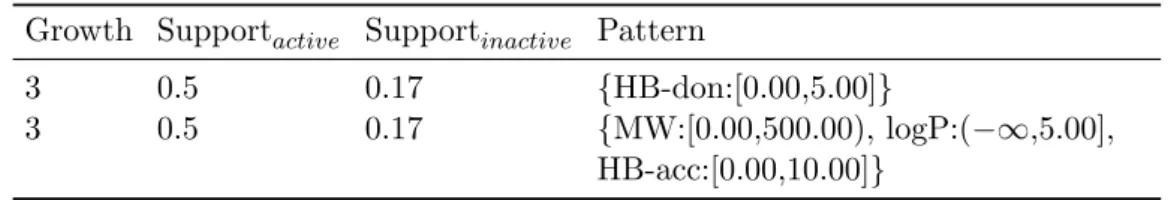
Table 2.3:Emerging chemical patterns for active compounds computed from the sample data set in Table 2.2
Growth Supportactive Supportinactive Pattern
3 0.5 0.17 {HB-don:[0.00,5.00]}
3 0.5 0.17 {MW:[0.00,500.00), logP:(−∞,5.00], HB-acc:[0.00,10.00]}
single descriptor value range {MW:[0.00,500.00]} or a more complex combination of descriptors such as, for example, molecular weight with the number of hydrogen bond donors: {MW:[0.00,500.00],HB-acc:[0.00,10.00]}. Patterns that are specific for the active compounds should only rarely occur in inactive ones. How often a pattern p occurs in a data set D is measured by the support suppD(p) as the percentage of compounds that match the pattern. The support of the pattern {HB-don:[0.00,5.00]} in the sample data is 24 for the active class and 16 in the inactive class. A class-specific pattern can be defined as a pattern where the frac-tion of both supports, called growth rate, is larger than a defined threshold. The pattern p has a growth rate growthactive,inactive(p) = 3. A class-specific pattern is called emerging pattern (Dong et al., 1999a). From all possible EPs, those are especially interesting which are of smallest cardinality. The previously shown pat-tern p could be changed by adding an additional descriptor value range, thereby altering the supports in both classes and thus the growth rate. However, adding an additional descriptor value range also makes the pattern more selective and probably reduces the number of matched compounds for the new pattern. Each compound that is matched by the modified pattern is also matched by the origi-nal pattern, and thus p subsumes the more specific pattern. In other words, the pattern p is more general than any pattern that can be constructed by adding one or more additional descriptor value ranges. Table 2.3 shows the EPs specific for the active compounds. Given these patterns, one would conclude that active compounds have a molecular weight lower than 500 Da, a logP(octanol/water) below five, not more than 10 hydrogen bond acceptors, and not more than five hydrogen bond donors.
2.2.2 Formal Definition of Emerging Chemical Patterns
The concept of emerging patterns will be defined formally in the following sections. Pattern mining is concerned with data sets of sets instances, each being a subset
2.2. MINING EMERGING PATTERNS 16
of a fixed set I of items I = {i1, . . . , in}. A pattern (or item set) is simply a
combination of these items:
Definition 2.2.1 A pattern P is a combination of items found in a data set:
P ⊆I.
A pattern matches an instance dof a data set S if each item of the pattern is also part of that instance, i.e.P ⊆d.
Given two data setsS1 andS2, the supportandgrowth rateof a patternP can be
defined.
Definition 2.2.2 The supportsuppof a patternP in a data setS is the percent-age of instances matched byP:
suppS(P) = |{d|d∈S∧P ⊆d}| |S|
For two data sets S1 and S2, the growth rate growth of a pattern P is defined
as the fraction of support in both data sets:
growthS1,S2(P) = suppS1(P) suppS2(P), if suppS2(P)>0 ∞, else
The above definition does not define a growth rate for patterns with zero support in the home classS1. However, these patterns are not of interest for data mining
and thus attributes with zero support in S1 are removed before pattern mining.
A pattern which is rare in one class, e.g.S2, but common to its home classS1is of
particular interest from a data and knowledge mining perspective. These patterns are called emerging patterns. Patterns with infinite growth rate (patterns which occur only in one class but not in the other) are called jumping emerging patterns (Dong et al., 1999a):
Definition 2.2.3 Given a threshold t ≥ 0, a pattern P with a growth rate
growthS1,S2(P) ≥ t is a t-emerging pattern. A ∞-emerging pattern is called
jumping emerging pattern (JEP).
The set of all t-emerging pattern for a data set grows exponentially with the number of possible items. To reduce the number of patterns for a knowledge mining experiment, only patterns which balance specificity and generality are retained and the remaining patterns are pruned. A pattern maximizes generality if it matches as many instances in its home class data set as possible. This is
CHAPTER 2. METHODOLOGY 17
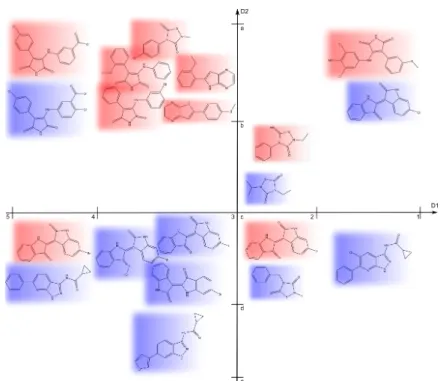
Figure 2.1: Most expressive jumping emerging pattern. A small data set of 11 com-pounds from two classes (red and blue) is projected into a space of two attributes D1 and D2. Each attribute is discretized into two intervals. {D1:(1,2),D2:(b,c)} and
{D2:(a,b)} are most expressive jumping emerging patterns.
done by selecting patterns with minimum cardinality. Increasing the cardinality of a t-emerging pattern P by adding an additional item increases the number of restrictions an instance must fulfill to be matched and thus is likely to decrease the number of matched instances in the home class ofP. Specificity is maximized by
t-emerging patterns with large growth rate. Of special interest in this regard are jumping emerging patterns because they provide the sharpest distinction between two classes of data. From the set of all jumping emerging patterns, most expressive jumping emerging patterns, as defined by Li et al. (2001) are especially interesting:
Definition 2.2.4 A jumping emerging pattern P, computed from two data sets
S1 and S2 is most expressive if and only if
1. Each proper subset of P is no longer a jumping emerging pattern:
∀p⊂P.growthS1,S2(p)6=∞
2. Each proper superset ofP has smaller support in P’s home classS1:
∀p⊃P.suppS1(P)>suppS1(p)
Figure 2.1 illustrates the concept of the most expressive emerging pattern using a small set of eleven compounds labeled by color with two classes (red and blue). The pattern {D1:(1,2), D2:(b,c)} is a JEP of minimum cardinality. Both subsets
2.2. MINING EMERGING PATTERNS 18
{D1:(1,2)}and{D2:(b,c)}match compounds from both classes and are thus not a JEP anymore. Since it already uses all possible descriptors in the data set, it also fulfills the second requirement for most expressive JEPs. Another example is the pattern{D2:(a,b)}. This pattern is a JEP for the class of red compounds. Having a cardinality of 1, it easily fulfills the first requirement of most expressive JEPs. If the pattern is extended by a adding second attribute, the support decreases. As an example, consider the extended pattern {D2:(a,b), D1:(3,4))}, where the support decreases from 78 to 58. Thus, any larger pattern built from {D2:(a,b)} has lower support in the red class and{D2:(a,b)}is a most expressive JEP.
2.2.3 Mining Algorithms
The development of algorithms for mining emerging patterns is a field of active research and has produced a number of algorithms with different properties. Many algorithms use so-called borders to store large sets of patterns in a compact way and use the border-diff algorithm (Dong et al., 1999b) to compute the set of all jumping emerging patterns of two data sets. The efficiency of the border-diff operation depends on the dimensionality of the positive and negative examples as well as on the number of negative examples. Various approaches exist which try to optimize the use of border-diff to improve the efficiency of emerging pattern mining, including tree-based approaches (Bailey et al., 2002) and a hypergraph-based approach (Bailey et al., 2003). These algorithms all work in a divide-and-conquer approach and try optimize the usage of the border-diff operation. Other approaches for mining emerging patterns include tree-based approaches which use search trees to explore the space of possible patterns (Zhang et al., 2000b), sometimes using additional pruning techniques to remove uninteresting patterns early in the search process (Fan and Ramamohanarao, 2003). A recent implementation uses zero-suppressed binary decision diagrams and is shown to be one of the fastest algorithms available (Loekito and Bailey, 2006).
Although a number of fast algorithms are available, the problem of mining emerging patterns remains computationally hard. It is shown to be MAX-SNP– hard (Wang et al., 2005a). The MAX-SNP complexity class contains graph-theoretical prolems which can be described by existential second-order logic. It has been shown that fixed-ratio approximation schemes for these problems are also NP-hard (Papadimitriou and Yannakakis, 1988).
CHAPTER 2. METHODOLOGY 19
2.2.4 Classification
Emerging Patterns can be used to construct high-performance classifiers. Ra-mamohanarao and Bailey (2003) provide an overview of most of the algorithms. For classification, a set of emerging patterns is first computed for each class. If the data set contains more than two classes, a round robin approach (F¨urnkranz, 2002) can be used. Round-robin computes patterns for each class by using all other classes as a merged background class. A test compound is then classified based on which set of patterns it resembles more. The actual implementation of the decision function differs for each algorithm, but most algorithms aggregate the support of all patterns matching the test instance for each class and then as-sign the class with largest aggregated support (Li et al., 2001, 2004; Zhang et al., 2000a).
A general outline of the classification procedure is shown in figure 2.2. First the training data set, which consists of 20 compounds divided into two classes by color code and two attributes, is mined for JEPs. After an optional pruning step, some of these JEPs are stored for classification of unknown test compounds. Two test compounds are shown. The accumulated support is computed for each test compound by checking which JEP matches the test compound. In this example, the first test compound matches two JEPs from the red class and only one JEP from the blue class. The second test compound matches one JEP from each class. Based on the sum of support for these patterns, the first test compound is predicted to belong to the red class, while the second test compound is predicted to belong to the blue class.
2.3 Emerging Chemical Patterns
Emerging pattern mining provides a powerful technique to extract important knowledge from data sets and use this knowledge to analyze data or to predict properties of new, unknown test data. It is straightforward to combine emerging pattern mining with molecular data represented as molecular descriptors. Since pattern mining only works for discrete attributes, the continuous descriptors first have to be transformed into discrete attributes by means of discretization algo-rithms. The supervised, information theory based discretization technique has been shown to yield good results in several applications of EP based classification studies (Li et al., 2004; Li and Wong, 2002a; Ramamohanarao and Bailey, 2003) and is the preferred method used in the experiments described in the following chapters. However, the unsupervised discretization methods are also evaluated
2.3. EMERGING CHEMICAL PATTERNS 20
(a)20 compounds projected into a two-dimensional descriptor space. Red and blue indicate the compound class.
Pattern Support p1={D1:[3,4),D2:[a,b)} 5/11 . . . pi={D1:[3,d),D2:[d,e)} 1/9 pi+1={D1:[1,2),D2:[c,d)} 1/11 . . . pn={D1:[3,4),D2:[c,d)} 3/9
(b)Emerging chemical patterns com-puted from the data set in (a).
(c) Classification of two unknown test compounds using the ECPs stored in table (b).
Figure 2.2: Outline of the classification procedure using a JEP based classifier. A data set of 20 compounds, divided into two classes, is projected into a chemical reference space of two descriptors D1 and D2. From this space, ECPs are mined and stored in a table. For classification of unknown test compounds, each pattern is tested wether is matches the test compound and the supports of matching patterns are summed. Two example test compounds are shown in (c). The first compounds matches patterns
p1,pi+1andpn. The cummulated support is 6/11 for the red class and 3/9 for the blue
class. Thus, this compound is predicted to belong to the red class. The second test compound matches patternspi+1 and pn and has cummulated supports of 1/11 and
CHAPTER 2. METHODOLOGY 21
in the classification experiments described in section 3.2, and a simple binning scheme based on statistical properties is used in the simulated sequential screen-ing experiment described in section 4.2.1.
Emerging chemical patterns (ECP) are based on combining chemical informa-tion in the form of chemical descriptors and pattern mining. Aspecific descriptor value range is written as a pair D : (min, max), where Ddenotes the descriptor name and min and max define the lower and upper bound of the value range. Round parenthesis and square brackets are used as to distinguish between open and closed intervals. A compound matches a descriptor value range if the corre-sponding descriptor value for that compounds lies between the lower and upper boundaries of the interval.
Definition 2.3.1 A chemical pattern (CP) cp is a combination of 1 ≤ i ≤ n
descriptor value ranges, where each descriptor Di occurs only in one descriptor
value range:
cp ={D1 : (min1, max1), . . . , Dn: (minn, maxn)}.
A set of descriptor value ranges S is matched by a chemical pattern cp if and only if each descriptor value range of cp is also present inS: cp⊆S.
A chemical patterncp is at-emerging chemical pattern (ECP) for two data sets
D1 and D2 if it has a growth rate larger than t:
growthD1,D2(cp)≥t.
Based upon the concept of most-expressive jumping emerging patterns,jumping emerging chemical patterns (JECP) (Auer and Bajorath, 2006) are defined as most-expressive jumping emerging patterns computed from discretized chemical compound data represented as chemical descriptors. As described in section 2.2.4, classification is based on most-expressive JECPs only.
Two mining algorithms are used to extract ECPs from chemical data sets. For the virtual screening experiments and the simulated sequential screening in chap-ter 4, a hypergraph based algorithm developed by Bailey et al. (2003) was used which computes all JECPs for a data set of two classes. Classification is done by accumulating the supports of all patterns for a class which are present in the test compound’s descriptor data. The knowledge mining experiment on 3D confor-mations in section 3.1 utilizes the zero-suppressed binary decision diagram based algorithm from Loekito and Bailey (2006) to compute all t-emerging patterns
in-2.3. EMERGING CHEMICAL PATTERNS 22
stead of only jumping emerging patterns. Given the fact that the biological data here is highly imbalanced (a few active compound are usually compared to large compound databases), accumulated supports are normalized by dividing it by the maximum possible accumulated support for each class.
3 ECP Data Mining and Classification
A variety of machine learning methods are used in chemoinforamtics research. Typical applications include analyzing biological data sets, e.g. results of HTS campaigns, or predicting properties based on training sets with experimentally measured biological data.
This chapter describes two experiments used to validate and explore the poten-tial of the ECP methodology in chemoinformatics. It is first shown that ECPs capture class-specific features in a high-resolution manner even if the underlying compounds are structurally highly similar and differ only in their 3D conforma-tion. Computed patterns are validated on a molecular level to show the validity of the ECP mining approach. In a second experiment, ECPs are used to construct accurate classifiers on the basis of very small training sets. ECP-based classifi-cation is evaluated using four different compound sets. The prediction accuracy based on training sets of different size is compared to two established classifica-tion methods, namely a decision tree (DT) implementaclassifica-tion and a Bayesian-based binary QSAR (BIN) classification technique, both implemented in MOE.
3.1 Data Mining for Conformational Differences
One feature of patterns is their simplicity as combinations of class-specific de-scriptor value ranges and thus the possibility to interpret and relate patterns to features of the molecules. knowledge mining for differences between two or more compound sets by analyzing biological data is one of the major applications of data mining algorithms in chemo- and bioinformatics. EPs have already been shown to extract useful knowledge out of gene expression data (Li and Wong, 2002a,b). These findings motivated an experiment where the aim was to find distinguishing patterns that reflect the differences of experimentally determined binding (bioactive) conformations of ligands compared to computationally pre-dicted conformations. Sadowski (2003) reviews many methods for computing binding conformations, starting from early algorithms to compute the
3.1. DATA MINING FOR CONFORMATIONAL DIFFERENCES 24
tions of six-membered rings to state-of-the-art methods like Corina1 or Omega2. A deeper understanding of the differences between computed and bioactive bind-ing conformations would greatly increase the quality of 3D structure generation programs. Additional knowledge could be used to filter out conformations which are not similar to bioactive conformations or could directly be incorporated into rule- and data-based methods.
Over the past decade, several studies have investigated binding conformations of known active compounds, mostly enzyme inhibitors, taken from complex crys-tal structures (Agrafiotis et al., 2007; Bostrøm et al., 1998; Diller and Merz, 2002; Nicklaus et al., 1995; Perola and Charifson, 2004; Stockwell and Thornton, 2006). A major focal point of these investigations has been the analysis of intramolecular strain energy of small molecules that is generally induced upon protein binding. It is well appreciated that ligands do not bind in global energy-minimum confor-mations to their targets because achieving a high degree of molecular complemen-tarity within a binding or active site generally comes at the cost of steric strain. The strain energy penalty associated with the formation of protein-ligand com-plexes can be approximated by computational means. For example, depending on the force field used to calculate relevant energy terms, Perola and Charifson (2004) have estimated total strain energy of average small molecular ligands to be approximately 2 kcal/mol. Steric strain effects contribute to the difficulties associated with correctly predicting bioactive ligand conformations, which is of-ten attempted by systematic conformational sampling and filtering of low energy conformers. It is therefore not surprising that strain energy and its consequences have been intensely studied.
Going beyond the analysis of strain effects, only very few studies have attempted to systematically explore differences between binding and modeled conformations. For example, in a pioneering study reported in 2002, Diller and Merz compared 65 small molecules taken from X-ray structures of protein-ligand complexes to 5000 low energy conformations. For each experimental and corresponding energy-minimized conformations, the distribution of the values of six type III (three-dimensional) descriptors was compared. These descriptors included polar and apolar solvent-accessible surface area, the radius of gyration, dipole moment, the number of intermolecular interactions, and the ratio of two principal molecular axes. It was found that binding conformations tended to have larger solvent-accessible surface area than minimized conformations because of fewer
intramolec-1http://www.molecular-networks.com/software/corina
2
CHAPTER 3. ECP DATA MINING AND CLASSIFICATION 25
ular interactions. Binding conformations were in general also found to be less compact than energy-minimized ones.
One would hope that systematic comparisons of bioactive and modeled ligand conformations for different targets might ultimately help to identify active con-formations in conformational ensembles, which is of paramount importance for reliable 3D structure generation and thereby various ligand-based drug design strategies, e.g. QSAR modeling or pharmacophore analysis. This would require to deduce target-specific rules or feature combinations that could differentiate be-tween alternative conformations. The ability to capture even subtle differences between highly similar compounds makes knowledge mining using ECPs a promis-ing tool to follow up on the theme of the analysis by Diller and Merz. In the experiment presented in this chapter, ECP mining is evaluated for its potential to identify compound class-specific descriptor value range patterns (i.e. signature patterns) that distinguish bioactive conformations from other low energy conform-ers with high accuracy. Inhibitors of 18 target proteins were studied and in each case, ECP mining identified patterns that correctly identify bioactive conforma-tions and differentiate them from others, even if conformational differences were subtle. Furthermore, key patterns could be rationalized at the molecular level of detail by analyzing X-ray structures of enzyme-inhibitor complexes.
3.1.1 Data Set
The data set is assembled from the PDBbind database (Wang et al., 2004, 2005b), an online accessible compilation of protein-ligand complexes extracted from the Protein Data Bank (PDB, release No. 107, January 2004). Ligand selection is done from the “refined” subset of the PDBbind, which provides high-quality ligand structures selected for comparison of structure-based virtual screening methods. This subset contains only X-ray crystallography structures3 with a resolution of at least 2.5 ˚A. Only binary complexes, i.e. complexes formed by one protein and one ligand molecule, with non-covalently bound ligands and known equilibrium constants were added to the set. Additionally, ligand molecules are restricted to contain only the most common organic elements C, N, O, P, S, F, Cl, Br, I, and H and to have a molecular weight less than 1000 Da. The compounds in this set were divided into activity classes based on their target protein, and 18 classes (all enzymes) were selected because these classes have a reasonable number of different ligands. Table 3.1 summarizes these 18 classes. The class size ranges
3NMR structures were not included since they only accounted for 39 out of 1622 candidate structures.
3.1. DATA MINING FOR CONFORMATIONAL DIFFERENCES 26
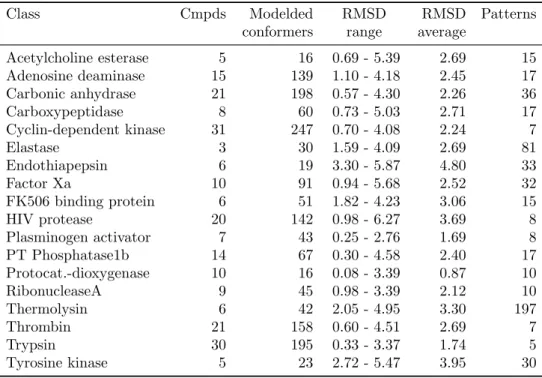
Table 3.1:Reported are the number of inhibitors with experimental binding conforma-tions per class (Cmpds) and the number of modeled low energy conformers, their RMSD range relative to the corresponding experimental conformation, the average RMSD per class, and the number of emerging chemical patterns (Patterns) that discriminate be-tween bioactive and modeled conformations.
Class Cmpds Modelded conformers RMSD range RMSD average Patterns Acetylcholine esterase 5 16 0.69 - 5.39 2.69 15 Adenosine deaminase 15 139 1.10 - 4.18 2.45 17 Carbonic anhydrase 21 198 0.57 - 4.30 2.26 36 Carboxypeptidase 8 60 0.73 - 5.03 2.71 17 Cyclin-dependent kinase 31 247 0.70 - 4.08 2.24 7 Elastase 3 30 1.59 - 4.09 2.69 81 Endothiapepsin 6 19 3.30 - 5.87 4.80 33 Factor Xa 10 91 0.94 - 5.68 2.52 32 FK506 binding protein 6 51 1.82 - 4.23 3.06 15 HIV protease 20 142 0.98 - 6.27 3.69 8 Plasminogen activator 7 43 0.25 - 2.76 1.69 8 PT Phosphatase1b 14 67 0.30 - 4.58 2.40 17 Protocat.-dioxygenase 10 16 0.08 - 3.39 0.87 10 RibonucleaseA 9 45 0.98 - 3.39 2.12 10 Thermolysin 6 42 2.05 - 4.95 3.30 197 Thrombin 21 158 0.60 - 4.51 2.69 7 Trypsin 30 195 0.33 - 3.37 1.74 5 Tyrosine kinase 5 23 2.72 - 5.47 3.95 30
from three for elastase to 31 for cyclin-dependent kinase (CDK). On average, each class contains∼13 conformations.
Each active compound was subjected to extensive conformational search us-ing the Molecular Operatus-ing Environment (MOE, version 2007.09). A stochastic conformational search was carried out for 10,000 iterations by randomly rotating single bonds in test molecules. Following each iteration, the resulting conforma-tion was energy-minimized and sampled. Cartesian minimizaconforma-tion was carried out using MOE’s MMFF94x force field until the RMS gradient of the energy function was less than 0.001 kcal/(mol×˚A). For each inhibitor, sampled low energy con-formations were compared in order to eliminate concon-formations from pairs of very similar ones, applying a root mean square deviation (RMSD) threshold value of 0.1 ˚A. As reported in table 3.1, between 16 and 247 low energy conformations were retained per class with an average of 88 conformations. RMSD values for modeled and experimental conformations were calculated based on superposition of all non-hydrogen atoms. In 12 of 16 cases, the conformational ensembles con-tained conformers that were very similar to binding conformations, i.e. within
CHAPTER 3. ECP DATA MINING AND CLASSIFICATION 27
(a) Adenosine deaminase inhibitors
(b)Adenosine deaminase inhibitors
(c) Ribonuclease A inhibitors
(d) Trypsin inhibitors
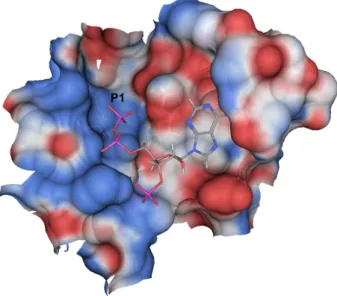
Figure 3.1: Exemplary bioactive and modeled conformations. The binding conforma-tions (on the left) and corresponding low energy conformers (right) are shown for four inhibitors of three enzymes discussed in the text. The dashed line represents an in-tramolecular hydrogen bond. (a) and (b) adenosine deaminase inhibitors (taken from PDBbind entries “1fkx” and “1ndv”, respectively), (c) ribonuclease A inhibitor (1afk), (d) trypsin inhibitor (1o3h).
3.1. DATA MINING FOR CONFORMATIONAL DIFFERENCES 28
1 ˚A RMSD. Thus, in many cases, differences between experimental and modeled conformations were rather subtle, which can also be appreciated in figure 3.1. However, all ensembles also contained conformations that deviated from binding conformations by several ˚A RMSD. Most classes produced an average RMSD of around 2 ˚A, suggesting that modeled conformers were overall not dramatically different from binding conformations. The sampled conformations represent a spectrum of conformers provides a good basis for the analysis of the ability of ECPs to capture class-specific knowledge about the differences in bioactive con-formations.
3.1.2 Methodology Pattern Mining
The experiments described herein are based on differences in the spatial arrange-ments of molecules. In order to capture differences in their 3D properties, the set of type III descriptors described in section 2.1.2 was used as the basis for pattern mining. Prior to descriptor calculation, the compounds were normalized by first aligning their three principle molecular axes to thex-, y- and z-axis in descend-ing order. Afterwards, the molecules were translated such that their center of mass matched the origin of the coordinate system. This minimized the influence of translational and rotational differences for descriptors depending on external coordinates.
For ECP mining, the descriptors were first discretized using the supervised information entropy-based discretization method. A fast implementation of ECP mining based on zero-suppressed binary decision diagrams (Loekito and Bailey, 2006) was then used to compute all ECPs matching given support thresholds in bioactive and modeled classes. For bioactive conformations, a support threshold of min. 50% was applied, meaning that patterns matching at least half of the binding conformations were calculated. For modeled conformations, a threshold of max. 10% was applied. These parameter settings ensured that each detected pattern was at least five times more frequent in bioactive than in modeled conformations. For each inhibitor set, all patterns with a growth rate of at least 10 were analyzed.
Protein-Ligand Complex Depiction
For the interpretation of key patterns, details of protein-ligand interactions in the X-ray structures of their complexes were studied and represented with the aid of two-dimensional (2D) interaction diagrams (Clark and Labute, 2007) calculated