AT
G
OOGLEA
NSWERS YAN CHENUniversity of Michigan TECK-HUA HO University of California, Berkeley
YONG-MI KIM University of Michigan
Abstract
In a field experiment at Google Answers, we investigate the performance of price-based online knowledge markets by systematically manipulating prices. Specifically, we study the effects of price, tip, and a reputation system on both an an-swerer’s effort and answer quality by posting real reference questions from the Internet Public Library on Google An-swers under different pricing schemes. We find that a higher price leads to a significantly longer, but not better, answer, while an answerer with a higher reputation provides signifi-cantly better answers. Our results highlight the limitation of monetary incentives and the importance of reputation sys-tems in knowledge market design.
Yan Chen and Yong-Mi Kim, School of Information, University of Michigan, 1075 Beal Avenue, Ann Arbor, MI 48109-2112 ([email protected], [email protected]). Teck-Hua Ho, Hass School of Business, University of California, Berkeley, CA 94720-1900 ([email protected]).
We thank Nancy Kotzian, Sherry Xin Li, Drago Radev, Paul Resnick, Soo Young Rieh, Yesim Orhun, Hal Varian, Lise Vesterlund, Jingjing Zhang, two anonymous referees, and seminar participants at Michigan, Yahoo! Research and the 2006 North America Regional Meetings of the Economic Science Association (Tucson, AZ) for helpful discussions; Mau-rita Holland for giving us access to the Internet Public Library database; and Alexandra Achen, Tahereh Sadeghi, Xinzheng Shi, and Benjamin Taylor for excellent research as-sistance. Chen gratefully acknowledges the financial support from the National Science Foundation through grant no. IIS-0325837. Any remaining errors are our own.
Received November 24, 2008; Accepted August 28, 2009. C
2010 Wiley Periodicals, Inc.
Journal of Public Economic Theory, 12 (4), 2010, pp. 641–664.
1. Introduction
A common method of obtaining information is by asking a question to an-other person. Traditionally, libraries have provided this function through their reference services, where a reference librarian answers a patron’s ques-tion or points to resources for help. Tradiques-tional reference interacques-tions have been one-to-one, with the interaction being transitory and also restricted to the patron and the reference librarian. However, with the advent of the Web, users have access to a variety of online question-answering services, ranging from ones based on the traditional one-to-one library reference model to community-based models. Various terms have been used to refer to these services, such as knowledge markets, question-and-answer services (Roush 2006), and question-answering communities (Gazan 2006). We use these terms interchangeably in this study.
Regardless of their structure, knowledge markets derive their value from both the quantity and quality of contributions from their participants. Fun-damental to the design of a knowledge market is the ability to encourage sufficient high-quality contributions. If a particular knowledge market gen-erates large numbers of low-quality answers, this may discourage continued participation from users, ultimately affecting the viability of the knowledge market. Conversely, if a knowledge market provides high-quality answers but many questions are unanswered or the overall volume of questions is small, it may not provide enough utility to become a preferred destination for users of such services. Thus, an important part of the design of knowledge markets is the choice of incentives for contributions. Incentive systems can include price, tip, or reputation systems. Ideally, an incentive system should encour-age both a high quantity and high quality of contributions. In this paper, we focus on incentives for quality, examining the effects of price, tip, and repu-tation systems on the quality of contributions to a given knowledge market.
When studying knowledge markets, it is helpful to categorize them into either price-based or community-based systems. The former involves a mone-tary transfer while the latter encourages community members to voluntarily share information. Examples of the former include Google Answers (GA), and Uclue, while the latter include Yahoo! Answers (YA), Answerbag, and Naver’s Knowledge-iN. Since the price-based system explicitly incentivizes the knowledge providers, we might conclude that it is more efficient in achieving knowledge exchange. This paper examines whether this is the case by manipulating prices in a field experiment at GA. In doing so, we hope to shed light on the performance of a price-based system in facilitating knowl-edge exchange.
Besides monetary incentives, knowledge markets differ in design fea-tures such as who can provide answers and comments and whether the site uses a reputation system. Hence, it is important to control the effects of these design features on the behavior of the knowledge providers and their respec-tive contribution quality in the field experiment.
GA was introduced by Google in April 2002 and remained in operation until late December 2006. GA was an experimental product from Google whose function was similar to that of a reference librarian, in that users could ask a question, and a Google Researcher would reply. Although the service is no longer active, archived questions and answers are still publicly viewable. In the GA model, a user posts a question along with how much he or she would pay for an answer, from $2 to $200. The user also pays a nonrefundable listing fee of $0.50. If the answer provided by a Google Researcher is satisfactory to the asker, the Researcher receives 75% of the listed price and Google receives 25%. Users also have the option of tipping the Researcher.
To answer questions, Google Researchers were selected by Google. An official answer could be provided only by a Google Researcher, although any user could comment on the question. According to Google, Researchers had “expertise in online searching,” with no claims being made for subject exper-tise. While GA did not provide a mechanism for users to direct a question to a specific Researcher, users sometimes specified in the question title the Re-searcher they wanted to handle the question. Once a user posted a question, she could expect two types of responses: comments and an actual answer. Only official satisfactory answers received a payment. However, if a satisfac-tory answer to the question was provided in the comments, an official an-swer might not be supplied. The incentive for commenting was that Google claimed Researchers could be recruited from commenters.
GA had a transparent reputation system for Researchers. For each Re-searcher, the following were visible: (1) Average answer rating (1 to 5 stars) of all this Researcher’s answers, where the asker whose question is answered by the Researcher rates the answer; (2) Total number of questions answered; (3) Number of refunds;1 and (4) All the questions answered by the Re-searcher along with their respective ratings. There are 53,087 questions avail-able through GA archives.
In comparison to price-based systems, community-based services, such as YA, do not use money as an explicit incentive for knowledge exchange. Rather, answerers are rewarded through a system of points and levels based on the extent and quality of their participation in the question-answering community. These points and levels encourage users to provide high-quality answers and discourage nonproductive participation, such as carrying on un-related conversations with other community members in an answer thread. In general, the ability to mark one or more answers as “Best Answer” is re-stricted to the original question asker, while any registered user may mark an answer as a favorite or award points to it. Community-based sites have no barrier to participation other than being a registered user of the site. Thus, a question may be answered by both subject experts and novices alike.
1Askers who were unsatisfied with the answer could demand a refund. Regner (2009) finds
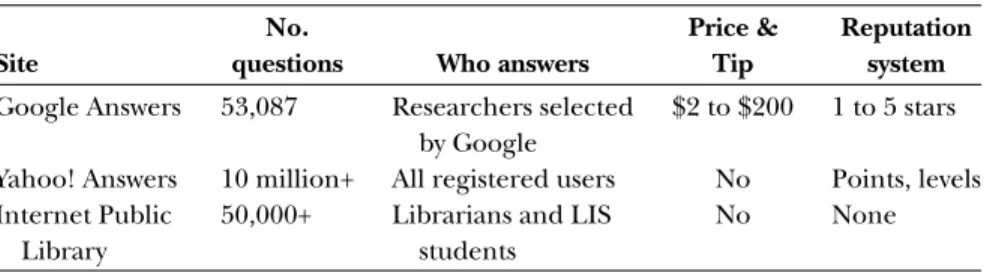
Table 1: Features of Internet knowledge markets
No. Price & Reputation
Site questions Who answers Tip system
Google Answers 53,087 Researchers selected by Google
$2 to $200 1 to 5 stars Yahoo! Answers 10 million+ All registered users No Points, levels Internet Public
Library
50,000+ Librarians and LIS students
No None
Notes:
1. The number of questions for GA includes only those that can still be accessed through their archive.
2. According to Yahoo!’s blog, YA had their 10 millionth answer posted on May 7, 2006.
Mechanisms that enable the best answers and contributors to float to the top become essential in such systems.
Table 1 presents the basic features of three representative knowledge markets on the Internet, including the number of questions posted on the site, who answers the questions, whether price and tip are used, and what rep-utation system is used. In terms of investigating the effects of various design features, GA provides a unique opportunity, as all important design features are used by the site.
In this paper, we investigate the effects of various design features of knowledge markets by conducting a field experiment at GA. Specifically, we study the effects of price, tip, and reputation systems on the quality of an-swers and the effort of the answerers by posting real reference questions from the IPL to GA under different pricing schemes. In our experimental sample, we find no price or tip effect on answer length or quality. In comparison, an answerer with a higher reputation provides significantly better answers. Our results highlight the importance of reputation systems for online knowledge markets.
The rest of the paper is organized as follows. In Section 2, we present the emergent literature on knowledge markets. Section 3 presents the exper-imental design. Section 4 describes our hypotheses. In Section 5, we present our analysis and results. Finally, in Section 6, we discuss our results and their implications for knowledge market design.
2. Literature Review
Online communities devoted strictly to question answering are a fairly re-cent phenomenon. Despite this relative newness, a number of studies in economics as well as computer and information sciences have focused on characterizing Web-based question-answering communities.
To our knowledge, Edelman (2004) presents the earliest empirical study of GA, focusing on labor market issues. Using more than 40,000 question-answer pairs collected between April 2002 and November 2003, he finds that more experienced answerers, with experience defined as the number of questions previously answered by each answerer, receive higher asker ratings, and higher rate of earnings. Additionally, he finds a positive and significant correlation between answer length and asker rating. In comparison, Regner (2009) studies the pricing and tipping behavior from a contract theoretic perspective, using the entire data set from GA. He finds that frequent askers are more likely to tip, providing support for reputation concerns. However, in his study, 15% of one-time users also tip, providing support for social pref-erences. Finally, answerers put more effort into an answer if the asker has frequently tipped in the past.
In addition to economic analysis, knowledge markets have been stud-ied in the fields of both computer and information sciences. For example, Rafaeli, Raban, and Ravid (2005) provide a comprehensive empirical study of GA. They collect GA site activity from April 2002 to December 7, 2004. Of the 77,675 questions, they find that 37,971 were answered, and 21,828 had comments only. Of the answered questions, 23,869 were rated, and 7,504 were tipped. The average price of a question is $19.37, while the average price of an answer is $20.20.
In another study, Adamic et al. (2008) examine YA from the perspective of a knowledge-sharing community. Consistent with Edelman’s (2004) find-ings for GA, they find that answer length is a significant factor in predicting the best answers across all categories, achieving about 62% prediction ac-curacy based on answer length alone. In addition, they find that the “track record” of a user is more predictive for best answers in technical categories such as Programming, compared to discussion or advice-seeking categories such as Wrestling or Marriage. The track record is measured in terms of how many answers from that user within a particular category are selected as best answers.
Researchers have also studied the structure of non-English knowledge markets. For example, South Korea’s most popular portal site and search engine, Naver (http://www.naver.com), runs a service called Knowledge-iN (KKnowledge-iN), in which users ask and answer questions (Nam, Ackerman and Adamic 2009). An estimated 4.5 million people use KiN every day. Through interviews with KiN users, Nam et al. (2009) find varied motivations for par-ticipation, such as altruism, personal learning, and personal interest.
Yang, Adamic, and Ackerman (2008) examine expertise sharing in Taskcn, one of a number of “Witkey” sites in China. “Witkey” is the term used in China to refer to a type of website in which “a user offers a mone-tary award for a question or task and other users compete for the award.” In contrast to sites such as YA or KiN, the notion of expertise in this site has been expanded to include the ability to perform a task. For example, a Taskcn user may ask for a new logo design. In Taskcn, a requester posts the
task or question to the site, along with the monetary amount to be awarded and deadline for submission. Users then submit their solutions. Upon the deadline, the requester chooses the winner. The winner gets the money, and the site receives a fee. Yang et al. (2008) find that, while higher rewards at-tract more views, the task reward is uncorrelated with the number of submis-sions. That is, money is not correlated with participation.
In their examination of user participation in knowledge markets, Shah, Oh, and Oh (2008) include a comparison of YA and GA. One striking dif-ference they find is in the number of answerers compared to the number of askers across the two sites. In GA, the number of askers is more than one hundred times larger than the number of answerers, while in YA the ratio of askers to answerers is more balanced. These results can be explained by the respective site structures. That is, GA has a limited number of answerers, who are the only ones allowed to provide official answers to questions. However, in YA any user can answer any other user’s question.
These studies rely on data gathered from large-scale crawling of the sites to examine motivations for participation in online question-answering com-munities, with an underlying assumption that any kind of participation is positive. However, Raban and Harper (2008) posit that free-riding may be preferable to negative contributions. In online communities, free-riding can take the form of nonparticipation, as in neither asking nor answering ques-tions, while negative contributions can be incorrect answers or references to poor-quality information sources. Consequently, studies must also examine what motivates high-quality contributions.
Harper et al. (2008) investigate predictors of answer quality using a field experiment across several online question–answer sites. They find that an-swer quality is typically higher in GA than on free sites. In contrast to our finding, they find that paying more money leads to higher quality answers. Among free sites, YA outperforms sites that depend on specific individuals to answer questions. We compare their protocol, analysis, and results with ours in Section 5.
Compared to other studies of knowledge markets, our study is the first field experiment conducted on a question–answer community to investigate which design features lead to higher answerer effort and answer quality. In addition to the empirical findings, we also develop a rigorous rating pro-tocol for evaluating answer quality, which provides a useful contribution to experimental methods.
3. Experimental Design
We design our experiment to investigate the effects of price, tip, and reputa-tion on answerer effort and answer quality. Specifically, we are interested in whether a higher price will lead to higher effort and better quality, whether the promise of a tip will induce more effort and better quality, and whether,
all else being equal, researchers with a higher reputation score will provide a higher quality answer.
3.1. Question Selection: The IPL Database
In our study, to preserve the realism of the questions, we use real reference questions from a password-protected database from the IPL.
The IPL is a nonprofit organization founded at the University of Michi-gan School of Information in 1995. It provides two major services: (1) a subject-classified and annotated collection of materials and links on a wide range of topics and (2) a question-answering reference service. The IPL is “perhaps the largest and most well known” of the free electronic reference and online library collection services (McCrea 2004).
IPL relies on unpaid volunteers to answer questions. There are two sources of answers. First, masters degree students from 15 universities who are trained to be librarians use the IPL as part of their training. During a typ-ical semester, there are roughly six to seven classes taught using the IPL, e.g., SI 647 (Information Resources and Services) at the University of Michigan.2 A second source of answers is volunteers, many of whom received IPL train-ing as students. Some volunteers use the experience at the IPL to obtain jobs at commercial question and answering services, such as Google, or 24/7.
Of the 50, 000 questions sent to the IPL prior to our study, one-third to one-half were not answered because they were out of scope, such as legal or medical questions, they were obviously questions from quizzes or exams, or the volunteers ran out of time. On a typical day, the IPL receives 160–170 questions, of which an estimated 40% come from school children, 30% from outside the United States, and many from reference librarians.
The IPL maintains a complete data archive of the questions and answers provided. From Fall 2003 on, each volunteer was asked to write down the actual amount of time it took to answer a question as well as why a particular question was selected. As time spent on a question is of particular interest to us, we select our questions from the database from Fall 2003 onwards. When selecting questions, we use the following criteria. First, a question could not be answered with a single link or a single piece of information (e.g., on Google, or the GA archive). Second, it should be open-ended so re-searchers can spend a variable amount of time answering them. Part of what makes a “good” question is whether the researcher has to do work to find not just an answer, but the most authoritative resources. Consequently, we select questions where the quality of answers improve with researcher effort. For example, the question on women’s rights in Afghanistan (GAID # 543515), fall into this category. A researcher can spend as little as 20 minutes to find
2In SI 647, each student is required to answer 12–15 questions for the IPL. Students are
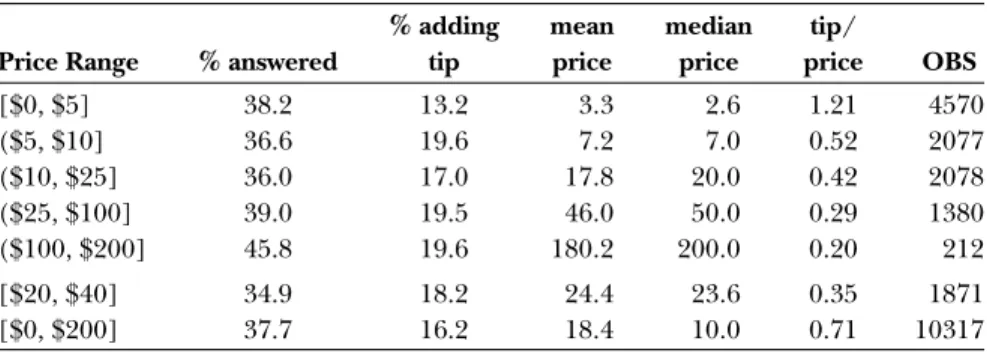
Table 2: Summary statistics from 10K downloaded questions from GA
% adding mean median tip/
Price Range % answered tip price price price OBS
[$0, $5] 38.2 13.2 3.3 2.6 1.21 4570 ($5, $10] 36.6 19.6 7.2 7.0 0.52 2077 ($10, $25] 36.0 17.0 17.8 20.0 0.42 2078 ($25, $100] 39.0 19.5 46.0 50.0 0.29 1380 ($100, $200] 45.8 19.6 180.2 200.0 0.20 212 [$20, $40] 34.9 18.2 24.4 23.6 0.35 1871 [$0, $200] 37.7 16.2 18.4 10.0 0.71 10317
some information, but can spend up to five hours to find and sort the infor-mation. Lastly, a question should fit into one of the 10 existing categories in the GA Archive.3
To obtain our sample, we conduct two rounds of selection. In the first round, we select questions that were answered in about an hour by IPL volun-teers. We use time as an approximation for the difficulty level of a question. In the second round, we ask our research assistants to independently search for an answer to each question. We discard any question for which an an-swer could be found within 10 minutes or for which an anan-swer could not be found within 30 minutes. The discrepancy in time spent searching for an answer between the IPL volunteers and our research assistants is largely due to the exponential increase of information on the Web. For example, a ques-tion that took an hour to answer in 2003 might be answered in 5 minutes in 2005. At the end of two rounds, we select 100 questions, each with two answers prepared by an IPL volunteer and one of our research assistants, respectively.
3.2. Treatments
To prepare for the experiment, in June 2005, we downloaded 10,317 ques-tions and answers from the GA public archive, uniformly distributed across the 10 categories. Table 2 presents the summary statistics of these questions and answers.
Based on the statistics reported in Table 2 and the pricing tips offered by Google (archived copy available on http://yanchen.people.si.umich.edu/), we next choose our price and tip parameters. We price our questions in the $20–$40 range based on the following considerations. First, questions in this range typically require at least 30 minutes of work, e.g., most of the questions
3The 10 categories are: (1) Arts and Entertainment, (2) Business and Money, (3)
Comput-ers, (4) Family and Home, (5) Health, (6) Reference, Education and News, (7) Relation-ships and Society, (8) Science, (9) Sports and Recreation, and (10) Miscellaneous.
from the IPL archive were answered between 30 minutes and 90 minutes. Second, questions priced in this range receive rapid attention, and therefore are more likely to get answered by GA Researchers. We design the following four treatments for our experiment.
1. $20 fixed price: $20 per question, with no condition attached. Based on GA’s rule, 25% of the price was taxed by Google, while tips were not taxable. Based on statistics from our 10K downloaded questions, given that a question was answered, there was a 16.2% chance that the researcher would receive a tip of an average $3.48.4Therefore, if a researcher answered a question in this category, her expected earning was $15.56.
2. $30 fixed price: $30 per question, with no condition attached. Again, given that 16.2% of the answers were tipped in Table 2, taking into account the Google tax, the expected earning in this category was $23.06.5
3. $20 plus an unconditional $10 tip. Each question in this category is priced at $20, with a promise of a $10 tip. We used the IPL questions with a sentence added at the end promising a tip. We varied the sen-tences so that they sounded slightly different in each question (see the list of questions on http://yanchen.people.si.umich.edu/). Of 25 questions in this category, 18 received an answer. All 18 answers re-ceived a tip. The expected earning was $25 in this category.
4. $20 plus a conditional $10 tip. When we sent out each IPL question, we again added a sentence at the end promising a $10 tip if the ques-tion was answered satisfactorily. In practice, if our research assistants judged the answer to be worthy of at least four stars, we added the tip. Seventeen of 25 questions in this category were answered, all of which were tipped $10 after receiving the answer. The expected earning was $25 in this category.
A comparison of Treatments 1 and 2 enables us to examine the price ef-fect, while a comparison of Treatments 1 and 3 as well as 1 and 4 enables us to evaluate the tip effect. Lastly, a comparison of Treatments 3 and 4 enables us to compare the respective effects of conditional and uncondi-tional tips. We note that while the two fixed-price conditions were common in GA, to our knowledge,ex antepromised tips were nonexistent prior to our experiment.
4The empirical frequency of receiving a tip in the [$0, $200] range is 16.2%. If we use the
frequency of receiving a tip in the [$20, $40] range, i.e., 18.2%, the expected earning for the $20 fixed price condition is $15.63.
5Again, if we use the frequency of receiving a tip in the [$20, $40] range, i.e., 18.2%, the
3.3. Experimental Procedure
We sent a total of 100 questions to GA in July, October, November, and De-cember 2005. We spaced the entire sample of questions over a 5-month pe-riod so as not to dramatically change the overall distribution of new questions on GA. Each day, four questions were sent to GA, one from each treatment. To avoid potential asker reputation effects,6 we use a different GA identity for each question.
Once a question is posted, if one of the GA researchers is interested in answering it, he locks the question so no other researcher can answer it. A locked question must be answered within four hours for questions priced under $100 or eight hours for questions priced at $100 or above, after which the question is automatically released. Sometimes researchers asked clarifi-cation questions before posting the answer. Once an answer is posted, the asker decides whether to pay for the answer. If she decides to pay, the posted price is automatically deducted from the her credit card. The total num-ber of refunds for each researcher is recorded in the GA archive. As part of our experiment, we pay for all answers to our questions. After the answer is posted, the asker may rate it from one to five stars, one being “poor” and five being “great” according to GA. Our research assistants rate every answer to the questions we ask. However, in the analysis, we exclude their ratings since they were not blind to the research hypotheses. Instead, we use rater evaluations to determine answer quality. Our rating procedure is explained in detail in Section 5.
If a question is not answered within a month, it is automatically closed. By the end of November 2005, 55 of 76 questions were answered, most within a week of being posted. The remaining questions were closed within a month of being posted. In December 2005, we posted the remaining 24 questions from our set of 100 and reposted 15 of the unanswered questions under new user IDs. Of these questions, 21 were answered. Therefore, of the 100 ques-tions we posted, 76 were answered. Seventy-two were answered in the first posting, and four were answered in the second posting. Of these 76 answered questions, one is excluded from analysis because the formal submitted an-swer referred to the comments without providing content of its own. A list of our 75 questions, together with their GA ID number and categories, is pro-vided on the first author’s website (http://yanchen.people.si.umich.edu/).
6In GA, askers could develop a reputation in various dimensions, such as the types of
questions she asks, how she rates answers, the amount of tips if any, and the number of re-funds demanded. For example, in GA 777817, Researcher Tutuzdad-ga started the answer by “Thank you for allowing me to answer another one of your interesting questions. . .” Regner (2009) find that askers with a tipping history receive higher effort answers while those with a record for not tipping receive low effort answers.
Ideally we would like to observe the amount of time a researcher spent on an answer; however, such data were not available in the public archive.7 Therefore, we use an informal survey of the researchers. In July and October 2005, we posted 44 questions. Of the 44 questions, 31 were answered. For these 31 questions, as soon as an answer was posted, our research assistants asked the researcher how long it took him or her to answer the question.8Of these 31, we obtained time estimates for 14 cases. In Section 5, we correlate the reported time and the answer length for these 14 questions, and use the result as the basis for using answer length as a proxy for effort.
4. Hypotheses
In this section, we describe our hypotheses comparing outcomes from these four treatments. We use two outcome measures, effort and quality. Our mea-sure of effort is the length of an answer, as determined by word count. Our quality measure is based on rater data, which we will describe in more de-tail in Section 5. In what follows, we state the alternative hypotheses with the corresponding null hypotheses being no difference.
Based on social preference theories and the empirical support in Regner (2009), we expect that answerers will reciprocate a higher price with more effort and better quality.
Hypothesis 1 (Reciprocity: effort). A question with a higher price generates an answer involving more effort.
Hypothesis 2 (Reciprocity: quality). A question with a higher price generates an answer with better quality.
Similarly, anex ante promised tip should induce higher effort and bet-ter quality. The tip effect follows the same logic as the price effect. However, because an ex ante promised tip is a new feature introduced by our experi-ment, and there is uncertainty associated with the tip, we state our alternative hypotheses on the tip effect, separately.
Hypothesis 3 (Tip: effort). A conditional (or unconditional) tip generates an an-swer involving more effort compared to a fixed-price$20 question.
Hypothesis 4 (Tip: quality). A conditional (or unconditional) tip produces a higher quality answer than a fixed-price$20 question.
Comparing conditional and unconditional tips, we expect researchers to put forth more effort for conditional tips, under standard economic models.
7The time a researcher locks a question could also be used, together with the time an
answer is posted, as an upper bound for estimating effort. The lock data, however, are not in the public archive.
However, it is conceivable that unconditional tips might produce a better outcome because of the trust implied in such tips.
Hypothesis 5 (Conditional vs. Unconditional Tips). A conditional tip produces a better answer than an unconditional tip.
Lastly, we examine the effect of reputation on the quality of answers. Past research shows that reputation plays an important role in the functioning of online transactions. Resnick et al. (2006) conduct a randomized experiment on eBay, and find that the difference in buyers’ willingness-to-pay for identi-cal vintage postcards from a high reputation seller versus a new seller is 8.1% of the selling price.
Hypothesis 6 (Reputation). Answerers with higher reputations will provide better answers.
5. Analysis and Results
In this section, we present our data analysis and results. We use human raters to determine answer quality, a common procedure in Information Retrieval and Psychology, but less common in experimental economics.9 Therefore, we describe the rating procedure in detail in subsection 5.1.
To compare our raters’ quality ratings with those of the real users in GA, we randomly select 125 question–answer pairs from the 10K questions we downloaded from GA and have our raters evaluate them, in addition to the 75 question–answer pairs from our experiment. The additional 125 pairs also enable us to examine the robustness of our findings on a wider range of prices and tips. In subsection 5.2, we present our results on the 75 question– answer pairs, as well as those on the entire set of 200 question–answer pairs.
5.1. Rating Procedure
In developing our rating procedures, we look for guidance from the litera-ture examining peer review of manuscripts (see, e.g., Strayhorn, McDermott, and Tanguay 1993, van Rooyen, Black, and Godlee 1999, Wood, Roberts and Howell 2004). In our study, raters are expected to provide objective assess-ments of the quality of the answers. In peer reviews, reviewers are expected to provide objective assessments of the quality of the manuscript under re-view. Often they are asked to rate the overall quality of the manuscript on an ordinal scale in addition to providing a recommendation to accept or reject the manuscript. A study of the reliability of manuscript reviews in psychology (Strayhorn et al. 1993) finds that interrater reliability10 for the
9Scharlemann et al. (2001), Landry et al. (2006), and Andreoni and Petrie (2008) use
raters to evaluate the attractiveness of experimental subjects, using techniques developed in Biddle and Hamermesh (1998). Zhang (2008) uses a content analysis procedure similar to ours.
10Interrater reliability provides “an indication of the extent to which the variance in the
overall quality rating improves when raters provide ratings for a number of aspects of the manuscript prior to providing the overall quality rating. Reli-ability is also improved by training the raters in the rating procedure, and averaging the scores of more than one rater. These strategies for improving reliability are taken into account in our rating procedures.
In our study, 16 raters were recruited from graduate students at the Uni-versity of Michigan who had taken the course, SI 647, Information Resources and Services, in the past two years. This course is usually taken by students in the Library and Information Services (LIS) specialization in the Master of Science in Information (MSI) program. The course prepares them for reference services in settings such as libraries or other information centers, requiring students to work with actual reference questions submitted to the IPL. Each student is required to answer 12–15 IPL questions as part of their training. Students thus gain expertise in searching, evaluating information resources, and answering questions submitted online.
Initially, six raters took part in rating sessions in May 2006. Another group of four took part in September 2006, followed by a third group of six in March 2007. There were two sets of 100 GA question–answer pairs each to be rated. Set A was composed of the 75 questions selected from the IPL and used in our experiment as well as 25 questions selected from the 10K downloaded from the GA archives. Set B was composed of 100 questions selected from the 10K downloaded from GA archives that did not overlap the questions in Set A. Set A was rated by 6 raters from the May 2006 group and 2 raters from the March 2007 group, while Set B was rated by 4 raters from the September 2006 group and 4 raters from the March 2007 group. Thus, each question was rated by eight separate raters. Of the 16 raters, 12 were female. All of the raters were native En-glish speakers. Their undergraduate major areas were predominantly in the humanities, with seven of the raters having majored in English. The majority of the raters were in the 21–30 age group.
We follow the same procedure for all three groups of raters. Raters were presented with 100 question–answer pairs from Set A or Set B. For each question–answer pair, raters provided nine ratings, as shown below:
1. Please rate the difficulty of thequestion. (1=very easy . . .5 =very difficult)
2. Please rate theanswerfor the following factors:
(1=strongly disagree . . .5=strongly agree, NA=Not Applicable) (a) The question that was asked is answered.
(b) The answer is thorough, addressing all question parts. (c) The sources cited are credible and authoritative.
Interrater reliability examines the relative ordering of the rated objects. In contrast, in-terrater agreement measures the extent to which raters assign the exact same rating to objects and is thus sensitive to rater characteristics.
(d) The links provided are to relevant web sites or pages. (e) Information in the cited sources is summarized.
(f) Only information pertinent to the question is presented.
(g) The answer is well-organized and written clearly, avoiding jargon and/or inappropriate language.
3. Please rate the overall quality of theanswer. (1=very low quality. . .
5=very high quality)
Training session. All 16 raters took part in a training session, in which they were asked to rate two question–answer pairs from GA not in the set of 200 pairs to be rated. Raters were also asked to fill out a background ques-tionnaire. For the training session, the question–answer pairs were viewable online through a web browser, and raters were provided with paper rating forms. For each of the training question–answer pairs, there was a discus-sion regarding the rating activity after all raters had completed rating that question–answer pair. For each rating, all raters were asked for both their ratings and rationales. Clarification of the rating instructions was provided if requested. The rating coordinators also presented their ratings and ratio-nales. At the end of the training session, the rating sheets were collected from the raters. The purpose of the discussion was for raters to better un-derstand their individual rating scales, not to establish consensus among the raters. Raters were explicitly asked in the rating instructions to rely on their own judgment when rating. The training instructions are included in the Appendix.
Rating session. For each group of raters, five rating sessions of two hours each were scheduled. The training session took part during the first rating session. The rating sessions took place in a computer lab. Raters were asked to go at their own pace, although there was a daily limit of 25 question– answer pairs to be rated to avoid fatigue. All rating sessions were completed between one and two hours. Raters were paid a $15 per hour flat fee to compensate for their time.
Rating was done using a web-based system. Once the rater had provided all the requested responses and clicked Submit, the next question–answer pair to be rated was displayed along with a blank rating form. If a rater had not provided all ratings, a pop-up window informed the rater of this and the rater was not allowed to proceed to the next question–answer pair until the form had been completed. Once a rater had rated the daily limit, a goodbye screen was displayed.
Raters were provided with unique logins and passwords to allow sep-arate logging of their responses. The order of question–answer pairs was randomized for each rater. All identifying information, such as GA question
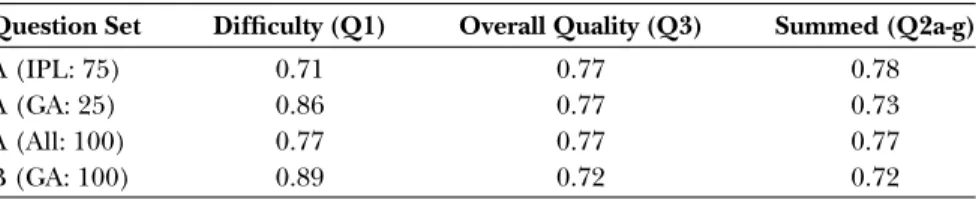
Table 3: Interrater reliabilities: intraclass correlation coefficient
Question Set Difficulty (Q1) Overall Quality (Q3) Summed (Q2a-g)
A (IPL: 75) 0.71 0.77 0.78
A (GA: 25) 0.86 0.77 0.73
A (All: 100) 0.77 0.77 0.77
B (GA: 100) 0.89 0.72 0.72
ID number and answerer identity, as well as the price and reputation scores, were removed for the training and rating sessions. Furthermore, raters were blind to the hypotheses of the experiment.
Interrater reliability was assessed with the intraclass correlation coeffi-cient (ICC[3,8]),11which is a multirater generalization of the more familiar Cohen’s Kappa for the two-rater case. Table 3 shows the reliability statistics for the two groups of raters, A and B. In general, values above 0.75 repre-sent excellent reliability, values between 0.40 and 0.75 reprerepre-sent fair to good reliability, and values below 0.40 represent poor reliability. Good to excel-lent reliability is observed for all our ratings. The internal consistency of the multi-item scale (Q2 parts a-g) is high, with a Cronbach’s alpha of 0.84. The alpha value indicates that items in the multi-item scale are highly corre-lated, reflecting a single underlying construct. The Pearson correlation coef-ficients for the summed ratings (Q2 a-g) and the overall ratings (Q3) range from 0.75 to 0.92 for Group A and from 0.74 to 0.95 for Group B. These re-sults indicate that the multi-item scale and the overall rating are measuring a similar construct. Based on these results, we use the median response to Q3 to represent answer quality in our subsequent analysis.
To compare rater and consumer evaluations of answer quality, we ran-domly select 125 question–answer pairs from the 10K questions downloaded from the GA archive. We then run an OLS regression, with the median rat-ing as the dependent variable, and consumer ratrat-ing as the independent variable. The coefficient for consumer rating is 0.847 (σ =0.02,p <0.01,
R2 = 0.93). This indicates that our raters, on average, gave lower rat-ings to the overall answer quality than the consumers who asked the ques-tions. This difference might reflect the fact that our raters are trained semi-professionals who might thus be more critical in determining answer quality.
11There are six main cases of intraclass correlation coefficients (ICC), distinguished by the
numbers in parentheses following the letters ICC. The first number indicates the statisti-cal model assumed. Case 3 assumes that judges are fixed and not drawn from a random population. The second number indicates the number of raters. More details on ICC com-putation can be found in Shrout and Fleiss (1979).
5.2. Results
We first verify that the IPL questions assigned to each of the four different treatments have the same difficulty distribution. Using the average difficulty level from our raters’ assessment (Question 1) for each question, we conduct six Kolmogorov–Smirnov tests of equality of distributions across treatments. Each test yieldsp >0.10. Thus, we conclude that questions in each treatment have the same difficulty distribution.
Next, we investigate whether there is any selection effect among the an-swerers. Field experiments on knowledge markets face a challenge in that the experimenter cannot randomize the answerers into different treatments, as the answerer selects a question. To investigate whether higher prices or tip treatments change the characteristics of the answerer pool, we run a series of pairwise Kolmogorov-Smirnov tests to check whether the distributions of observable answerer characteristics, i.e., their reputation (past average rat-ing), experience (total number of questions answered), and total number of refunds, differ between treatments. Again, each of the 18 tests yieldsp >
0.10. Thus, we cannot reject the null hypothesis of equal distributions at the conventional significance level and therefore conclude that the distribution of observable answerer characteristics does not differ across treatments.
Having established the equality of distributions in question difficulty and observable answerer characteristics across treatments, we next examine the price effects on researcher effort and answer quality. Social preference the-ory suggests that a higher price should induce more work from an answerer. As the amount of time a researcher spends on an answer is not observable, we use answer length as a proxy for researcher effort. Recall that, in 14 cases, we obtain the amount of time a researcher used to answer a question by directly asking the researcher. In these 14 cases, we find a correlation between the number of words in an answer and the reported time of 0.635 (p =0.015). Therefore, we use word count as a proxy for effort. However, two caveats warrant attention in the use of this proxy. First, while answer length might be a good proxy for the effort expended in writing the answer, it may not capture the effort in searching for the information. Second, if answerers use answer length as a signal of effort, self-reported time on an answer would be positively correlated with answer length.
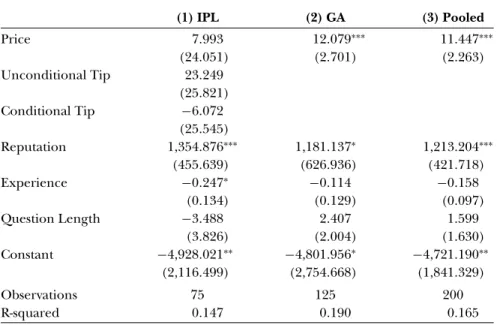
Table 4 presents three OLS specifications, with Answer Length, i.e., word count, as the dependent variable. Each specification includes some or all of the following independent variables: the price of the question, the uncon-ditional tip, the conuncon-ditional tip, the past reputation score of the researcher, the researcher’s experience, and the question length. Question length is in-cluded as an independent variable since some questions have several sepa-rate parts, which might result in longer answers. Specification (1) includes the 75 IPL question–answer pairs in our experimental sample, (2) includes the 125 GA question–answer pairs, and (3) includes the pooled sample of all 200 question–answer pairs.
Table 4: OLS: determinants of answer length
Dependent Variable: Answer Length (Word Count)
(1) IPL (2) GA (3) Pooled Price 7.993 12.079∗∗∗ 11.447∗∗∗ (24.051) (2.701) (2.263) Unconditional Tip 23.249 (25.821) Conditional Tip −6.072 (25.545) Reputation 1,354.876∗∗∗ 1,181.137∗ 1,213.204∗∗∗ (455.639) (626.936) (421.718) Experience −0.247∗ −0.114 −0.158 (0.134) (0.129) (0.097) Question Length −3.488 2.407 1.599 (3.826) (2.004) (1.630) Constant −4,928.021∗∗ −4,801.956∗ −4,721.190∗∗ (2,116.499) (2,754.668) (1,841.329) Observations 75 125 200 R-squared 0.147 0.190 0.165 Notes:
a. OLS: standard errors are in parentheses.
b. Significant at:∗10%,∗∗5%, and∗∗∗1% level, respectively.
Based on our specifications, we find a significant price effect in both the GA sample (2) and the pooled sample (3), but not in the experimental sam-ple (1). In specifications (2) and (3), a higher price leads to a significantly longer answer (rejecting the null in favor of Hypothesis 1). More specifically, a one dollar increase in price leads to 12 more words in the answer. Further-more, we find a significant reputation effect in the experimental sample (1) and the pooled sample (3), whereas this effect is weaker in the GA sample (2). Thus, a one-star increase in an answerer’s reputation score leads to 1355 (respectively 1181 and 1213) more words in the answer in the experimental (respectively GA and pooled) sample. In comparison, neither researcher ex-perience nor question length has a significant effect on answer length. Lastly, we note that theex antepromise of tips, conditional or not, has no significant effect on the answer length in the experimental sample (1). Thus, we fail to reject the null in favor of Hypothesis 3.
In sum, in our experimental sample, we find a robust and significant researcher reputation effect on answer length, but no price effect. In com-parison, in the GA sample, there is a significant price effect and a weak rep-utation effect on answer length.
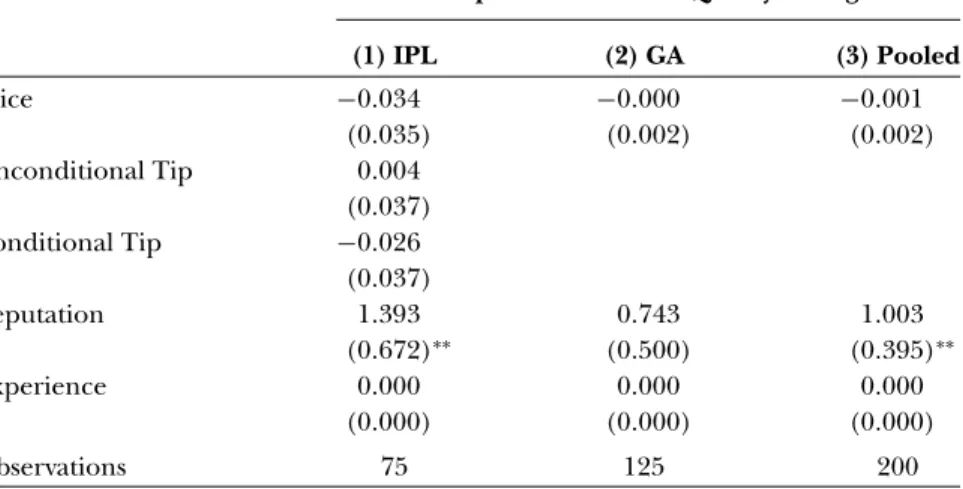
Next, we investigate the determinants of answer quality. Table 5 presents three ordered probit specifications, where the dependent variable is the
Table 5: Ordered probit: determinants of answer quality Dependent Variable: Quality Rating
(1) IPL (2) GA (3) Pooled Price −0.034 −0.000 −0.001 (0.035) (0.002) (0.002) Unconditional Tip 0.004 (0.037) Conditional Tip −0.026 (0.037) Reputation 1.393 0.743 1.003 (0.672)∗∗ (0.500) (0.395)∗∗ Experience 0.000 0.000 0.000 (0.000) (0.000) (0.000) Observations 75 125 200 Notes:
a. Ordered probit: standard errors are in parentheses. b. Significant at:∗∗5% level.
Table 6: Marginal effect of reputation in ordered probit regressions
Median Quality Rating 1 2.5 3 3.5 4 4.5 5
Specification (1): Reputation ME −.03 −.03 −.09 −.19 −.12 .22 .24 Specification (2): Reputation ME −.03 −.03 −.11 −.07 .03 .05 .17 Specification (3): Reputation ME −.01 −.02 −.04 −.12 −.11 .00 .10
median quality rating of an answer across all raters, ranging from one to five stars. Again, the three specifications correspond to the 75 IPL, 125 GA, and the pooled 200 question–answer pairs, respectively. While price is no longer significant in any specification, researcher reputation is still significant in both the experimental (1) and pooled (3) samples. This finding indicates that a higher price does not necessarily lead to a higher quality answer (fail-ing to reject the null in favor of Hypothesis 2). However, a researcher with a higher reputation score provides significantly better answers (rejecting the null in favor of Hypothesis 6). We compute the marginal effects of the re-searcher reputation score at each of the seven median quality rating scores in Table 6. We find that, while the marginal effect of reputation is negative when an answer is evaluated at or below a reputation score of four stars, it becomes positive above four stars. The reputation effect in our experiment is consistent with a similar effect for YA documented in Adamic et al. (2008). Additionally, we note that the promise of tips, conditional or not, has no sig-nificant effect on the quality of answers, by which we fail to reject the null in favor of Hypothesis 4.
Interestingly, in contrast with our finding that price has no significant effect on quality, Harper et al. (2008) find that a higher price leads to higher quality answers. We point to three major differences in our quality rating pro-cedures and theirs. First, our raters are semi-professionals trained in Library and Information Science, while theirs are undergraduate English majors. Second, our raters rate only the official answer, while theirs rate the official answer and the comments (if any) as a package. Third, while unanswered questions are excluded from our analysis, they are included and coded as having the lowest quality in theirs. Since most unanswered questions are in the lower price range, this choice drives their price effect. Using the Harper et al GA data and the Heckman (1979) two-stage estimation procedure, Jeon, Kim and Chen (2010) find that, while a higher price significantly in-creases the likelihood that a question receives an answer, it does not have an effect on answer quality. Thus, their re-analysis of the Harper et al data yields consistent results with our data. Furthermore, re-rating the Harper et al data with our rating protocols, they find significant difference between En-glish majors and semi-professionals. However, rating an answer and its com-ments as a package results in statistically insignificant differences in quality ratings.
Finally, we compare answer quality under conditional versus uncondi-tional tips and find no significant difference (p =0.633, Wilcoxon ranksum test). Therefore, we fail to reject the null in favor of Hypothesis 5.
In sum, we find no price or tip effect in our experimental sample. Specif-ically, posting a higher price does not necessarily lead to a better answer. Likewise, the promise of a tip does not seem to affect either answerer effort or answer quality. By contrast, one robust finding from our analysis is the effect of answerer reputation. An answerer with a higher reputation score provides significantly longer and better answers. One can interpret this re-sult in several ways. From a contract theory perspective, reputation might be a noisy signal of an answer’s type. The negative (though insignificant) effect of experience on length and the lack of an effect on quality might indicate that a high ability type remains high ability. Alternatively, it may indicate that those with a high reputation exert a higher effort. We conjecture that a high-quality answer needs both high ability and effort. An effective reputation system could motivate high ability types to exert a high effort to maintain their reputation.
In comparison, in our random GA sample, we find a significant price effect on answer length but not on quality. One plausible explanation for this finding is that price may signal the difficulty of the question or the im-portance of the answer to the asker. We find some empirical support for the former explanation. In our GA sample, the correlation between price and average question difficulty is 0.46 (p <0.01). The longer answer length could indicate that a more difficult question needs a longer answer, or that an answerer signals her effort through a longer answer.
6. Conclusion
Since the emergence of the Internet, the online question-and-answer knowl-edge market has become a common venue for knowlknowl-edge exchange. Such markets are deeply interesting because they enable knowledge sharing on a global scale. In this paper, we make an initial attempt to study a price-based knowledge market and analyze how three features of the market affect an-swerer effort and answer quality. Our ultimate goal is to understand which features facilitate effort and quality. Using a field experiment, we systemat-ically vary the asker-posted price and tip format for providing high-quality answers in a market where there exists a system for reputation building by answerers.
We find that price has no effect on answer length or quality in our exper-imental sample. However, in our random GA sample, we find that a higher asker-posted price increases answerer effort. That is, answerers spend more time on a question, as measured by answer length, when askers post a higher price. One plausible explanation is that price serves as a signal of the level of difficulty of a question. However, we find that this extra effort does not translate into higher answer quality.
Related to the price effect, we find that neither the level nor the type of tip has an effect on either answerer effort or answer quality. If tips were perceived as part of the total compensation, one would expect to see effects. Instead, a potential explanation for our findings is that tips are viewed by an-swers as an indication of asker “niceness” rather than answer compensation. Future research could investigate this question further.
Lastly, we find that an answerer’s past reputation has an effect on both answerer effort and answer quality. In a world of anonymous interactions, reputation becomes the most powerful way of signaling quality. In GA, repu-tation can have two kinds of payoffs. First, answerers with higher repurepu-tations may be more sought after by askers. Indeed, we sometimes observed that an asker would request that a particular answerer take her question. Second, the outputs of high reputation answerers are more likely to be perceived favor-ably by askers in cases where there may be uncertainty in determining quality. Hence, answerers with high reputations are seen as spending more time and producing higher quality answers. This result also suggests that having a sys-tem allowing exchange parties to build reputations is a crucial feature for achieving high efficiency in knowledge markets.
Beyond knowledge markets, various reputation systems have emerged to encourage high-quality contributions to public goods. For example, to en-courage contribution from new reviewers, Amazon’s Classic Reviewer Rank, which counts a lifetime number of reviews, is now complemented by its New Reviewer Rank, which puts more weight on more recent reviews. In an-other example, leaderboards in the ESP game (http://www.espgame.org/) motivate high-quality contributions of metadata for images on the Inter-net to facilitate search, while contribution-based status levels at Slashdot
(http://slashdot.org/) help sustain a core group of dedicated contributors. Systematic exploration of the effects of various reputation systems on contri-bution to public goods is a promising area of research with enormous poten-tial for real-world applications.
Appendix: Training and Rating Session Instructions
Training Session InstructionsYou are now taking part in a study that seeks to characterize the quality of answers in digital reference or commercial question-answering services. Your participation will take the form of rating questions and their corresponding answers on several factors. You will initially take part in a training session, followed by five rating sessions spaced over the course of the week. We ask you to not communicate with the other raters during the rating sessions, nor to discuss your rating activities outside of this room during the course of this week. Should you have any questions during your sessions please ask us.
The purpose of this training session is to familiarize you with the rating methodology to be employed, and to ensure a common understanding of the factors used. However, this does not mean that you should all give identical ratings. We want to emphasize there is no single correct way to rate any of these question–answer pairs. We are interested in eliciting objective ratings from impartial raters. We ask you to rely on your own judgment when rating. In this training session you will be asked to rate two question–answer pairs. For each question–answer pair, you will be asked for nine ratings, as shown below:
1. Please rate the difficulty of thequestion. (1=very easy. . .5=very difficult)
2. Please rate theanswerfor the following factors:
(1=strongly disagree. . .5=strongly agree, NA=Not Applicable) (a) The question that was asked is answered.
(b) The answer is thorough, addressing all question parts. (c) The sources cited are credible and authoritative. (d) The links provided are to relevant web sites or pages.
(e) Information in the cited sources is summarized.
(f) Only information pertinent to the question is presented.
(g) The answer is well-organized and written clearly, avoiding jargon and/or inappropriate language.
3. Please rate the overall quality of theanswer. (1=very low quality. . . 5=very high quality)
Are there any questions?
The procedure we will follow in the training session is as follows: 1. You will each receive two rating sheets and your rater ID.
2. You will rate the first question–answer pair, working individually. Please write your rater ID on the rating sheet for Question 1, then open a browser window and go to the following web page: http://www-personal.si.umich.edu/∼kimym/training/Q1.html Enter your ratings on the rating sheet.
3. Please let us know when you have finished rating the first question– answer pair. We will wait until all the raters have completed rating. Do not proceed to the second pair.
4. When all raters have completed rating the first question–answer pair, there will be a brief discussion, no longer than 15 minutes, regarding the rating activity. We will go over each rating, asking all of you for your ratings. We will also present our ratings and why we rated them so. You may ask us questions at any time.
5. When all questions have been addressed, we will move on to the second question–answer pair, and repeat the procedure used for the first pair. The second question–answer pair is on the following web page: http://www-personal.si.umich.edu/∼kimym/training/ Q2.html
6. Please return your completed rating sheets to us.
Are there any questions? Before we start, we would like to ask you to please take the time to read each question and answer pair carefully when rating. We have found that it takes between 7 and 10 minutes to rate each question when evaluating them carefully. If there are no further questions, let’s begin.
Rating Session Instructions
The actual ratings will be done using a web-based system. The system has been programmed to show you 20 question–answer pairs for rating per login session. Once you have rated twenty pairs you will be automatically logged out. If you have to quit your session before answering all twenty, simply close the browser window.
Instructions for rating on the web:
To start your rating session, please go to the following web page: http://www-personal.si.umich.edu/∼kimym/login.php
Now follow these steps:
1. Login using the login and password given to you by the coordinator. 2. Provide the nine ratings requested for the question–answer pair.
3. When you are done, click ‘Submit’ - note that you will not be permit-ted to continue until you have entered all nine ratings.
4. The next question–answer pair will be presented.
5. When you have finished rating the session limit, you will be shown a ‘Goodbye’ screen.
6. Close the browser.
References
ADAMIC, L., J. ZHANG, E. BAKSHY, and M. ACKERMAN (2008) Knowledge Sharing and Yahoo Answers: Everyone knows something, Proceeding of the 17th interna-tional conference on World Wide Web, 665–674, Beijing, China.
ANDREONI, J., and R. PETRIE (2008) Beauty, gender and stereotypes: Evidence from laboratory experiments,Journal of Economic Psychology29, 73–93.
BIDDLE, J., and D. HAMERMESH (1998) Beauty, productivity, and discrimination: Lawyers’ looks and lucre,Journal of Labor Economics16, 172–201.
EDELMAN, B. (2004) Earnings and ratings at Google Answers, Manuscript, Harvard University.
GAZAN, R. (2006) Specialists and synthesists in a question answering community, in Proceedings of the 69th Annual Meeting of the American Society for Informa-tion Science and Technology.
HARPER, F., D. RABAN, S. RAFAELI, and J. KONSTAN (2008) Predictors of swer quality in online Q&A sites, in CHI’08: Proceeding of the twenty-sixth an-nual SIGCHI conference on Human factors in computing systems, New York, NY, USA, 865–874.
HECKMAN, J. (1979) Sample selection bias as a specification error,Econometrica47, 153–161.
JEON, G., Y. KIM, and Y. CHEN (2010) Re-examining price as a predictor of answer quality in an online Q&A Site, Proceedings of the 28th international conference on Human factors in computing systems (CHI 2010), Atlanta, GA, 325–328. LANDRY, C., A. LANGE, J. LIST, M. PRICE, and N. RUPP (2006) Toward an
under-standing of the economics of charity: Evidence from a field experiment,Quarterly Journal of Economics121, 747–782.
MCCREA, R. (2004) Evaluation of two library-based and one expert reference service on the Web,Library Review53, 11–16.
NAM, K., M. ACKERMAN, and L. ADAMIC (2009) Questions in, knowledge in? A study of Naver’s question answering community, in CHI’2009: Proceeding of the twenty-seventh annual SIGCHI conference on Human factors in computing systems, Boston, MA.
RABAN, D., and F. HARPER (2008) Motivations for answering questions online, New Media and Innovative Technologies.
RAFAELI, S., D. RABAN, and G. RAVID (2005) Social and economic incentives in Google answers, in ACM Group 2005 Conference.
REGNER, T. (2009) Why voluntary contributions? Google answers!, Technical Re-port, Universit¨at Jena.
RESNICK, P., R. ZECKHAUSER, J. SWANSON, and K. LOCKWOOD (2006) The value of reputation on eBay: a controlled experiment,Experimental Economics9, 79–101.
ROUSH, W. (2006) What’s the best Q&A site?,MIT Technology Review.
SCHARLEMANN, J., C. ECKEL, A. KACELNIK, and R. WILSON (2001) The value of a smile: Game theory with a human face,Journal of Economic Psychology 22, 617–640.
SHAH, C., J. OH, and S. OH (2008) Exploring characteristics and effects of user participation in online Q&A sites,First Monday13.
SHROUT, P., and J. FLEISS (1979) Intraclass correlations: Uses in assessing rater reliability,Psychological Bulletin86, 420–428.
STRAYHORN, J., J. MCDERMOTT, and P. TANGUAY (1993) An intervention to im-prove the reliability of manuscript reviews for theJournal of the American Academy of Child and Adolescent Psychiatry,The American Journal of Psychiatry150, 947–952. TINSLEY, H., and D. WEISS (2000) Interrater reliability and agreement, inHandbook
of Applied Multivariate Statistics and Mathematical Modeling, Howard E. A. Tinsley and Steven D. Brown eds. San Diego, CA: Academic Press.
VAN ROOYEN, S., N. BLACK, and F. GODLEE (1999) Development of the review quality instrument (RQI) for assessing peer reviews of manuscripts, Journal of Clinical Epidemiology52, 625–629.
WOOD, M., M. ROBERTS, and B. HOWELL (2004) The reliability of peer reviews of papers on information systems,Journal of Information Science30, 2–11. YANG, J., L. ADAMIC, and M. ACKERMAN (2008) Competing to share expertise:
The Taskcn knowledge sharing community, in ICWSM 2008.
ZHANG, J. (2008) A Laboratory study of communication in asymmetric group con-test over public goods, Manuscript, Purdue University.