INTEGRATION OF UNSUPERVISED CLUSTERING ALGORITHM
AND SUPERVISED CLASSIFIER FOR PATTERN RECOGNITION
By
LEONG SHI XIANG
A Dissertation submitted for partial fulfilment of the requirement for the
degree of Master of Science (Microelectronic Engineering)
ii
Acknowledgement
First of all, I would like to express the deepest appreciation to my research supervisor, Professor Dr. Nor Ashidi Mat Isa for his guidance and advices which had given to me throughout this research study especially in proper research skills and proper technical writing skill. Without his supervision, this research would not have been possible.
Secondly, I would like to thanks my parents for their spiritual and financial support. Next, I would like to express an appreciation to my manager, who always support for my study and completion of this study.
It is a pleasure to offer my regards and thanks also to those who made this thesis possible and those who helped me during the research. This dissertation could not have been possible without their help and support.
Last, but not least, I would like to thank the Dean and staff of the School of EE, USM for their valuable support.
iii
Table of Contents
Acknowledgement ... ii
Table of Contents ... iii
List of Tables ...v
List of Figures and Illustrations ... vi
List of Abbreviations and Nomenclature ... viii
Abstrak ... ix
Abstract ... xi
CHAPTER 1 ...1
INTRODUCTION ...1
1.1 Background ...1
1.2 Pattern Recognition System ...2
1.3 Problem Statement ...4 1.4 Research Objective ...5 1.5 Research Scope ...5 1.6 Thesis Outline ...6 CHAPTER 2 ...7 LITERATURE REVIEW ...7 2.1 Introduction ...7
2.2 Unsupervised Clustering Algorithm ...8
2.2.1 ClusteringTechniques ...9
2.2.1.a Hierarchical Clustering ...10
2.2.1.b Partitional Clustering ...12
2.2.2 K-Means Clustering Algorithm ...13
2.2.3 Fuzzy C-Means Clustering Algorithm ...16
2.2.4 Applications of Unsupervised Clustering Algorithms ...18
2.2.4.a Image Segmentation Using Clustering ...18
2.2.4.b Object and Character Recognition ...19
2.3 Supervised Learning Classification ...22
2.3.1 Naïve Bayes Classifier ...23
2.4 Summary ...23
CHAPTER 3 ...25
METHODOLOGY ...25
3.1 Introduction ...25
3.2 Overall Proposed Classification System ...25
3.3 Phase 1: Clustering Data into Classes ...27
3.3.1 K-Means Clustering Algorithm ...28
3.3.2 Fuzzy C-Means Clustering Algorithm...29
3.4 Phase 2: Classification of Data Using Supervised Classifier ...30
3.4.1 Naïve Bayes Classifier ...31
3.4.2 Parameter Estimation for Naïve Bayes Classifier ...32
3.5 Performance Analysis and Data Samples ...32
3.5.1.a Data Sample: Firsher’s Iris ...33
iv
3.5.1.c Data Sample: Bacteria18Class ...34
3.5.2 Performance Analysis ...36
3.5.2.a K-Fold Cross Validation ...36
3.5.2.b Accuracy and Error Rate ...38
3.6 Summary ...39
CHAPTER 4 ...40
RESULT AND DISCUSSION ...40
4.1 Introduction ...40
4.2 Result of Unsupervised Clustering Algorithm ...40
4.3 Result of Integration of Unsupervised Clustering Algorithm and Supervised Classifier System. ...49
4.4 Summary ...51
CHAPTER 5 ...52
CONCLUSION AND FUTURE WORK ...52
5.1 Conclusion ...52
5.2 Future Work ...53
v
List of Tables
Table 3.1 Number of species of bacteria that involve in Bacteria18Class ... 35 Table 4.1 Overall accuracy of clustering using K-Means and FCM Clustering algorithms
for three data sets ... 41 Table 4.2 Classification accuracy of the proposed integrated system. ... 49
vi
List of Figures and Illustrations
Figure 1.1 A generic PRS Scheme ... 2
Figure 2.1 General idea of clustering ... 8
Figure 2.2 A taxonomy of clustering approaches ... 10
Figure 2.3 Points falling in three clusters ... 11
Figure 2.4 The dendrogram obtained using the single-link algorithm... 12
Figure 2.5 The K-Means algorihtm is sensitive to the initial partition ... 14
Figure 2.6 A dataset with three clusters recognized by K-Means algorithm ... 15
Figure 2.7 K-Means produces wrong clusters for k=1(a), k=2(b) and k=4(c) for the same datasets as in Figure 2.6 ... 15
Figure 2.8 Fuzzy Clusters ... 17
Figure 2.9 Feature representation for clustering ... 19
Figure 2.10 A subset of views of Cobra chosen from a set of 320 views ... 20
Figure 2.11 Hierarchical grouping of 320 views of a cobra sculpture ... 21
Figure 3.1 Overall flow of the proposed classification system ... 26
Figure 3.2 Overall flow of the evaluation of clustering's algorithm ... 27
Figure 3.3 Odour sniffing setup ... 36
Figure 3.4 Graph showing the stopping point for the back propagation error ... 37
Figure 3.5 Example of k-Fold cross validation ... 38
Figure 4.1(a) Distribution of Fisher’s Iris original data ... 41
Figure 4.1(b) Distribution of Fisher’s Iris data after clustered by K-Means algorithm ... 42
Figure 4.1(c) Distribution of Fisher’s Iris data after clustered by Fuzzy C-Means algorithm ... 42
Figure 4.2(a) Distribution of Wine original data ... 43
Figure 4.2(b) Distribution of Wine data after clustered by K-Means algorithm ... 43
Figure 4.2(c) Distribution of Wine data after clustered by Fuzzy C-Means algorithm .... 44
vii
Figure 4.3(b) Distribution of Bacteria18Class data after clustered by K-Means algorithm ... 45 Figure 4.3(c) Distribution of Bacterial18Class data after clustered by Fuzzy C-Means
viii
List of Abbreviations and Nomenclature
Abbreviation arg CVPR FCM KM max MATLAB MSE OCRs PR PRS UCI Meaning arguments
Computer Vision and Pattern Recognition Fuzzy C-Means
K-Means maxima
Matrix Laboratory Mean Square Error
Optical Character Readers Pattern Recognition
Pattern Recognition System UC Irvine
ix
Integrasi Algoritma Pengelompokan Tanpa Selia dan Pengelas Terselia untuk Pengelasan Corak
Abstrak
Dalam dunia sebenar, masalah pengecaman corak adalah dalam pelbagai bentuk dan kritikal dalam kebanyakan tugas membuat keputusan dalam kalangan manusia. Dalam sistem pengecaman corak, adalah amat penting untuk mencapai ketepatan yang tinggi. Terdapat dua jenis kaedah pengecaman corak iaitu secara terselia atau tanpa selia. Masalah dalam penggunaan pengecaman corak tanpa selia adalah ia memerlukan ‘guru’ semasa proses pengelasan. Selain itu, ia perlu belajar sendiri yang boleh menyebabkan penghasilan pengelasan yang lemah. Untuk pengelasan terselia, bagi mencapai ketepatan yang tinggi, data latihan terlabel dengan jumlah yang besar dikehendaki semasa proses pengelasan.Walau bagaimanapun, dalam kehidupan yang sebenar, proses pelabelan memerlukan masa yang panjang dan biasanya dilakukan secara manual. Bagi menyelesaikan masalah-masalah tersebut, integrasi algoritma pengelompokan tanpa selia dan pengelas terselia dicadangkan. Objektif bagi penyelidikan ini adalah untuk mengkaji keupayaan sistem integrasi yang dicadangkan dalam proses pengelasan corak. Bagi mencapai objektif tersebut, penyelidikan ini dibahagikan kepada dua fasa. Fasa yang pertama adalah bertujuan untuk menilai prestasi algoritma pengelompokan. Manakala, fasa yang kedua adalah bertujuan untuk mengkaji prestasi sistem integrasi yang dicadangkan di mana pengelas Naïve Bayes digunakan. Data yang telah dikelompokkan dalam fasa pertama digunakan sebagai data latihan. Dengan menggunakan sistem integrasi yang dicadangkan, limitasi pengelompokan tanpa selia dapat diatasi. Bagi pengelas terselia, masa pelabelan dapat dikurangkan dan lebih banyak contoh latihan dapat
x
dilabel. Di dalam penyelidikan ini, ketepatan pengecaman corak telah berjaya ditingkatkan. Sebagai contoh, berbanding dengan hanya menggunakan algoritma pengelompokan tanpa selia, selepas menggunakan sistem integrasi yang dicadangkan, ketepatan pengelasan bagi set data Fisher’s Iris, Wine dan Bacteria18Class telah meningkat masing-masing dari 88.67% kepada 96.00%, dari 78.33% kepada 83.45% dan dari 93.33% kepada 94.67%. Keputusan itu menunjukkan bahawa sistem integrasi yang dicadangkan boleh diterima dan boleh meningkatkan prestasi. Walau bagaimanapun, kajian lanjut diperlukan dalam ciri pengekstrakan dan di bahagian pengelompakan kerana prestasi pengelasan corak masih bergantung kepada ketepatan data masukan.
xi
Integration of Unsupervised Clustering Algorithm and Supervised Classifier for Pattern Recognition
Abstract
In a real world, pattern recognition problems in diversified forms are ubiquitous and are critical in most human decision making tasks. In pattern recognition system, achieving high accuracy in pattern classification is crucial. There are two general paradigms for pattern recognition classification which are supervised and unsupervised learning. The problems in applying unsupervised learning/clustering is that this method requires teacher during the classification process and it has to learn independently which may lead to poor classification. Whereas for supervised learning method, it requires teacher or prior data (i.e. large, prohibitive and labelled training data) during classification process which in real life, the cost of obtaining sufficient labelled training data is high. In addition, the labelling is time consuming and done manually. To solve the problems mentioned, integration of unsupervised clustering algorithm and the supervised classifier is proposed. The objective of this research is to study the performance/capability of the integration between both unsupervised and supervised learning. In order to achieve the objective, this research is separated into two phases. Phase 1 is mainly to evaluate the performance of clustering algorithm (K-Means and FCM). Phase 2 is to study the performance of proposed integration system which using the data clustered to be used as train data for Naïve Bayes classifier. By adopting the proposed integration system, the limitation of the unsupervised clustering method can be overcome and for supervised learning, the labelling time can be reduced and more training examples are labelled which can be used to train for supervised classifier. As the result, the pattern classification accuracy is also
xii
increase. For examples, after applying the proposed integration system, the classification accuracy of Fisher’s Iris, Wine and Bacteria18Class has been increased from 88.67% to 96.00%, from 78.33% to 83.45% and from 93.33% to 94.67% respectively as compared to only used unsupervised clustering algorithm. The result has shown that the proposed integration system could be applied to increase the performance of the classification. However, further study is needed in the feature extraction and clustering algorithms part as the performance of the pattern classification is still depending on the data input.
1
CHAPTER 1
INTRODUCTION
1.1 Background
Pattern recognition is a process of description, grouping, and classification of patterns. In our real life, pattern recognition is one of the most important functionalities for intelligent behavior and it is displayed by both biological and artificial systems. For biological organisms which occur in nature, human are able to recognize specific patterns and respond appropriately for survival. For example, antibodies attack foreign intruders, our ears capture sound and speech, and animals locate edible plants and capture prey (Rosenfeld et al., 2000).
Besides that, pattern recognition is also very well known in the field of computer vision. Historically, it is originated from a leading computer vision conference, named Conference on Computer Vision and Pattern Recognition (CVPR). To add on this, pattern recognition is a branch of machine learning that focuses on the recognition of patterns and regularities in data, although in some cases, it is been known to be nearly similar to the machine learning (Bishop, 2006). The main difference between pattern recognition and machine learning is that pattern recognition has a higher interest to formalize, explain and visualize the pattern. On the other hand, machine learning traditionally focuses on maximizing the recognition rates. Yet, all of these domains have evolved substantially from their roots in artificial intelligence, engineering and statistics.
The field of pattern recognition is concerned mainly with the description and analysis of measurements taken from physical processes which consists of acquiring raw data and taking actions based on the class of the patterns recognized in the data (Anjum, 2008). Moreover, pattern recognition problems in diversified forms are ubiquitous and are critical in most human
2
decision making tasks (Micheli-Tzanakou, 2000). Since the trend of our daily life will depend more on artificial system, thus it is important to solve the problems and improve the situations with the help of technology and continuous of research. Some of applications of artificial systems involves in our daily life are the classification of spectral data (for ecosystem and land management), optical character readers (OCRs) and biometrics (Rosenfeld et al., 2000).
1.2 Pattern Recognition System
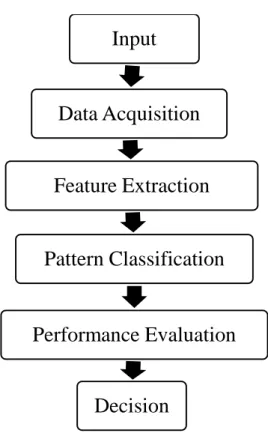
A pattern recognition system (PRS) is an automatic system that aims at classifying the input pattern into a specific class. Figure 1.1 shows a generic pattern recognition system scheme. This figure summarizes the principal aspects of a PRS (Rosenfeld et al., 2000).
Figure 1.1: A Generic PRS Scheme
Input
Data Acquisition
Feature Extraction
Pattern Classification
Performance Evaluation
Decision
3
There are four major components for PRS which are data acquisition, feature extraction, pattern classification and performance evaluation. The details explanation are as below (Rosenfeld et al., 2000):
i. Data Acquisition: Any pattern recognition system has to sense its environment and acquire an initial representation of its immediate surroundings that is as faithful as possible. Data acquisition goes beyond raw data (i.e. a system that acquires visual data may emulate the architecture of the human visual system).
ii. Feature Extraction: Feature extraction includes both derivation and selection approaches. Derivation approach involves representation, whereas selection is concerned with the choice of a meaningful subset of features for the purpose of successful pattern classification. These extracted features will be used as input attributes for intelligent classifier in the next stage (i.e. pattern classification). iii. Pattern Classification: Once the features have been extracted, the process is
continued by pattern classification. The choice of a distance or similarity metric to measure or possibly rank how close an unknown pattern is in relation to known class prototypes is included in the design of the pattern classification. The design of the pattern classifier also includes the choice of a particular model and possibly the estimation of its probability density function. A taxonomy consisting of probabilistic, hyperplane, kernel, and exemplar classifiers can be formed by the practical differences between classifiers and internal differences in how classifiers form decision regions. (Lippmann, 1989).
iv. Performance Evaluation: In particular, to perform meaningful benchmark studies, the development of standard databases and common evaluation procedures are required in performance evaluation which includes collection of large and
4
representative databases and the design of evaluation procedures for comparing competing algorithms.
For automatic pattern recognition (PRS), the primary task consists of feature extraction and classification. Although some effective technologies have been developed, there exist many challenging problems in this field (Micheli-Tzanakou, 2000). In overall, there are two general paradigms for pattern recognition classification which are supervised and unsupervised learning. While supervised and unsupervised learning classification are widely used in many fields including pattern recognition classification, the classification accuracy remain a challenge to solve in PRS.
Thus, this study will focus on the pattern classification and evaluation of its performance in order to improve the classification accuracy, thus giving more accurate percentage during decision making part.
1.3 Problem Statement
As mentioned, there are two paradigms for pattern recognition classifications (i.e. supervised and unsupervised learning). A supervised learning identifies an unknown pattern as a member of a predefined class, while an unsupervised learning or clustering groups input patterns into a number of clusters. In this study, clusters will be defined as classes hereafter. In short, supervised learning carries out classification process with prior knowledge whereas unsupervised clustering without prior knowledge.
The problem in applying unsupervised clustering is that it has no teacher during the classification process and has to learn independently which may lead to poor classification. Whereas the problem in applying supervised learning methods is that it requires teacher during classification process which in real life the cost of obtaining sufficient labelled training data is
5
very high and labelling normally consumes a lot of time and it is typically done manually (Liu, Chien-Liang et al., 2016). This also brings an impact to the accuracy of classifier (pattern classification) and the decision making part.Thus, it is important to find a solution to solve the problems and improve pattern classification performance.
1.4 Research Objective
Despite the problem statement mentioned above, the objective of this research is to study the performance/capability of the integration between both unsupervised and supervised learning for better accuracy of pattern classification.
1.5 Research Scope
The limitations of this study are as below:
i. For the unsupervised clustering algorithm, the number of clusters must be pre-determined.
ii. Dealing with large number of dimensions and large number of data items can be problematic because of time complexity for unsupervised clustering algorithm. iii. Only basic clustering algorithms (i.e. K-Means clustering and FCM clustering
algorithms) and basic supervised classifier (i.e. Naïve Bayes) are used for this research.
iv. This study will use two types of data which are benchmark data and real case data. For the benchmark data, two data set will be taken from UCI machine learning repository (i.e. Fisher’s Iris and Wine) and one real case data (i.e. Bacteria18Class) will be taken from previous research. The details of the data sets used is further discussed in Chapter 3.
6
1.6 Thesis Outline
This thesis is presented with five chapters.
In Chapter 1, the research background, focus on pattern recognition system and problem statement are presented. The research objectives and scopes are also outlined here.
In Chapter 2, two general paradigms for pattern recognition classification namely unsupervised clustering and supervised classification are discussed in this chapter. Advantage and disadvantage of each type are also studied and included. The applications of each in pattern recognition fields are also included in this chapter.
In Chapter 3, the flow of the proposed integration system is presented as well as the methodologies used to evaluate the performance. Besides that, the details of mathematics’
equations and steps of algorithms used are also presented in this chapter. Last, the details of the data sets used are also included in this chapter.
In Chapter 4, the performance of the proposed integration system is evaluated and discussed. Lastly, Chapter 5 concludes the overall findings from the study. The recommendations for future works on this area are stated as well.
7
CHAPTER 2
LITERATURE REVIEW
2.1 Introduction
As mentioned in background in Chapter 1, the main focus for this study will be on the pattern classifiers and performance evaluation on PRS. The paper by Lippmann in 1989 suggest that there are practical differences between classifiers and internal differences in how classifiers form decision regions which can lead to a taxonomy consisting of probabilistic, hyper-plane, kernel and exemplar classifiers (Lippmann, 1989). In general, these classifiers can be viewed as supervised learning classifiers and unsupervised learning or clustering in PRS.
Moreover, clustering and classification are the major subdivisions of pattern recognition techniques. Using these techniques, samples can be classified according to a specific property by measurements indirectly related to the property of interest. An empirical relationship or classification rule can be developed from a set of samples for which the property of interest and the measurements are known. The classification rule can then be used to predict the property in samples that are not part of the original training set (Meyers, 2000).
This chapter will discuss the areas of research related to this project which includes overview of unsupervised clustering and supervised learning classification, overview of the algorithms and techniques used in pattern recognition for clustering and classification. The problems faced for the unsupervised and supervised learning in pattern recognition used and the applications of each techniques in pattern recognition.
8
2.2 Unsupervised Clustering Algorithm
In clustering, objects of the dataset are grouped into clusters, in such a way that groups are very different from each other and the objects in the same group or cluster are very similar to each other (Kaur et al., 2013). On the other hands, clustering is also known as a collection of data items which has similarities between them and dissimilarities to data items in other clusters (Irani et al., 2016). Figure 2.1 shows the general idea of clustering.
Figure 2.1: General Idea of Clustering
From the Figure 2.1, three clusters can be easily identified into which the data can be divided. The similarity criterion isdistance: two or more objects belong to the same cluster if they are close according to a given distance (in this case geometrical distance). This is called distance-based clustering.
The goal of clustering algorithm is to determine the intrinsic grouping in a set of unlabelled data. A good clustering algorithm can be shown if there is no absolute best criterion which would be independent of the final aim of the clustering. Consequently, this criterion is supplied by user in such a way that the result of the clustering which suit their needs (Abonyi et al., 2007).
9
Although clustering is now frequently used, there are several main problems related to it as follows (Niu, 2016):
i. Dealing with large number of dimensions and large number of data items can be problematic because of time complexity.
ii. The effectiveness of the method depends on the definition of distance (for
distance-based clustering).
iii. User must define the distance if an obvious distance measure does not exist, which is not always easy, especially in multi-dimensional spaces.
2.2.1 Clustering Techniques
Clustering techniques have increased in popularity over the past couple of decades, example those proposed by Anderberg in 1973 and Jain and Dubes in 1988. As mentioned, the goal of clustering is to reduce the amount of data by categorizing or grouping similar data items together. However, such grouping is pervasive in the way human process information, and one of the motivations for using clustering algorithms is to provide automated tools to help in constructing categories or taxonomies (Dhavamany et al, 2010). Thus, to minimize the effects of human factors in the process, some clustering methods had been developed.
In fact, the clustering methods (Chernoff, 1975) can be divided into two basic types which are hierarchical and partitional clustering. Within each of the types there exists a wealth of subtypes and different algorithms for finding the clusters. Different approaches to clustering data can be described with the help of the hierarchy shown in Figure 2.2. At the top level, there is a distinction between hierarchical and partitional approaches (hierarchical methods produce a nested series of partitions, while partitional methods produce only one)
10
Figure 2.2: A taxonomy of clustering approaches.
2.2.1.a Hierarchical Clustering
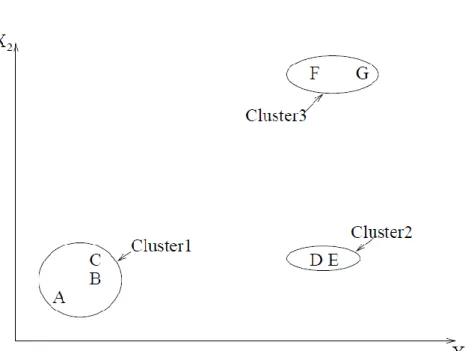
The operation of a hierarchical clustering algorithm is illustrated using the two dimensional data set like in Figure 2.3. This figure depicts seven patterns labelled A, B, C, D, E, F, and G in three clusters. A hierarchical algorithm yields a dendrogram representing the nested grouping of patterns and similarity levels at which groupings change. These algorithms can be either agglomerative or divisive (Sembiring et al., 2011). Agglomerative algorithms begin with each element as a separate cluster and merge them into successively larger clusters while divisive algorithms begin with the whole set and proceed to divide it into successively smaller cluster (Shawkat et al,. 2009).
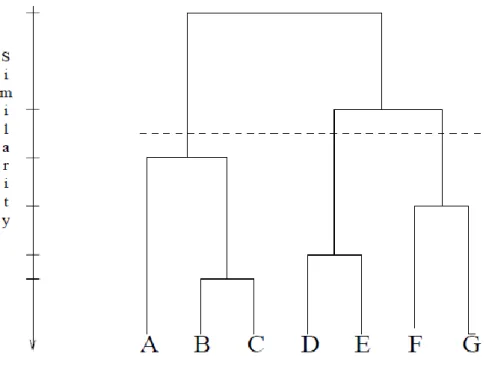
A dendrogram corresponding to the seven points in Figure 2.3 is shown in Figure 2.4. The dendrogram can be broken at different levels to yield different clustering of the data. Most hierarchical clustering algorithms are variants of the single-link (Sneath et al., 1973), complete-link (King, 1967), and minimum-variance (Ward et al., 1963, Murtagh, 1984) algorithms. Among these, the single-link and complete-link algorithms are most popular. These two
Clustering Hierarchical Partitional Single Link Complete Link Mode Seeking Mixture Resolving Graph Mixture Square Error K-means Expectation Maximization Fuzzy C-Means
11
algorithms differ in the way they characterize the similarity between a pair of clusters. In the single-link method, the distance between two clusters is the minimumof the distances between all pairs of patterns drawn from the two clusters (one pattern from the first cluster, the other from the second). In the complete-link algorithm, the distance between two clusters is the maximum of all pairwise distances between patterns in the two clusters. In either case, two clusters are merged to form a larger cluster based on minimum distance criteria. The complete-link algorithm produces tightly bound or compact clusters (Baeza, 1992). The single-complete-link algorithm, by contrast, suffers from a chaining effect (Nagy, 1968).
12
Figure 2.4: The dendrogram obtained using the single-link algorithm (Nagy, 1968).
Hierarchical algorithms on the other hand, are more flexible than partitional algorithms. As an example, for data sets with non-isotropic clusters (i.e. well-separated, chain-like, and concentric clusters), single-link clustering algorithm is preferable, while for data sets with isotropic clusters, a typical partitional algorithm such as the k-means algorithm was reported to produce better results (Nagy, 1968).
On the other hand, in term of time and space, the partitional algorithms are typically lower than those of the hierarchical algorithms (Day, 1992). In order to reduce the limitation and improve the performance, Murty et al. (1980) has proposed to hybridize both types of algorithms.
13
2.2.1.b Partitional Clustering
In partitional clustering, a single partition of the data is obtained instead of a clustering structure, such as the dendrogram produced by a hierarchical technique. One advantage of partitional methods is in applications which involving large data sets for the construction of a dendrogram is computationally prohibitive.
One of the limitation of a partitional algorithm is the choice of the number of desired output clusters as mentioned by Dubes (1987). Normally, clusters are produced by optimizing a criterion function defined either locally (on a subset of the patterns) or globally (defined over all of the patterns) using the partitional techniques. It is clearly impossible for combinatorial search of the set of possible labelling for an optimum value of a criterion. In practice, therefore, the best configuration obtained from all runs is used as the output clustering after the algorithm run for multiple times with different starting states.
2.2.2 K-Means Clustering Algorithm
From section above, the most intuitive and frequently used criterion function in partitional clustering techniques is the squared error criterion, which tends to work well with isolated and compact clusters. This criterion is widely used in K-Means algorithm as well.
The K-Means is the simplest and most commonly used algorithm employing a squared error criterion (McQueen, 1967). It starts with a random initial partition and keeps reassigning the patterns to clusters based on the similarity between the pattern and the cluster centroid until a convergence criterion is met (e.g., there is no reassignment of any pattern from one cluster to another, or the squared error ceases to decrease significantly after some number of iterations).
14
The K-Means algorithm is popular because it is easy to implement, and its time complexity is O(n), where n is the number of patterns. Figure 2.5 shows seven two-dimensional patterns. If start with patterns A, B, and C as the initial means around which the three clusters are built, then we end up with the partition {{A}, {B, C}, {D, E, F, G}} shown by ellipses. The squared error criterion value is much larger for this partition than for the best partition {{A, B, C}, {D, E}, {F, G}} shown by rectangles, which yields the global minimum value of the squared error criterion function for a clustering containing three clusters. The correct three-cluster solution is obtained by choosing, for example, A, D, and F as the initial three-cluster means. The details algorithm will be covered in Chapter 3.
Figure 2.5: The K-Means algorithm is sensitive to the initial partition (Jain et al., 1999).
Although K-Means algorithm has been widely used in data analyses, pattern recognition and image processing, it also has some problems. A major problem with this algorithm is that it is sensitive to the selection of the initial partition and may converge to a local minimum of the criterion function value if the initial partition is not properly chosen (Jain et al., 1999). Besides that, the reason for the sensitivity is due to it requires a priori knowledge
15
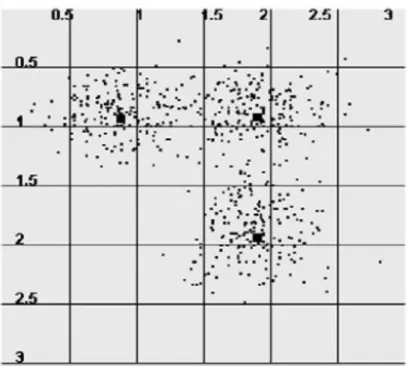
about the data or in the worst case, guessing the number of clusters. When the input number of clusters (k) is equal to the real number of clusters (k’), the K-Means algorithm correctly discovers all clusters, as shown in Figure 2.6, where cluster centres are marked by squares. Otherwise, it gives incorrect clustering results, as illustrated in Figure 2.7(a–c) (Zalik, 2008).
Figure 2.6: A dataset with three clusters recognized by K-Means algorithm for k=3 (Zalik, 2008).
16
Figure 2.7: K-Means produces wrong clusters for k=1(a), k=2(b) and k=4(c) for the same datasets as in Figure 2.6, which consists of three clusters. The black square denotes the
location of the converged cluster centroid (Zalik, 2008).
2.2.3 Fuzzy C-Mean Clustering Algorithm
At present, there exists many fuzzy clustering algorithms, for example, Fuzzy C-Means Clustering (Dunn, 1974, Bezdek, 1981), Entropy-Based Fuzzy Clustering (Chattopadhyay et al., 2011), Dynamic Fuzzy Clustering (Nguyen et al, 2013) and so on (Liu et al, 2016). Among all of the clustering algorithms, the most widely used is the Fuzzy C-Means (FCM) algorithm, because it has the advantage of robustness for ambiguity and maintains much more information than any hard clustering methods (Lu et al., 2013). This clustering technique is a multiple-clustering technique initially proposed by Dunn and then generalized by Bezdek in 1981.
Traditional clustering approaches generate partitions. In a partition, each pattern belongs to one and only one cluster. Hence, the clusters in a hard clustering are disjoint. Fuzzy C-Means is actually based on fuzzy clustering which extends this notion to associate each
17
pattern with every cluster using a membership function (Zadeh, 1965). The output of such algorithms is a clustering, but not a partition.
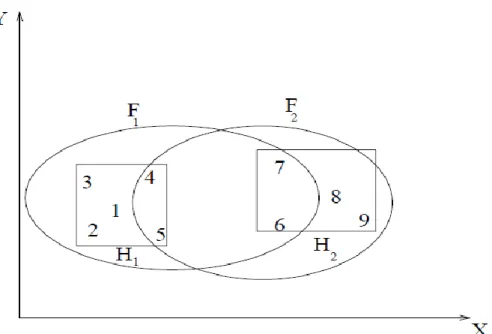
In fuzzy clustering, each cluster is a fuzzy set of all the patterns. Figure 2.8 illustrates the idea. The rectangles enclose two hard clusters in the data: H1={1,2,3,4,5} and H2= {6,7,8,9}. A fuzzy clustering algorithm might produce the two fuzzy clusters F1 and F2 depicted by ellipses. The patterns will have membership values in [0, 1] for each cluster. For example, fuzzy cluster F1 could be compactly described as: {(1,0.9), (2,0.8), (3,0.7), (4,0.6), (5,0.55), (6,0.2), (7,0.2), (8,0.0), (9,0.0)} and F2 could be described as: {(1,0.0), (2,0.0), (3,0.0), (4,0.1), (5,0.15), (6,0.4), (7,0.35), (8,1.0), (9,0.9)}.
Figure 2.8: Fuzzy Clusters (Zadeh, 1965).
The ordered pairs
i,i
in each cluster represent the i-th pattern and its membership18
of the pattern to the cluster. A hard clustering can be obtained from a fuzzy partition by thresholding the membership value. The details of the algorithm is covered in Chapter 3.
In short, Fuzzy C-Means algorithm is good at solving the problem of fuzziness and uncertainty in an image which is widely applied in the field of image segmentation (Yan et al., 2016).Even though it is better than the hard K-Means algorithm at avoiding local minima, FCM can still converge to local minima of the squared error criterion (Jain et al, 1999). The design of membership functions is the most important problem in fuzzy clustering. Different choices include those based on similarity decomposition and centroids of clusters.
2.2.4 Applications of Unsupervised Clustering algorithms
Clustering algorithms have been used in a large variety of applications (Jain et al., 1988, Rasmussen, 1992, Oehler et al., 1995, Fisher et al., 1993). Example of the areas are (i) image segmentation and (ii) object and character recognition.
2.2.4.a Image Segmentation Using Clustering
An image segmentation is typically defined as an exhaustivepartitioning of an input imageinto regions, each of which is consideredto be homogeneous with respect to someimage property of interest (e.g., intensity,colour, or texture) (Dorai et al., 1995). Image segmentation is a fundamental component in many computer vision applications, and can be addressed as a clustering problem (Rosenfeld et al., 1982).
The segmentation of the images presented to an image analysis system is critically dependent on the scene to be sensed, the imaging geometry, configuration, and sensor used to transduce the scene into a digital image, and ultimately the desired output (goal) of the system.
19
The applicability of clustering methodology to the image segmentation problem was recognized over three decades ago, and the paradigms underlying the initial pioneering efforts are still in use today. A recurring theme is to define feature vectors at every image location (pixel) composed of both functions of image intensity and functions of the pixel location itself. This basic idea, as shown in Figure 2.9, has been successfully used for intensity images (with or without texture), range (depth) images and multispectral images.
Figure 2.9: Feature representation for clustering (Dorai et al., 1995).
In Figure 2.9, the image measurements and positions are transformed to features. Clusters in feature space correspond to image segments.
20
2.2.4.b Object and Character Recognition
The use of clustering to group views of 3D objects for the purposes of object recognition in range data was described in Dorai and Jain (1995). The term viewrefers to a range image of an unoccluded object obtained from any arbitrary viewpoint. Avoid matching an unknown input view against each image of each object was one of the goal among the possible views of a 3D object.
Indexing is one of a common theme in the object recognition literature, which the selection a subset of views from a subset of the objects in the database is used as the unknown view for further comparison, and rejects all other views of objects. One of the approaches for indexing is to employ the notion of view classes. The set of qualitatively similar views of an object was known as view classes. Thus, by using clustering, the view classes were identified and the technique outlined the rest of this subsection.
As an example of object recognition, let refer to Figure 2.10. The Figure 2.10 shows a subset of the collection of views of Cobra used in the research by Dorai et al. (1995). 3,200 range images of 10 different sculpted objects with 320 views per object from the database were used (Dorai et al., 1995). The objects were synthesized which contain the range images from 320 possible view points (determined by the selection of the view-sphere using the icosahedron).
21
Figure 2.10: A subset of views of Cobra chosen from a set of 320 views) (Dorai et al., 1995).
The shape spectrum of each view is computed and then its feature vector is determined. The views of each object are clustered, based on the dissimilarity measure between their moment vectors using the complete-link hierarchical clustering scheme (Jain et al, 1988). The hierarchical grouping obtained with 320 views of the Cobra object is shown in Figure 2.11. The view grouping hierarchies of the other nine objects are similar to the dendrogram in Figure 2.11. Dorai and Jain demonstrated that this clustering-based view grouping procedure facilitates object matching in terms of classification accuracy and the number of matches necessary for correct classification of test views. Object views are grouped into compact and homogeneous view clusters, thus demonstrating the power of the cluster based scheme for view organization and efficient object matching (Dorai et al., 1995).
22
Figure 2.11: Hierarchical grouping of 320 views of a cobra sculpture (Dorai et al., 1995).
2.3 Supervised Learning Classification
Supervised learning is widely used in the machine learning field as well as pattern recognition. It refers to the learning task of inferring a function from labelled training data. Nevertheless, supervised learning is a model prepared through a training process, which required to make predictions and tested when predictions are correct or wrong.
In pattern classification which based on supervised learning, the dataset is usually divided in two parts namely training set and a test set, being the first used to project the classifier and the second used for validation, by measuring its classification errors (accuracy). This process must be also repeated several times with randomly selected training and test samples to achieve a conclusion about the statistics of its accuracy due to robustness and
23
precision (Papa et al., 2009). The performance of a supervised learning method can be assessed by the classification rate, which is, the number of successes and failures of the final model in classifying the data. Reducing the number of failures is important for obtaining the most reliable classification function for the data.
Although supervised learning can perform better than the unsupervised clustering, the problem in applying supervised learning methods to real-world problems is (Liu, Chien-Liang et al., 2016):
i) It require a large, prohibitive, number of labelled training examples to learn accurately.
ii) The cost of obtaining sufficient labelled training data while in real life, labelling is time consuming and typically done manually.
There are many types of supervised learning classifiers for the pattern recognition classification namely, statistical classifiers, linear classifiers, support vector machines, quadratic classifiers and more.
2.3.1 Naïve Bayes Classifier
Naïve Bayes Classifier is one type linear classification. Moreover, Naïve Bayes is known as a simple probabilistic classifier based on applying Bayes' theorem with strong (naive) independence assumption (John et al, 1995).Bayesian classification is an effective method for prediction, it gives more efficiency than other algorithms in computing.
In the supervised learning, Bayesian classifier is used for prediction. Bayesian method is mutually exclusive and exhaustive. The attributes of Bayesian is independent in the class. It
24
consists of the estimation of conditional probability of each attribute in the dataset. Bayesian classifier is suitable for complete database (Hani et al., 2010).
In simple explanation, an assumption is made by the Naïve Bayes classifier which is the presence (or absence) of a particular feature of a class is unrelated to the presence (or absence) of any other feature (Siuly et al., 2017). The Naive-Bayes classification is a simple and fast technique to classify the categorical data based on the concept of conditional probabilities derived from observed frequencies in the training data.
2.4 Summary
In summary, there are two fundamental problems in pattern recognition which are the identification of natural groups (clustering) composed by samples with similar patterns and the classification of each sample in one of possible classes (labels).
As mentioned, there are two types of classification in pattern recognition which are unsupervised clustering classifications and supervised classification. Although both techniques are widely used in pattern recognition, there are problems with each of the techniques used as mentioned above. Despite the problems mentioned above for pattern classification, it is also possible to improve results by applying modifications to the training data that is used by the supervised learning algorithms.