Multiattribute perceptual mapping with idiosyncratic
brand and attribute sets
Tammo H. A. Bijmolt&Michel van de Velden
Published online: 2 February 2012
#The Author(s) 2012. This article is published with open access at Springerlink.com
Abstract This article proposes an extremely flexible procedure for perceptual mapping based on multiattribute ratings, such that the respondent freely gener-ates sets of both brands and attributes. Therefore, the brands and attributes are known and relevant to each participant. Collecting and analyzing such idiosyn-cratic datasets can be challenging. Therefore, this study proposes a modification of generalized canonical correlation analysis to support the analysis of the complex data structure. The model results in a common perceptual map with subject-specific and overall fit measures. An experimental study compares the proposed procedure with alternative approaches using predetermined sets of brands and/or attributes. In the proposed procedure, brands are better known, attributes appear more relevant, and the respondent’s burden is lower. The positions of brands in the new perceptual map differ from those obtained when using fixed brand sets. Moreover, the new procedure typically yields positioning information on more brands. An empirical study on positioning of shoe stores illustrates our procedure and resulting insights. Finally, the authors discuss limitations, potential application areas, and directions for research.
Keywords Perceptual mapping . Brand positioning . Multiattribute ratings . Adaptive data collection methods . Canonical correlation analysis
T. H. A. Bijmolt (*)
Department of Marketing, Faculty of Economics and Business, University of Groningen, PO Box 800, 9700 AV Groningen, The Netherlands
e-mail: [email protected] M. van de Velden
Econometric Institute, Faculty of Economics, Erasmus University Rotterdam, PO Box 1738, 3000 DR Rotterdam, The Netherlands
1 Introduction
Marketing managers frequently make decisions about product (re)design and brand (re)positioning, for which they might rely on a framework in which consumers offer their evaluations and choices of a limited set of perceptual attributes (Kaul and Rao
1995; Van Kleef et al.2004). A product can be characterized as a bundle of attributes, and each brand receives a score on each attribute (Lancaster1971). Then the brands can be represented graphically in a so-called perceptual map that spans the attributes. The relative position of competitive brands has proven very informative for managers (Cornelius et al. 2010; Johnson and Hudson 1996), and research that proposes improvements to perceptual maps adds to product and brand management abilities (Day et al.1979; Dillon et al. 1985; Kaul and Rao 1995; Shocker and Srinivasan
1979; Van Kleef et al. 2004). In this article, we propose a new, extremely flexible perceptual mapping methodology that allows each consumer to decide which brands and attributes to evaluate.
Of the various methods proposed and applied to obtain perceptual maps, a basic distinction exists between decompositional and compositional approaches (Huber and Holbrook1979). Decompositional approaches analyze overall judgments of brands, such as dissimilarities or preferences, with multidimensional scaling (Carroll and Green 1997; Cooper 1983), whereas compositional approaches assess consumer ratings of brands according to various attributes using factor analysis, discriminant analysis, canonical correlation analysis, or an alternative multivariate analysis method (Dillon et al.1985; Green and Douglas Carroll1988; Hauser and Koppelman1979; Holbrook and Moore 1982; Huber and Holbrook 1979; Steenkamp et al.1994). In this paper, we focus on the compositional approaches.
Steenkamp et al. (1994) propose a compositional procedure based on individual-specific attribute sets. Their approach grants each consumer the freedom to indicate which attributes he or she uses in product perceptions. They then evaluate the brands, using the idiosyncratic attribute sets. The advantage of such an approach is that subjects only evaluate objects according to attributes relevant to them. However, consumers also differ in their knowledge of the brands. We build on the work of Steenkamp et al. (1994) and extend their approach to multiattribute perceptual mapping that allows for idiosyncratic sets for both attributes and brands. In particular, we propose a procedure for perceptual mapping based on multiple attribute ratings, in which the sets of both brands and attributes are individual specific and generated by each respondent. This tactic ensures that the brands are known to the subjects and the attributes are relevant for their evaluations.
The remainder of this paper is organized as follows. In the next section, we provide a rationale for perceptual mapping based on idiosyncratic sets of brands and attrib-utes, and we discuss methods to collect such idiosyncratic datasets. Next, we offer a generalized canonical correlation analysis procedure, as developed by Van de Velden and Bijmolt (2006), which we use to assess the complex data structure. The analysis model produces a common perceptual map and various fit measures. In an experi-mental study, we compare this procedure to alternative approaches, namely, tradi-tional multiattribute perceptual mapping and the procedure proposed by Steenkamp et al. (1994). Finally, we discuss limitations, potential application areas, and directions for further research.
2 Idiosyncratic brand and attribute sets
When building perceptual maps based on multiattribute rating data, the determination of input for the analysis is perhaps the most important issue (Dillon et al.1985; Shocker and Srinivasan1979). Defining the set of brands to be evaluated and set of attributes to be used represent key steps in the study design phase (Kaul and Rao
1995). The perceptual map thus derived contains only brands included in a prespe-cified set and is based solely on selected attributes. This potential distortion increases the danger of externally invalid results, leading various researchers to propose procedures that can facilitate the selection of brands (Day et al.1979; Srivastava et al. 1984) and attributes (Bech-Larsen and Nielsen 1999; Bottomley et al. 2000; Breivik and Supphellen2003; Steenkamp and Van Trijp 1997; Van Ittersum et al.
2007). However, the researcher still must make the final decision about which brands and attributes to include, and there is always the possibility that some brands and/or attributes are erroneously included or excluded.
Beyond this uncertainty about the correctness of the brand and attribute sets for the perceptual mapping study, decision makers must consider the appropriateness of some brands and/or attributes for specific consumers. Consumers differ considerably in (1) the brands they know and (2) the attributes they deem relevant for a product category. If the sets of brands and attributes remain fixed across consumers, some consumers must provide judgments even if they have insufficient knowledge. The lack of information may lead a consumer to make inferences about a brand score for an unfamiliar attribute for example, such as by using an overall evaluation of the brand, related attributes for which brand values are known, typical attribute values within the product category, or some other anchor value (Greenleaf1992; Lynch et al.
1991; Sanbonmatsu et al.1992). If an attribute value is unknown to a respondent, he or she thus might use a multitude of processes and inferences (Kardes et al.2004) to derive a final rating, which could cause substantial bias in the data.
2.1 Elicitation of attributes and brands
In general, a broad range of factors affects the importance of an attribute and/or brand ratings on those attributes (e.g., Dillon et al.2001; Mason et al.2001). For example, if the attribute provides strong differentiation across brands and the consumer lacks further information, attribute importance may shift upward (Muthukrishnan and Kardes2001). Therefore, careful procedures for selecting brands and attributes are necessary.
To diminish the distorting effects of insufficient knowledge about brand scores on attributes, the brands and attributes to be evaluated can be elicited from individual respondents. Proposed elicitation procedures include free elicitation or direct ques-tioning, hierarchical dichotomization, Kelly’s repertory grid, free sorting, and ranking tasks (Shocker and Srinivasan 1979). Comparisons of these elicitation procedures (Bech-Larsen and Nielsen 1999; Steenkamp and Van Trijp 1997) indicate high convergent validity across the various methods with respect to the attributes elicited, though free elicitation also offers other important advantages that make it the preferred method. In free elicitation, the respondent, in response to a direct prompt, lists attributes that are important for a certain decision, such as choosing among
brands. A free elicitation task induces a strong focus on intrinsically relevant attrib-utes and yields relatively large sets of attribattrib-utes, though it remains time efficient and attractive to subjects.
Less research considers alternative methods for generating sets of relevant brands; a common assumption is simply that the set of brands in a certain market or product category is given or readily apparent (Kaul and Rao1995). However, direct ques-tioning about relevant brands can be successful, as demonstrated for brand elicitation in positioning studies and customer-oriented approaches to market definition (Day et al.1979; Srivastava et al.1984). Such unaided recall measures also reflect important familiarity-related aspects of a particular brand for a consumer, which facilitates correct evaluations. Finally, the exact formulation in the elicitation task determines which brands will be included. Consumer perceptions of brands will be based on various sources, such as purchasing, consumption, advertisements, and word-of-mouth communication. For example, the researcher can determine whether experi-ence with purchasing or consumption of the brand is crucial or not and alter the brand selection question accordingly.
Considering its relative advantages and widespread use, we adopt free elicitation to generate individual-specific attribute and brand sets, as recommended by Breivik and Supphellen (2003) and Steenkamp and Van Trijp (1997).
3 Model
3.1 Data collection
In our flexible perceptual mapping procedure, the data collection stage starts with the free elicitation of respondent-specific sets of important attributes and known brands by each respondenti01,…,N. We allow the numbers of both rows (brands)Miand columns (attributes)Pito differ between theNobserved matrices (respondents). The respondent then rates each brand on each of the attributes. Thus, we observe matrices
Xi of order Mi×Pi, i01,…, N. Although the numbers of rows and columns are
respondent specific, there is an important difference between them. First, we deter-mine before the analysis stage which rows of different data matrices correspond to the same brands. Thus, the set of brands evaluated by respondentiis a subset of the entire set of brands, j01, …, M. Second, the columns are completely idiosyncratic, so product attributes used by different respondents remain specific to each person instead of being content analyzed and classified in advance.
3.2 Analysis model
The objective of perceptual mapping is to obtain a common, low-dimensional space for all M brands that best represents the information contained in the observed matricesXi. For our data, we do so by applying a generalization of the canonical
correlation analysis proposed by Carroll (1968). Carroll’s generalized canonical correlation analysis aims to derive Q linear combinations of the (centered) data matricesXiin such a way that the sum of the squared distances between the linear
minimum. A key characteristic of this method is that the data matricesXimay have different column orders, such that the number of attributesPiis subject specific. The number of rowsMhowever is the same for all respondentsi. Steenkamp et al. (1994) also apply generalized canonical correlation analysis to analyze the multiattribute ratings ofNconsumers evaluating Mbrands using idiosyncratic sets of Piproduct attributes.
For our proposed data collection procedure, each respondentievaluates a subset of Mibrands on an idiosyncratic set ofPiattributes, whereMiis restricted to be larger than 1 for methodological reasons. Next, we consider only the distances (differences) between the linear combinations of the observedMirows ofXiand the corresponding rows in the group configurationY. To do so, we use a modified version of generalized canonical correlation analysis (Van der Burg1988; Van der Burg et al.1994; Van de Velden and Bijmolt 2006) that employs selection matrices. In this method, each respondent evaluates only those brands known to him/her on attributes that are relevant to him/her. Yet, the analysis model derives a common perceptual map from this data with idiosyncratic sets of brands and attributes. The method accommodates the idiosyncratic brand sets by selecting the appropriate brands/rows for each respon-dent and it accommodates the idiosyncratic attributes sets by fitting the common dimensions ofYto the attributes/columns of Xiwithout requiring a content-based match between the columns. For a technical exposition of the method, we refer to
Appendix I.
3.3 Assessing model fit
To assess the quality of a solution, we use, in accordance with Van der Burg et al. (1994) a measure called variance accounted for (VAF). The VAF is calculated as follows. For each respondent, we regress each column (i.e., each attribute) of the data matrix on the dimensions of the group configuration. Averaging the corresponding coefficients of determination (i.e., R2) produces the VAF. Alternatively, one could calculate a so-called redundancy index (Gleason 1976) by considering, for each respondent, the variance in the observed variables accounted for by the linear predictions and averaging these. For standardized data and equal numbers of rows in each set, the redundancy index is equivalent to the VAF. In other cases, it tends to be very similar.
3.4 Assessing the dimensionality of the configuration
The number of dimensions in the group configuration must be determined by the researcher, who should balance model fit against parsimony. Adding one or more dimensions to the configuration improves model fit but lowers parsimony. To make the determination, a researcher can gather multiple solutions that vary in the number of dimensions and compute the corresponding fit measures, then choose the lowest number of dimensions for which the model fit is still sufficient. Comparable to a scree test in factor analysis, it might be beneficial to look for an elbow in a plot of the VAFs or redundancy indices against the number of dimensions. However, these fit measures for solutions of different dimensionalities must be calculated separately.
4 Experimental comparison
4.1 Purpose
The perceptual mapping procedure we propose differs from existing procedures in that the brands and attributes to be judged are determined by individual respondents. Because a respondent is likely uncertain about judgments of unknown brands and/or irrelevant attributes, the resulting data may be less valid. However, our procedure requires an additional step in the data collection procedure, namely, the selection of brands and attributes, which may induce respondent fatigue and have a negative impact on data quality. To examine the relative advantages of various procedures, we therefore conduct an experiment to compare three alternative methods, including both respondents’evaluations of the task and the perceptual maps obtained.
4.2 Study design
We compare three data collection procedures for multiattribute perceptual mapping: (1) our proposed procedure with idiosyncratic sets of brands and attributes, (2) the procedure of Steenkamp et al. (1994) with idiosyncratic attribute sets but a fixed brand set, and (3) traditional multiattribute ratings with fixed sets of brands and attributes. For the latter two procedures, to determine brand and attribute sets in advance, we conducted a small-scale preliminary study to identify brands and attributes that consumers typically select with our proposed procedure. To select the brands, we also examined actual market shares. In addition, the number of brands and attributes should be feasible and comparable to regular perceptual mapping studies. Therefore, we selected 10 brands and eight attributes for the traditional procedure; to increase generalizability, we also replicated our study using two different product categories, supermarket chains and car brands.
The data were collected through an Internet survey conducted with the CentER-panel of Tilburg University, The Netherlands. The CentER-panel is representative of the population of Dutch households, and our total sample size was 1,224 subjects. To prevent cross-task and order effects, we applied a 3 (data collection procedures)×2 (product categories) between-subjects design, with respondents randomly assigned to one of the six treatments. Sample sizes per cell ranged from 182 to 227. In the overall sample, 48% of respondents were men; 33% were younger than 35 years and 31% were 65 years or older.
The main judgment task consisted of multiattribute ratings of brands. In a brand-by-brand approach, the respondents rated all attributes on a 10-point scale with labeled end points. For tasks with fixed brand and/or attribute sets, the order of these brands and attributes was random across respondents, but the order of attributes remained constant across the different brands for each individual respondent. Because the sets of brands and/or attributes were not determined in advance for some experimental cells, we developed two judgment tasks to select the respondent-specific brands and attributes. First, each respondent indicated,“Which supermarkets do you know? Please think of supermarkets where you do your grocery shopping as well as supermarkets which you do not visit usually.”Second, for the attributes, they revealed,“Which attributes of supermarkets do you consider to be important when
deciding where to shop?”Similar questions featured the other product category, car brands. Such free elicitation tasks are fast and yield relatively many attributes (Bech-Larsen and Nielsen1999) and have been recommended by Breivik and Supphellen (2003) and Steenkamp and Van Trijp (1997). We limited the number of self-generated brands and attributes to a maximum of 10 and eight, respectively, to match the sizes of the fixed brand and attribute sets. Respondents also had to label the end points (1 and 10) for each self-generated attribute then considered the brands one by one to rate each of them on the attributes.
At the end of the online questionnaire, respondents viewed a list of items associ-ated with task evaluation dimensions: attribute relevance, brand knowledge, judg-ment certainty, task simplicity, and task attitude (see Appendix II). For each task evaluation dimension, we included three or four items, one or two of which were reverse coded, and used a seven-point scale, from 10totally disagree to 70totally agree. The order of the items was random across subjects. All five scales indicate sufficient internal consistency, with Cronbach’s alpha values between 0.67 and 0.83. Therefore, we averaged the items to obtain the overall measures of the five evaluation dimensions. 4.3 Results: evaluation of judgment tasks
For some respondents, the number of brands (attributes) was fixed to 10 (eight), but other respondents self-selected either the attributes or both brands and attributes. People in the respective treatments groups mentioned an average of 6.3 supermarket chains and 8.6 car brands with 4.7 and 4.2 attributes for supermarkets and automo-biles, respectively. The number of attributes elicited is lower than in studies by Steenkamp and Van Trijp (1997:8.62) and Bech-Larsen and Nielsen (1999: 9.53). We speculate that this could be due to product category effects or to differences in wording of the elicitation task.
The data collection procedures differ significantly according to measures of the relevance of the attributes (Table1). For both product categories, the attributes in idiosyncratic sets appear more relevant, and relative evaluations of brand knowledge and judgment certainty depend on the product category. For supermarkets, the respondents indicate much greater knowledge of the idiosyncratic brand sets than for the fixed sets. In this sense, our proposed procedure considerably outperforms existing procedures. Certainty in judgments, which combines attribute relevancy and brand knowledge, improves as we move from a procedure with all fixed sets, to only fixed brand sets, to idiosyncratic brand and attribute sets. For car brands though, we find no significant differences in brand knowledge or judgment certainty across the three procedures.
For both product categories, task simplicity is similar across the three procedures. It thus appears that the burden of the brand and attribute elicitation tasks balances out the effort differences that mark the three attribute rating tasks. The task attitude measures indicate that the respondents actually enjoy procedures with one or two idiosyncratic sets better than the procedure with all fixed sets, especially for the supermarket category.
Thus with the exception of the relevance of the attributes, the three procedures do not differ substantially for judgments of car brands. Perhaps subjects are familiar with many automobile brands (as indicated by the higher brand knowledge ratings for the
T able 1 Co mparison of compositiona l methods: task eva luation results T ask evalua tion dimensions a Attribute releva nce Brand knowledg e Judg ment certainty T ask simplicity T ask attitude Produc t category Rating proced ure A ver age evaluati ons Super markets Idio syncra tic brand and attribute sets 5.45 a 4.31 a 4.56 a 4.74 a 4.37 a Fixed brand set and idiosy ncratic attribute set 5.29 a 2.67 b 3.99 b 4.72 a 4.31 a Fixed brand and attribute sets 4.79 b 2.43 b 3.68 c 4.51 a 3.92 b Autom obile s Idio syncra tic brand and attribute sets 4.28 a 3.37 a 3.20 a 3.85 a 3.75 a Fixed brand set and idiosy ncratic attribute set 4.14 a,b 3.41 a 3.15 a 3.79 a 3.48 a Fixed brand and attribute sets 4.00 b 3.39 a 3.08 a 3.87 a 3.42 a Factor ANOV A res ults Data colle ction proced ure ( d.f . 0 2, 1,21 8) F 0 15.04 F 0 52.4 3 F 0 10.3 5 F 0 0.49 F 0 5.28 p < 0.001 p < 0.00 1 p < 0.00 1 p 0 0.613 p 0 0.00 5 Produc t category ( d.f. 0 1, 1,21 8) F 0 220. 19 F 0 9.85 F 0 105. 23 F 0 90.3 2 F 0 43.6 2 p < 0.001 p 0 0.00 2 p < 0.00 1 p < 0.001 p < 0.00 1 Data colle ction proced ure × produc t catego ry ( d.f . 0 2, 1,21 8) F 0 3.17 F 0 55.9 0 F 0 6.12 F 0 1.12 F 0 1.03 p 0 0.042 p < 0.00 1 p 0 0.00 2 p 0 0.327 p 0 0.35 7 aPer eva luation dimension and prod uct ca tegory . A verages that share a supersc ript are not significa ntly dif ferent at the 0.05 level
fixed brand sets, compared with those for supermarkets), but they lack detailed or diagnostic information (i.e., relatively low ratings on attribute relevance and judg-ment certainty). As a consequence, task simplicity and task attitude worsen for all respondents who judge automobiles instead of supermarkets, irrespective of the data collection procedure.
4.4 Results: comparison of perceptual maps
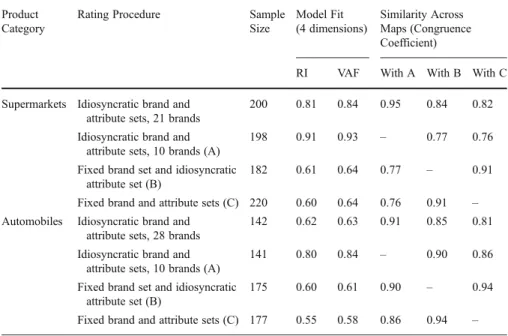
For each product category, we analyze four datasets, which represent evaluations of the fixed brand set obtained with each of the three procedures, plus evaluations of all brands self-selected by at least 10 people for the procedure using idiosyncratic brand sets. This latter criterion yields a set of 21 supermarkets and 28 automobile brands. For the supermarket data, the free brand elicitation method surprisingly excluded one of the supermarkets from the fixed set. We had selected this supermarket (A&P) on the basis of its market share in the Netherlands (about 4%), yet it did not appear well known among our respondents. The explanation may be regional, in that A&P has attained very high market share in a small region of the country but remains poorly known in other areas. We deleted any non-informative respondents, including those who rated only one brand or one attribute or rated all brands exactly the same across all attributes. The final number of subjects per dataset ranges between 141 and 220 (Table2). For each dataset, we obtained solutions for one to eight dimensions with generalized canonical correlation analysis as described in the model section. Using the relative changes in model fit (RI and VAF), we selected four-dimensional solutions for both product categories. In Table2, we provide the model fit for each analysis and the similarity (congruence coefficient) between solutions.
Table 2 Comparison of compositional methods: model fit and congruence across maps Product
Category
Rating Procedure Sample
Size Model Fit (4 dimensions) Similarity Across Maps (Congruence Coefficient)
RI VAF With A With B With C
Supermarkets Idiosyncratic brand and
attribute sets, 21 brands
200 0.81 0.84 0.95 0.84 0.82
Idiosyncratic brand and attribute sets, 10 brands (A)
198 0.91 0.93 – 0.77 0.76
Fixed brand set and idiosyncratic attribute set (B)
182 0.61 0.64 0.77 – 0.91
Fixed brand and attribute sets (C) 220 0.60 0.64 0.76 0.91 –
Automobiles Idiosyncratic brand and
attribute sets, 28 brands
142 0.62 0.63 0.91 0.85 0.81
Idiosyncratic brand and attribute sets, 10 brands (A)
141 0.80 0.84 – 0.90 0.86
Fixed brand set and idiosyncratic attribute set (B)
175 0.60 0.61 0.90 – 0.94
For both product categories, the model fit (RI and VAF) is clearly highest for the dataset with idiosyncratic brand and attributes sets, limited to 10 brands from the fixed sets. Apparently, the ratings provided by respondents who select the brands and judged them on self-selected attributes are most consistent across subjects.
To compare perceptual maps, we use the congruence coefficient, which reveals the similarity of interpoint Euclidean distances in two configurations. Lorenzo-Seva and ten Berge (2006) show that congruence values in the range 0.85–0.94 correspond to fair similarity, and higher values indicate near equivalence. For our proposed fully idiosyncratic procedure, the relative position of the set of 10 brands is barely affected, whether the rest of the brand set is analyzed simultaneously or not, as indicated by the congruence coefficients of 0.95 and 0.91, for supermarkets and car brands, respec-tively. The same result holds for the maps derived with the two procedures using fixed brand sets, with congruence coefficients of 0.91 and 0.94. However, with congruence coefficients between 0.76 and 0.90, we see that the correspondence between the procedures using idiosyncratic brand sets versus those with fixed brand sets is considerably lower. For example, inspection of the four-dimensional coordi-nates shows that in the maps based on the fixed sets, the points corresponding to the Albert Heijn and Aldi supermarkets are separated from one cluttered group of all other supermarkets. Using idiosyncratic sets, Albert Heijn and Aldi remain separated but the clutter of supermarkets disappears and store-specific positions can be identi-fied. Hence, whether the brand set is fixed or idiosyncratic has a substantial impact on the resulting perceptual map.
4.5 Conclusions
Our newly proposed approach offers clear advantages with respect to the data-collection task. The attributes of the idiosyncratic sets appear more relevant than those in the fixed attribute sets. In addition, the brands of the idiosyncratic sets are at least as familiar (automobiles) or more familiar (supermarkets) to respondents than those in fixed brand sets. Thus respondents enjoy the judgment task more and are more certain about their judgments. Furthermore, the resulting perceptual maps are minimally affected by the rating procedure applied, and the relative position of the core set of 10 brands is similar across all solutions. However, the procedure with idiosyncratic brand sets offers the advantage of revealing the relative positions of a larger set of brands.
5 Empirical application
5.1 Study design
To illustrate the proposed perceptual mapping procedure, we apply it in a positioning study of shoe stores in The Netherlands. Customers of shoe stores will differ in the attributes they use to evaluate stores and in their familiarity with the stores. These differences create problems if everyone must evaluate all shoe stores on all attributes; therefore, it offers a suitable context for illustrating our perceptual mapping procedure.
We recruited 42 respondents using a mall intercept method. Each respondent completed a questionnaire, on which the first question asked,“Which characteristics of shoe stores do you consider to be important when deciding where to go shopping for shoes?”We then asked, “Which shoe stores are you familiar with? You should think of stores where you tend to purchase your shoes, but also shoe stores where you would probably not make a purchase.”Next, the respondent received a matrix-type sheet and filled in the characteristics from question 1 as column labels and the shoe stores from question 2 as row labels. In addition, we asked them to label both extreme ends of the scale (1 and 10) for each attribute. Finally, the ratings for the shoe stores in this matrix followed a semantic differential scale, from 1 to 10.
On average, respondents listed 6.9 shoe stores, with a minimum of 1 and a maximum of 13. In addition, they listed 4.9 attributes on average, with a minimum of 3 and a maximum of 7. We decided to retain shoe stores mentioned by at least four subjects, which results in a total of 19 brands, a relatively large set for perceptual mapping. Finally, we eliminated respondents who only assessed one shoe store from this set of 19 brands, reducing the total to 38 respondents, who rated on average 5.9 of the 19 shoe stores and used 4.8 attributes on average.
5.2 Results
We analyze the dataset for an increasing number of dimensions (1–8) and find increasing model fit, according to both the RI measure (0.41, 0.65, 0.74, 0.86, 0.95, 0.98, 0.99, and 0.99) and the VAF measure (0.37, 0.63, 0.73, 0.86, 0.94, 0.97, 0.98, and 0.99). Because model fit is satisfactory for the two-dimensional solution, to provide a simple visuali-zation of the results, we present the perceptual map with two dimensions in Fig.1.
In the perceptual map in Fig. 1, stores are spread over the map, with several subgroups of close competitors and some outsiders. For example, V&D is positioned far away from the other stores; most other stores in this study sell only shoes, but V&D is a department store. In addition, compared with the other stores, V&D has a very broad assortment, of which shoes is a relatively small component. Four brands, Massaschoen, Schoenenreus, Scapino, and Van Haren, form a competitive group of
-2 -1.5 -1 -0.5 0 0.5 1 -0.5 0 0.5 1 1.5 Bijenkorf Bristol Cinderella Coach Contessa Manfield Massaschoen Sacha Scapino Schoenenreus Shoos Tango V&D Van Arendonk Van Dalen Van Haren Van Woensel Invito Dolcis Fig. 1 Two-dimensional generalized canonical correlation analysis perceptual map of the group configuration for shoe
low-priced shoe stores with national coverage and relatively large outlets. Another example is the close positioning of Manfield and Cinderella, both more expensive, brand-oriented shoe stores. Thus our proposed method results in an interpretable, insightful perceptual map of a large set of shoe stores.
6 Discussion
We have proposed and tested a new multiattribute perceptual mapping procedure based on idiosyncratic sets of brands and attributes that are elicited from respondents, rather than being predetermined by a researcher. The flexibility, ease of use, and validity of our procedure is generally better than those of existing procedures with fixed sets of brands and/or attributes.
To test our approach, we compared its perceptual maps with those obtained from previously suggested data-collection procedures. In line with extant literature (Hauser and Koppelman1979; Huber and Holbrook1979; Steenkamp and Van Trijp1996), we find relatively minor differences among the alternative perceptual mapping approaches using the same brand sets. In general, this outcome represents a positive finding because perceptual mapping methods consistently perform very well in terms of convergent validity. If a certain market has a fairly stable or strong relative positioning of brands, various methods tend to reveal the same underlying structure. However, whether the brand set is fixed or selected by the individual respondent does affect the perceptual maps obtained considerably. In addition, an important difference and advantage of our procedure over existing methods is its capability to produce a perceptual map with a large number of brands. With modern levels of market fragmen-tation, different consumers often use different attributes to evaluate different brands. Hence, proper selection of the brands and attributes, wording of the questions, and selection of the respondents are essential when using fixed brand and attribute sets. The adaptiveness of the brand and attribute sets is, therefore, a key benefit of our approach. 6.1 Potential applications
In modern times, various situations involve idiosyncratic sets, as subsets of a huge, already complete set. For example, Ho et al. (2010) consider movie ratings obtained from Internet sources. In such data, evaluators typically observe a subset of movies, and attributes (e.g., director, actors) may be movie and/or genre specific. Instead of selecting an evaluator by movie sample, such that everyone observes all movies, our procedure allows for the processing of idiosyncratic data. Similarly, in online stores, the number of items to be evaluated can be huge, so our procedure should be valuable in such settings. The perceptual mapping approach with idiosyncratic brand and attribute sets fits with a stream of research that adapts judgment tasks to individual respondents, for example in choice-based conjoint analysis studies (Eggers and Sattler2009; Toubia et al.2007). Lowering the respondent’s burden is necessary to motivate people to participate in research projects. Judgment tasks that fit their specific situation should help increase perceived relevancy and enjoyment and thus their willingness to invest time and effort. Instead of adapting the judgment task to the respondent, the researcher could retain the task with fixed sets, but allow a respondent to skip judgments or allow for“no
opinion” ratings for unfamiliar brands or irrelevant attributes. The resulting data matrix will contain missing values. One could accommodate for such missing values by removing rows entirely if one observation is missing, and applying the method-ology described in this paper. Alternatively, Green and Douglas Carroll (1988) and Van de Velden and Takane (2011) proposed alternative methods involving data imputation in such settings.
Most markets also have become international in nature, so marketing research tends to study and compare multiple national or regional markets. Despite the general convergence of markets, not all of them contain identical sets of competitors. Therefore, any simultaneous study of multiple markets must account for differences in competitive settings. Our perceptual mapping procedure can accommodate such differences in a natural way and support the required simultaneous assessment of brand image across multiple national markets, even if these markets include varying brand sets.
6.2 Limitations and further research
A key disadvantage of compositional methods had been that the researcher must predetermine the sets. Our approach deals with this disadvantage, yet does so within the framework of compositional methods. Therefore, the perceptual maps reflect brands rated on specific attributes. Additional research should extend our comparison to include decompositional methods to assess their relative ease of use and the resulting maps.
Our approach is based on matrix algebra, not statistical modeling. Therefore, it requires no distributional assumptions. Consequently, this method does not yield test statistics and correspondingpvalues. The stability of perceptual maps, however, can be assessed using bootstrapping methods (e.g., Torres and Bijmolt 2009; Van de Velden et al.2011) and we recommend further research that develops a bootstrapping procedure to assess the stability of the entire perceptual map and each specific point. In our experimental and empirical studies, we have applied our perceptual map-ping procedure to various datasets. Although the procedure is very flexible in terms of the size and variability of the brand and attribute sets, further research should assess the application limits of this method, and of perceptual mapping in general. What happens if the set of brands common to almost all consumers is very small? What happens if the total set of brands is extremely large? Extended applications, such as those in international or online settings, depend on these and related issues.
Open Access This article is distributed under the terms of the Creative Commons Attribution License which permits any use, distribution, and reproduction in any medium, provided the original author(s) and the source are credited.
Appendix I
Crucial in the generalized canonical correlation analysis approach employed in this paper, are diagonal selection matricesKiwith elements
Kjji ¼ 1 if brandjis evaluated by subjecti;
0 else:
By addingMMi rows to each observed matrixXiand rearranging the rows to ensure they correspond to the same brands across the different data matrices, we obtainNmatrices,Xi of orderM Pi. Multiplying bothXi andYwithKiin advance reveals the observed rows for respondenti, such that zero-value rows correspond to unobserved brands.
Thus we can formulate the objective function of the generalized canonical corre-lation analysis with missing rows as:
min Ai;Y traceX N i¼1 KiYKiXiAi 0 KiYKiXiAi ; ð2Þ
with the constraints Y0KY¼NIQ and K¼
PN i¼1Ki. Let Y¼ ffiffiffiffi N p K12Y, so Y0Y¼IQ. A group configuration Y that minimizes Eq. 2 under the constraints
Y0KY¼NIQandK¼ PN i¼1Ki. LetY¼ ffiffiffiffi N p K12Y, soY0Y¼I Qcan be obtained
from the following eigenvalue equation: 1 NK 1 2 XN i¼1 KiXi X 0 iKiXi 1 Xi0Ki ! K12Y¼YΛ; ð3Þ w h e r e Λ i s a d i a g o n a l m a t r i x w i t h t h e Q l a r g e s t e i g e n v a l u e s o f 1 NK 1 2 P N i¼1 KiXi X 0 iKiXi 1 Xi0Ki
K12 as elements; the columns of Y are the
corresponding eigenvectors. Next, the matricesAican be calculated as
Ai¼ X 0
iKiXi
1
Xi0KiY: ð4Þ
By taking their inverse, we implicitly assume that the matrices Xi0KiXi are
nonsingular, which often is inaccurate. We do not impose an explicit restriction on each respondent, such as demanding that they specify more brands than attributes. Instead, we replace the inverse in Eq.4with the Moore–Penrose inverse which takes care of the dependencies between columns.
A complete derivation of these results appears in Van de Velden and Bijmolt (2006), who also confirm that this procedure compares favorably, in terms of fit and parameter recovery, to an alternative procedure called GENCOM (Green and Douglas Carroll1988).
Appendix II: Measurement of Evaluation Dimensions
Attribute relevance (α00.67)
– The attributes I used to evaluate the supermarkets are the most important attributes of supermarkets.
– The judgment task I just did included several unimportant attributes (r).
– I understand very well what is meant with the various attributes I used in the evaluations.
Brand knowledge (α00.70)
– The supermarkets that I just rated are the most relevant supermarkets to me.
– I know all supermarkets that I just evaluated.
– When making the evaluations, I had sufficient knowledge about the various supermarkets.
– I had problems rating some of the supermarkets, because I do not know them that well (r).
Judgment certainty (α00.77)
– I could make the evaluations with high certainty.
– I knew often precisely what score I should give.
– With many judgments, I had serious doubts what rating I should give (r). Task simplicity (α00.67)
– The judgment task was difficult (r).
– The judgment task was fatiguing (r).
– The judgment task was easy to do. Task attitude (α00.83)
– The judgment task was fun to do.
– Evaluating the supermarkets was a tedious task (r).
– The judgment task was boring (r). Notes: (r)0reverse coded.
References
Bech-Larsen, T., & Nielsen, N. A. (1999). A comparison of five elicitation techniques for
elicitation of attributes of low involvement products. Journal of Economic Psychology, 20(3),
315–341.
Bottomley, P. A., Doyle, J. R., & Green, R. H. (2000). Testing the reliability of weight elicitation methods:
direct rating versus point allocation.Journal of Marketing Research, 37, 508–513.
Breivik, E., & Supphellen, M. (2003). Elicitation of product attributes in an evaluation context: a
comparison of three elicitation techniques.Journal of Economic Psychology, 24(1), 77–98.
Carroll, J. D. (1968). Generalization of canonical correlation analysis to three or more sets of
variables. Proceedings of the 76th Annual Convention of the American Psychological Association, 3,
227–228.
Carroll, J. D., & Green, P. E. (1997). Psychometric methods in marketing research: part II,
multidimen-sional scaling.Journal of Marketing Research, 34(May), 193–204.
Cooper, L. G. (1983). A review of multidimensional scaling in marketing research.Applied Psychological
Measurement, 7(Fall), 427–450.
Cornelius, B., Wagner, U., & Natter, M. (2010). Managerial applicability of graphical formats to support
product positioning decisions.Journal für Betriebswirtschaft, 60(3), 167–201.
Day, G. S., Shocker, A. D., & Srivastava, R. K. (1979). Customer-oriented approaches to identifying
product-markets.Journal of Marketing, 43(Fall), 8–19.
Dillon, W. R., Frederick, D. G., & Tangpanichdee, V. (1985). Decision issues in building perceptual
product spaces with multi-attribute rating data.Journal of Consumer Research, 12, 47–63.
Dillon, W. R., Madden, T. J., Kirmani, A., & Mukherjee, S. (2001). Understanding what’s in a brand rating:
a model for assessing brand and attribute effect and their relationship to brand equity. Journal of
Eggers, F., & Sattler, H. (2009). Hybrid individualized two-level choice-based conjoint (HIT-CBC): a new
method for measuring preference structures with many attribute levels. International Journal of
Research in Marketing, 26(2), 108–118.
Gleason, T. C. (1976). On redundancy in canonical analysis.Psychological Bulletin, 83(6), 1004–1006.
Green, P. E., & Douglas Carroll, J. (1988). A simple procedure for finding a composite of
several multidimensional scaling solutions. Journal of the Academy of Marketing Science, 16(1),
25–35.
Greenleaf, E. A. (1992). Improving rating scale measures by detecting and correcting bias components in
some response styles.Journal of Marketing Research, 29(May), 176–188.
Hauser, J. R., & Koppelman, F. S. (1979). Alternative perceptual mapping techniques: relative accuracy and
usefulness.Journal of Marketing Research, 16, 495–506.
Ho, Y., Chung, Y., & Lau, Kin-nam. (2010). Unfolding of large-scale marketing data.International Journal
of Research in Marketing, 27(2), 119–132.
Holbrook, M. B., & Moore, W. L. (1982). Using canonical correlation to construct product spaces for
objects with known feature structures.Journal of Marketing Research, 19, 87–98.
Huber, J., & Holbrook, M. B. (1979). Using attribute ratings for product positioning: some distinctions
among compositional approaches.Journal of Marketing Research, 16, 507–516.
Johnson, M. D., & Hudson, E. J. (1996). On the perceived usefulness of scaling techniques in market
analysis.Psychology & Marketing, 13(7), 653–675.
Kardes, F. R., Prosavac, S. S., & Cronley, M. L. (2004). Consumer inference: a review of processes, bases,
and judgment contexts.Journal of Consumer Psychology, 14(3), 230–256.
Kaul, A., & Rao, V. R. (1995). Research for product positioning and design decisions: an integrative
review.International Journal of Research in Marketing, 12, 293–320.
Lancaster, K. (1971).Consumer demand: a new approach. New York: Columbia University Press.
Lynch, J. G., Chakravarti, D., & Mitra, A. (1991). Contrast effects in consumer judgments: changes in
mental representation or in the anchoring of rating scales.Journal of Consumer Research, 18(December),
284–297.
Lorenzo-Seva, U., & ten Berge, J. M. F. (2006). Tucker’s congruence coefficient as a meaningful index of
factor similarity.European Journal of Research Methods for the Behavioral and Social Sciences, 2,
57–64.
Mason, K., Jensen, T., Burton, S., & Roach, D. (2001). The accuracy of brand and attribute judgments: the
role of information relevancy, product experience, and attribute-relationship schemata.Journal of the
Academy of Marketing Science, 29(3), 307–317.
Muthukrishnan, A. V., & Kardes, F. R. (2001). Persistent preferences for product attributes: the effects of
the initial choice context and uninformative experience.Journal of Consumer Research, 28(June), 89–
104.
Sanbonmatsu, D. M., Kardes, F. R., & Herr, P. M. (1992). The role of prior knowledge and missing
information in multiattribute evaluation.Organizational Behavior and Human Decision Processes, 51,
76–91.
Shocker, A. D., & Srinivasan, V. (1979). Multiattribute approaches for product concept evaluation and
generation: a critical review.Journal of Marketing Research, 16(May), 159–180.
Srivastava, R. K., Alpert, M. I., & Shocker, A. D. (1984). A customer-oriented approach for determining
market structure.Journal of Marketing, 48, 32–35.
Steenkamp, Jan-Benedict E. M., & Van Trijp, H. C. M. (1996). Task experience and validity in perceptual
mapping: a comparison of two consumer-adaptive techniques.International Journal of Research in
Marketing, 13, 265–276.
Steenkamp, Jan-Benedict E. M., & Van Trijp, H. C. M. (1997). Attribute elicitation in marketing research:
an comparison of three procedures.Marketing Letters, 8(2), 153–165.
Steenkamp, Jan-Benedict E. M., Van Trijp, H. C. M., & ten Berge, J. M. F. (1994). Perceptual mapping
based on idiosyncratic sets of attributes.Journal of Marketing Research, 31, 15–17.
Torres, A., & Bijmolt, T. H. A. (2009). Assessing brand image through communalities and asymmetries in
brand-to-attribute and attribute-to-brand associations.European Journal of Operational Research, 195,
628–640.
Toubia, O., Hauser, J. R., & Garcia, R. (2007). Probabilistic polyhedral methods for adaptive choice-based
conjoint analysis: theory and application.Marketing Science, 26(5), 596–610.
Van der Burg, E. (1988).Nonlinear canonical correlation and some related techniques. Leiden: DSWO
Press.
Van der Burg, E., de Leeuw, J., & Dijksterhuis, G. (1994). OVERALS: nonlinear canonical correlation with
Van de Velden, M., & Bijmolt, T. H. A. (2006). Generalized canonical correlation analysis of matrices with
missing rows: a simulation study.Psychometrika, 71(2), 323–331.
Van de Velden, M., De Beuckelaer, A., Groenen, P. J. F., & Busing, F. M. T. A. (2011). Nonmetric Unfolding of Marketing Data, Working Paper.
Van de Velden, M., & Takane, Y. (2011). Generalized canonical correlation analysis with missing values. Computational Statistics. doi:10.1007/s00180-011-0276-y.
Ittersum, V., Koert, J. M. E., Pennings, B. W., & van Trijp, H. C. M. (2007). The validity of
attribute-importance measurement: a review.Journal of Business Research, 60, 1177–1190.
Van Kleef, E., van Trijp, H. C. M., & Luning, P. (2004). Consumer research in the early stages of new
product development: a critical review of methods and techniques.Food Quality and Preference, 16