Archived at the Flinders Academic Commons:
http://dspace.flinders.edu.au/dspace/
This is the published version of this article.
The original is available at:
http://www.molvis.org/molvis/v19/501
Please cite this as: Tea, M., Michael, M.Z., Brereton, H.M.
and Williams, K.A., 2013. Stability of small non-coding RNA
reference gene expression in the rat retina during exposure
to cyclic hyperoxia. Molecular Vision, 19, 501-508.
DOI:
http://dx.doi.org/10.1136/bmjopen-2012-002195
© 2013 Molecular Vision. The authors retain copyright and
grant Molecular Vision an irrevocable, royalty-free,
perpetual license to publish and distribute the article.
This article is an open access article distributed under the
terms of the Creative Commons
Attribution-NonCommercial-NoDerivatives License 3.0, which permits
use, distribution, and reproduction in any medium,
provided the original work is properly cited, the use is non
commercial and is otherwise in compliance with the license.
Normalization of reverse transcription (RT)-qPCR data using stably expressed reference genes is essential for accu-rately profiling gene and microRNA (miRNA) expression [1-4]. Genes that are constitutively expressed and are associ-ated with housekeeping or structural functions are commonly used as reference genes, as they tend to be expressed across many cell and tissue types and show minimal variation among samples or experimental conditions [4-7]. However, evidence suggests that the expression of commonly used reference genes such as glyceraldehyde 3-phosphate dehydrogenase (GAPDH) and beta-actin varies between cell and tissue types [8,9]. Identifying and characterizing stably expressed reference genes through a series of preliminary experiments is recommended, to accurately determine gene and miRNA expression levels and to avoid incorrect conclusions being drawn [3,6,10,11].
Retinopathy of prematurity (ROP) is a potentially blinding condition that affects premature infants who undergo supplemental inspired oxygen therapy. Oxygen-induced retinopathy (OIR) is a robust animal model of ROP that mimics the pathology seen in human disease [12,13]. The rat model of OIR described in this study utilizes exposure of neonatal rats to cyclic hyperoxia and relative hypoxia [14-17]. As changes in retinal gene expression in response to exposure of neonates to hyperoxia and relative hypoxia are involved in inducing OIR [18-21], identifying references genes that are stable with variations in oxygen levels is vital. Previous studies from our laboratory identified two RNA reference genes encoding acidic ribosomal phosphoprotein and hypo-xanthine guanine phosphoribosyl transferase as being stably expressed in response to cyclic hyperoxia and during early retinal development in several different rat strains [5], making these reference genes suitable for normalizing gene expres-sion data.
MicroRNAs expressed in the eye are associated with physiologic and pathological processes and display tissue specificity and spatiotemporal expression [22,23]. In mouse Received 7 May 2012 | Accepted 21 February 2013 | Published 25 February 2013
Stability of small non-coding RNA reference gene expression in
the rat retina during exposure to cyclic hyperoxia
Melinda Tea,1 Michael Zenon Michael,2 Helen Mary Brereton,1 Keryn Anne Williams1
1Department of Ophthalmology, Flinders University of South Australia, Adelaide, Australia; 2Department of Gastroenterology and Hepatology, Flinders University of South Australia, Adelaide, Australia
Purpose: Oxygen-induced retinopathy (OIR) is a robust animal model of human retinopathy of prematurity that readily
allows changes in retinal gene and microRNA (miRNA) expression in response to fluctuations in oxygen levels to be
studied. We sought to identify small non-coding RNA (ncRNA) genes that showed stable expression upon exposure to varying levels of oxygen, with different developmental stages and in different rat strains, to act as reference genes for normalizing miRNA expression in a rat model of OIR.
Methods: Expression of five small ncRNAs (U6 snRNA, miR-16, U87, 4.5S RNA (H) “Variant 1”, and 5S ribosomal
RNA [rRNA]) were tested on a standard RNA pool and representative retinal samples from P5, P6, P9, and P14 from room air– and cyclic hyperoxia–exposed rats using reverse transcription (RT)-qPCR, to assess the effect of developmental
stage and exposure to fluctuations in oxygen levels, respectively. Two strains of inbred albino rats, Fischer 344 (F344, resistant to OIR) and Sprague-Dawley rats (SD, susceptible to OIR), were used to assess the effect of rat strain on the
stability of the small ncRNAs.
Results: In this rat model of OIR, 5S rRNA expression was variable with strain, fluctuations in oxygen levels, and de
-velopmental stage. U6 snRNA was stably expressed with changes in oxygen levels, and minimal variation was observed
with strain and developmental stage. MiR-16 showed less stable expression with changes in oxygen levels and between
strains compared to U6 snRNA. Some variation in expression in response to developmental stage was also observed. The PCR amplification efficiencies of the U6 snRNA and miR-16 TaqMan assays were 56% and 78%, respectively. U87 and 4.5S RNA (H) “Variant 1” expression varied with strain, exposure to cyclic hyperoxia, and in particular developmental
stage, and was at low levels in the neonatal rat retina.
Conclusions: We conclude that U6 snRNA and miR-16 are the most suitable reference RNAs for normalizing miRNA
expression, as they are relatively stable with strain, exposure to cyclic hyperoxia, and developmental stage in a rat model of OIR.
Correspondence to: Keryn Williams, Department of Ophthalmology
at Flinders University, Flinders Medical Centre, Bedford Park, SA
5042, Australia; Phone: +618 8204 5047; FAX: +618 8277 0899; email: [email protected].
Molecular Vision 2013; 19:501-508 <http://www.molvis.org/molvis/v19/501> © 2013 Molecular Vision models of OIR, miRNAs regulate retinal angiogenesis by
post-transcriptional modification of genes involved in the angiogenic response to hypoxia [24,25].
5S ribosomal RNA (rRNA), a commonly used reference transcript for miRNA RT-qPCR, has been used to normalize miRNA expression in mouse models of OIR [24-26]. Unlike the reference genes used in normalizing gene expression that are typically protein-coding genes, the reference genes used for normalizing miRNA expression should, in general, be small non-coding RNAs (ncRNAs) such as small nuclear and small nucleolar RNAs, given that the total RNA isolation process biases toward the recovery of large RNAs over small ncRNAs [4,27]. However, the choice of the correct normaliza-tion RNA appears to depend on the context in which miRNA expression is being investigated [10,28]. Whether 5S rRNA is the most appropriate small ncRNA for normalizing miRNA expression in rodent models of OIR is currently unknown, as stable expression of 5S rRNA with changes in oxygen levels has not previously been established. We sought to identify small ncRNAs that showed stable expression upon exposure to varying levels of oxygen, in different rat strains and at different developmental stages to act as reference genes for normalizing miRNA expression in a rat model of OIR.
METHODS
Experimental animals: Albino inbred Fischer 344 (F344; resistant to OIR) and Sprague-Dawley (SD; susceptible to OIR) rats and pigmented inbred Dark Agouti (DA; suscep-tible to OIR) rats were obtained from the institutional animal facility. Rats were allowed unlimited access to rat chow and water and were exposed to a 12 h:12 h light-dark cycle. Temperature was maintained at 24 °C in a humidified atmo-sphere. Animals were euthanized with an inhaled overdose of isoflurane anesthetic. All experiments were approved by the institutional Animal Welfare Committee and met the standards described in the Association for Research in Vision and Ophthalmology Statement for the Use of Animals in Ophthalmic and Vision Research and those set out by the Australian Code of Practice for the Care and Use of Animals for Scientific Purposes.
Exposure of neonatal rats to cyclic hyperoxia: The oxygen exposure protocol used in this study was a modification of those previously used in other studies of OIR in the rat [15-17,29,30]. Within 12 h of birth, female rats and their litters were placed in a custom-built humidified chamber designed to deliver oxygen to neonatal rat litters under controlled conditions. Rats were exposed to alternating 24 h cycles of hyperoxia (80% oxygen in air) and room air (normoxia; 21%
oxygen in air) for a maximum of 14 days after birth. Age- and strain-matched room air–exposed rats were used as controls. Preparation of total RNA from rat retinas: Total RNA was prepared from the retinas of neonatal rats as described previ-ously [31], using TRIzol (Invitrogen, Carlsbad, CA) according to the manufacturer’s method. Total RNA was also prepared from the rat liver, brain and lung, and mouse lens and liver using the same method. Mouse liver and lens tissue were kindly provided by Dr. Shiwani Sharma (Flinders University, Adelaide, South Australia). Quantification of total RNA was performed using the NanoDrop 8000 (Thermo Scientific, Wilmington, DE). An absorbance ratio of the RNA at 260 and 280 nm was used as a guide to determine RNA purity. Total RNA with a ratio of 1.8 or more was considered accept-able. Agarose gel electrophoresis was used to assess RNA integrity and residual DNA contamination. Total RNA with a 28S:18S ratio of approximately 2:1 and showing minimal DNA contamination was considered acceptable for use. Preparation of cDNA for qPCR: cDNA was prepared from total RNA for each individual sample from room air- and cyclic hyperoxia-exposed F344 and SD rats at P5, P6, P9, and P14 using a method described previously [31]. Briefly, one microgram of total RNA was DNase-treated with Turbo DNAfree (Ambion, Austin, TX) according to the manufac-turer’s instructions and reverse-transcribed in 20 μl reac -tions using a first-strand cDNA synthesis kit (SuperScript III First-Strand Synthesis System, Invitrogen) and random hexamer primers. An RT-free control sample was prepared in parallel with each cDNA sample, in which diethylpyro-carbonate (DEPC)-treated water was used in place of reverse transcriptase. Relative quantification of gene expression was performed on cDNA from each individual sample at a 1:5 dilution. A single representative room air– or cyclic hyper-oxia–exposed rat was used at each time point for each strain of interest.
cDNA was also prepared from a standard RNA sample made from retinal RNA pooled from several room air– and cyclic hyperoxia–exposed albino F344 and SD rats and pigmented DA rats from various developmental stages, ranging from P2 to P14. Each sample was represented equally in terms of RNA yield. The standard pool was prepared to allow for normalizing RT-qPCR data for gene and small ncRNA expression in the context of OIR. The standard pool was prepared to allow all strains, treatment groups, and developmental stages to be covered, as well as providing sufficient RNA for normalization across multiple experi-ments to be performed.
RT-qPCR analysis of 5S RNA expression: RT-qPCR was performed with reference to the Minimum Information for
Publication of Quantitative Real-Time PCR Experiments guidelines [32]. Each 10 μl reaction mixture contained 5 μl of Power SYBR Green PCR Master Mix (Applied Biosys -tems, Foster City, CA), 1 μl each forward and reverse primers (0.5 μM final concentration), and 3 μl cDNA sample diluted 1:5 with Ultrapure water (Fisher Biotech, WA, Australia). Reactions were run on a StepOne Plus real-time PCR System (Applied Biosystems). The cycling conditions were initial denaturation (95 °C, 15 min) followed by 40 cycles of dena-turation (95 °C, 15 s), annealing, and extension (60 °C, 30 s). Primers specific for rat 5S rRNA were published previ -ously [33]. The sequences for each primer were as follows: The forward primer was 5′-TCT CGT CTG ATC TCG GAA GC-3′, and the reverse primer was 5′-AGC CTA CAG CAC CCG GTA TT-3′. Primers were synthesized by Geneworks Ltd (Thebarton, South Australia, Australia).
Assays for RT-qPCR analysis of miRNA expression: TaqMan miRNA assays (Applied Biosystems) were used to deter -mine miRNA expression levels in the retinal, liver, brain, lung, and lens samples. Eight commercially available small ncRNA controls, referred to as “endogenous controls” by Applied Biosystems, were chosen for analysis. In addition to these endogenous controls, four miRNAs considered stably expressed with strain and treatment were included. They were manually identified from data derived from Exiqon miRNA arrays (Exiqon A/S, Vedbaek, Denmark) performed at the Adelaide Microarray Centre (Adelaide, Australia) using Exiqon miRNA version 8.1 and version 11 all species array libraries. Briefly, microarray libraries were printed onto slides. Retinal-derived total RNA were labelled, hybrid-ized and scanned according to the manufacturer’s protocol. Preliminary Exiqon microarray data analyses were performed at the Adelaide Microarray Centre using the software package LIMMA R (WEHI, Melbourne, VIC, Australia) to identify differentially expressed miRNAs. The full micro-array processing protocol and statistical analyses has been described elsewhere [34]. The arrays were used to identify miRNAs that were differentially expressed as a result of rat strain and/or changes to oxygen levels. Thirteen ncRNAs (including 5S rRNA) were tested before RT-qPCR quanti -fication of miRNA expression. The corresponding Applied Biosystems TaqMan miRNA assay reference numbers are shown in Table 1. Primer amplification efficiencies for each small ncRNA were determined using the standard RNA sample.
RT-qPCR analysis of miRNA expression: cDNA synthesis and qPCR reactions were performed using a StepOne Plus real-time PCR System (Applied Biosystems). Conversion of total RNA to single-stranded cDNA was performed in accordance
with the manufacturer’s instructions for the TaqMan miRNA assays with slight modifications as detailed. Briefly, total RNA samples were diluted to a concentration of 4, 20, or 40 ng/μl depending on the optimized template concentration determined for each miRNA of interest. A total of 5–40 ng of RNA was used in each reverse transcription reaction.
The reverse transcription reaction was modified to 7.5 μl rather than 15 μl reactions and the volumes adjusted accordingly. A bulk reverse transcription master mix was prepared containing 100 mM deoxynucleotide triphosphates (with deoxythymidine triphosphate, 0.075 μl/reaction), Multi -scribe™ Reverse Transcriptase 50 U/μl (0.5 μl/reaction), 10 x Reverse Transcriptase Buffer (0.75 μl/reaction), RNase Inhibitor 20 U/μl (0.095 μl/reaction) and nuclease-free water (2.08 μl/reactions). The reverse transcription master mix (3.5 μl/reaction) was then aliquoted into a 96 well reaction plate with 0.1 ml well volume (Applied Biosystems) and miRNA-specific RT primer (1.5 μl/reaction) added. The diluted total RNA (2.5 μl/reaction) was then added to bring the final volume to 7.5 μl.
The reactions were incubated for 30 min at 16 °C and then followed by 30 min of incubation at 42 °C. The reaction was then terminated at 85 °C for 5 min before being held at 4 °C until required for qPCR that was performed on the same day.
A PCR master mix was prepared for each reference small ncRNA gene. Each 10.3 μl reaction contained 0.5 μl 20X TaqMan miRNA assay mix, 5 μl TaqMan 2X Fast Universal PCR Master Mix No Amperase UNG, 3.8 μl of nuclease-free water, and 1 μl of the reverse transcription product. Each reaction was performed in triplicate. Nuclease-free water was used in place of the reverse transcription template as a nega-tive control for non-specific amplification. PCR reactions were placed in the StepOne Plus cycler, and the AmpliTaq DNA polymerase was activated at 95 °C for 20 s, followed by 40 cycles of denaturing at 95 °C for 1 s, and then annealing and extension at 60 °C for 20 s. Again, a single representative room air– or cyclic hyperoxia–exposed rat was used at each time point for each strain of interest.
Determination of PCR primer amplification efficiencies: PCR primer amplification efficiencies were determined for the 5S rRNA primer pair using ten threefold serial dilutions of the standard cDNA sample derived from rat retinal tissue to generate a standard curve. Dilutions were made over five orders of magnitude; however, reliable data were generated only to four logs. For miRNA primer pairs, nine fourfold serial dilutions of the standard RNA sample from rat retinal tissue were used to generate the standard curve. Depending on the miRNA primer pair, reliable data were generated to a
Molecular Vision 2013; 19:501-508 <http://www.molvis.org/molvis/v19/501> © 2013 Molecular Vision
minimum of two logs and a maximum of four logs. Although data from the standard curve would ideally extend to five orders of magnitude to determine PCR amplification effi-ciency accurately, the abundance of each mRNA or miRNA in the sample of interest was a limiting factor.
Standard curves for five small ncRNA primer pairs were also performed on total RNA derived from rat liver samples to determine if poor amplification efficiencies were due to the tissue-specificity of the ncRNA in question. In these instances, six twofold serial dilutions of the standard RNA sample were used to generate the standard curve over two orders of magnitude. A smaller dilution factor was used for the miRNA primer pairs to ensure that the majority of the threshold cycle values fell within the range of 20–30.
For all primer pairs, the mean threshold cycle value for each dilution was plotted against the log cDNA concentra-tion, and the gradient of the regression line of the standard curve was used to calculate the PCR amplification efficiency. Amplification efficiencies were used in quantifying gene and miRNA expression in the context of OIR [35,36].
Statistics: All statistical analyses were performed using the software package PASW Statistics version 18.0 (SPSS Inc., Chicago, IL). Independent-samples Student t tests or Mann–Whitney U tests were performed to compare stability of the small ncRNAs between strains or cyclic hyperoxia
exposure, and the significance level (alpha) was set at 0.05. Statistical analysis for small ncRNA expression in response to development was performed using one-way between-groups analysis of variance (ANOVA), with the significance (alpha) level adjusted for multiple comparisons (Tukey’s honestly significant difference test) to p<0.0125. Where appropriate, a Kruskal–Wallis test with the significance (alpha) level set at 0.05 was used instead.
RESULTS
Eight small ncRNA endogenous controls available from Applied Biosystems, four miRNAs manually identified from in-house Exiqon microarray data to be stably expressed with strain and exposure to cyclic hyperoxia, and the small ncRNA 5S rRNA were tested using RT-qPCR. Primer PCR amplification efficiencies from total RNA derived from rat retinal samples were determined using the standard RNA sample (Table 1). The linearity of the primer pairs exhibited R2 values ranging from 0.98 to 1.00 over a minimum of two
orders of magnitude. Amplification efficiencies were unable to be determined for some assays including 4.5S RNA (H) “Variant 5,” snoRNA202, snoRNA, and Y1. These small ncRNAs may not be highly expressed in the neonatal rat retina; therefore, expression was examined in the rat liver (Table 2) and the mouse lens and liver (data not shown). In
Table 1. SmallncRna SuiTabiliTyaSRefeRencegeneSfoRnoRmalizaTionofmiRna expReSSioninRaTReTinalSampleS.
Small ncRNA Species reactivity Assay ID ciency in rat retinaAmplification effi- magnitudeOrder of R2 value Mean Ct
4.5S RNA(H)* “Variant 1” Rat 001716 49.3% 2.4 1.00 24.1
4.5S RNA(H)* “Variant 5” Rat 001717 ND – low abundance ND ND ND
snoRNA202* Mouse 001232 ND – low abundance ND ND ND
snoRNA* Rat 001718 ND – low abundance ND ND ND
U6 snRNA* Human, mouse and rat 001973 56.2% 4.2 1.00 20.9
RNU6B* Human 001093 ND – low abundance ND ND ND
Y1* Rat 001727 ND – low abundance ND ND ND
U87* Rat 001712 62.0% 2.4 0.98 23.8
5S rRNA Rat N/A 92.5% 4.0 0.98 23.0
hsa-miR-16 + Human, mouse and rat 000391 77.5% 4.2 0.98 24.2
mmu-miR-379+ Human, mouse and rat 001138 ND – low abundance ND ND ND
hsa-miR-191+ Human, mouse and rat 002299 ND – low abundance ND ND ND
hsa-let-7d+ Human, mouse and rat 002283 ND – low abundance ND ND ND
Thirteen small ncRNAs were tested for miRNA normalization. Applied Biosystems assay ID numbers are provided for all small ncRNAs other than 5S rRNA, which was not available as an Applied Biosystems TaqMan assay. PCR primer amplification efficiencies were deter -mined using serial dilutions of the standard RNA pool to a minimum of 2 orders of magnitude to generate a standard curve. The order of magnitude of the standard curve dilution series, the R2 value for each standard curve and the mean Ct across all test samples, including the
standard pool is shown. N/A=not available; ND=not able to be determined; *=small ncRNA assays referred to as endogenous controls by Applied Biosystems; +=miRNA identified from in-house Exiqon microarrays as being stably expressed with strain and oxygen exposure.
rat liver, 4.5S RNA (H) “Variant 1” was expressed, however 4.5S RNA (H) “Variant 5” was not highly expressed and the PCR amplification efficiency could not be determined. Interestingly, the same expression pattern was observed in the rat brain and lung (data not shown), suggesting that the 4.5S RNA (H) variants are not expressed to the same extent in different rat tissues. Y1 expression levels were low in the rat retina and liver. No cross-reactivity of the mouse-specific snoRNA202 assay was observed in the rat retina or liver; however, expression was confirmed in the mouse lens and liver (data not shown).
U6 snRNA, miR-16, U87, 4.5S RNA (H) “Variant 1”, and 5S rRNA were chosen for further analysis, as the expression levels of these small ncRNAs were adequate for determining primer PCR amplification efficiencies. The small ncRNAs’ stability with strain, treatment, and developmental stage was tested using representative samples from individual rats from P5, P6, P9, and P14, relative to the standard pool.
Effect of strain: The expression of each small ncRNA was separated based on the rat strain. The small ncRNA reference gene commonly used for normalizing miRNA expression in OIR, 5S rRNA, was the least stable of the five tested (Table 3). Analysis of the average expression level of each small ncRNA, relative to the standard pool, confirmed that little
variation was present in U6 snRNA, miR-16, U87, and 4.5S RNA (H) “Variant 1” expression. However, the changes in expression among strains were not statistically significant for any gene.
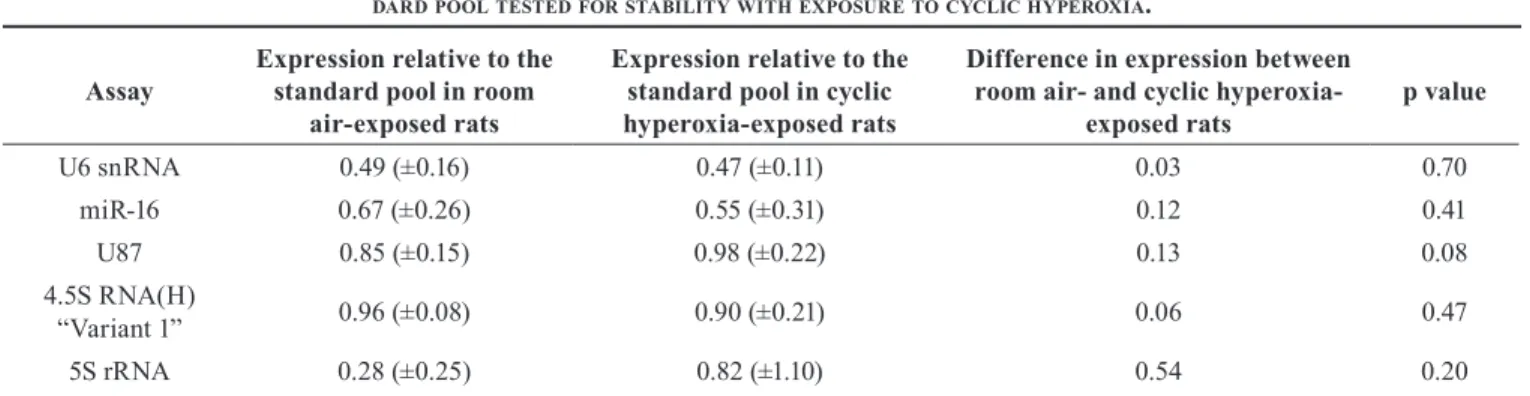
Effect of exposure to cyclic hyperoxia: Expression of each small ncRNA separated based on room air or cyclic hyperoxia exposure showed 5S rRNA was the least stable reference tran -script; however, this was not statistically significant (Table 4). Expression of U87, miR-16, and 4.5S RNA (H) “Variant 1” was somewhat variable with exposure to cyclic hyperoxia, although not to the same extent as for 5S rRNA. U6 snRNA showed the smallest change in average expression with fluc-tuations in oxygen levels. Overall, no changes in response to cyclic hyperoxia exposure were statistically significant. Effect of developmental stage: Levels of U6 snRNA and miR-16 showed slight increases with increasing develop-mental age; however, these differences were not statistically significant (Figure 1). U87 levels were stable between P5, P6, and P9; however, by P14, expression had increased to a statistically significant level after correction for multiple comparisons. Levels of 4.5S RNA (H) “Variant 1” varied with developmental stages. A statistically significant decrease in expression levels occurred between P6 and P9, and a statisti-cally significant increase in expression levels was observed
Table 2. pcR pRimeRamplificaTionefficiencieSofSmallncRna endogenouSconTRolSinRaTliveR.
Small ncRNA Amplification efficiency in rat liver R2 value Ct at 1/2 dilution
4.5S RNA(H) “Variant 1” 44.6% 0.99 25.4
4.5S RNA(H) “Variant 5” ND – low abundance ND 33.1
snoRNA202 ND – low abundance ND 33.0
snoRNA 50.4% 1.00 26.9
Y1 ND – low abundance ND 34.5
Five small ncRNA endogenous controls were tested to determine the PCR primer amplification efficiencies using total RNA derived from rat liver samples. Six serial twofold dilutions of the total RNA were used to generate the standard curves for 4.5S RNA (H) “Variant 1” and snoRNA. Cts were unable to be generated for all six twofold serial dilutions for the remaining small ncRNAs; therefore amplification efficiencies for these assays could not be determined. The R2 value for each standard curve is shown, as is the mean Ct at a 1/2 dilution.
ND=not able to be determined.
Table 3. expReSSionoffiveSmallncRnaSandmiRnaSRelaTiveToaSTandaRdpoolTeSTedfoRSTabiliTybeTweenRaTSTRainS.
Assay standard pool in F344 ratsExpression relative to the Expression relative to the standard pool in SD rats Difference in mean expression between F344 and SD rats p value
U6 snRNA 0.48 (±0.13) 0.45 (±0.13) 0.03 0.70 miR-16 0.66 (±0.33) 0.56 (±0.23) 0.10 0.50 U87 0.93 (±0.19) 0.90 (±0.21) 0.03 0.56 4.5S RNA(H) “Variant 1” 0.96 (±0.08) 0.90 (±0.21) 0.06 0.47 5S rRNA 0.63 (±1.13) 0.47 (±0.39) 0.16 0.53
Molecular Vision 2013; 19:501-508 <http://www.molvis.org/molvis/v19/501> © 2013 Molecular Vision
between P9 and P14. Levels of 5S rRNA, relative to the stan -dard pool, increased with developmental age up to P9 and then decreased at P14.
DISCUSSION
The current convention for quantifying miRNA expression is to use a single small ncRNA reference gene for normal-izing RT-qPCR data [37]. The choice of small ncRNA reference gene is important to avoid introducing bias or misleading conclusions. Gee et al. found that the expression of small ncRNA reference genes typically used for normal-izing miRNA expression levels in cancer were themselves highly variable [10]. When these reference genes were used to normalize expression levels of miRNAs of interest from tumor samples, the potential prognostic value of these miRNAs was lost, as their normalized expression levels
did not accurately reflect the associations between miRNA expression and tumor pathology or disease outcome [10]. These reference transcripts were later found to be derived from the introns of genes that themselves are dysregulated in cancer [10].
An ideal reference gene for use with rodent models of OIR is stable with strain, exposure to cyclic hyperoxia, and developmental stage. Previous studies of miRNA expression in mouse oxygen-induced retinopathy have used 5S rRNA as the reference RNA for normalizing miRNA expression [24-26], although the suitability of this reference gene for the purpose was hitherto unknown. Here, we showed that 5S rRNA levels varied with rat strain, changes in oxygen levels, and developmental stage, but this variability was not statisti-cally significant. Some of the variation observed in 5S rRNA expression may be due to the different chemistries used to
Table 4. expReSSionoffiveSmallncRnaSandmiRnaSRelaTiveToaSTan -daRdpoolTeSTedfoRSTabiliTywiThexpoSuReTocyclichypeRoxia.
Assay Expression relative to the standard pool in room air-exposed rats
Expression relative to the standard pool in cyclic hyperoxia-exposed rats
Difference in expression between room air- and cyclic
hyperoxia-exposed rats p value
U6 snRNA 0.49 (±0.16) 0.47 (±0.11) 0.03 0.70 miR-16 0.67 (±0.26) 0.55 (±0.31) 0.12 0.41 U87 0.85 (±0.15) 0.98 (±0.22) 0.13 0.08 4.5S RNA(H) “Variant 1” 0.96 (±0.08) 0.90 (±0.21) 0.06 0.47 5S rRNA 0.28 (±0.25) 0.82 (±1.10) 0.54 0.20 Mean expression relative to the standard pool and the standard deviation are shown for each treatment. Room air-exposed rats n=8, cyclic hyperoxia-exposed rats n=8.
Figure 1. Average expression of
five small ncRNAs and miRNAs
compared at P5, P6, P9, and P14. Mean expression relative to the standard pool for each develop-mental stage. n=4 at each time point. Error bars represent ±
stan-dard deviation. Statistical analysis
was performed using one-way
ANOVA, with the significance level (alpha) adjusted for multiple comparisons (Tukey’s HSD test) at p<0.0125. For 5S rRNA, a
Kruskal–Wallis test was used and
the significance (alpha) level set at 0.05. * p<0.0125.
assay 5S rRNA expression levels (SYBR Green) compared with miRNA expression levels (TaqMan). However, expres-sion of the 5S rRNA transcript was compared across samples within an assay method, rather than between methods, so that the variability is likely due to strain, oxygen exposure, or developmental stage. Previous studies of miRNA expression in mouse oxygen-induced retinopathy also used SYBR Green chemistry and TaqMan assays for analyzing 5S rRNA and miRNA expression levels, respectively [24,25]. Given that 5S rRNA expression levels varied between samples, we conclude that in at least this rat model of OIR, 5S rRNA is not a suitable reference RNA for normalizing miRNA expression levels.
U6 snRNA levels were stable with fluctuations in oxygen, strain, and developmental stage compared to the remaining four reference genes. However, the PCR amplification effi-ciency was only 56% for this particular assay. In comparison, miR-16 showed less stable average expression with changes in oxygen levels and between rat strains compared with U6 snRNA. Some variation in expression was observed with developmental stage, but less than that seen with 5S rRNA. The PCR amplification efficiency for the miR-16 TaqMan assay was better than for U6 snRNA, at 78%. The remaining two reference RNAs, 4.5S RNA (H) “Variant 1” and U87, showed poor PCR amplification efficiencies in neonatal rat retinas with efficiencies of 49% and 62%, respectively, and were variable with strain, exposure to cyclic hyperoxia, and developmental stage. Statistically significant changes in small ncRNA expression were observed in response to develop-mental stage for 4.5S RNA (H) “Variant 1” and U87.
5S rRNA has typically been used for normalizing miRNA expression levels in mouse models of oxygen-induced retinopathy, although the stability of this reference gene with changes in oxygen levels has not previously been examined. We have established that data derived from the use of 5S rRNA for normalization is statistically valid. However, the lower degree of variability observed in expression levels of U6 snRNA and miR-16 suggest they may be more appro -priate for use in normalizing miRNA expression levels. Taken together, the data suggest that from the limited number of rat-reactive small ncRNA control TaqMan assays available U6 snRNA and miR-16 are most suitable for normalizing miRNA expression in rat models of OIR, as these reference genes are relatively stable with strain, exposure to cyclic hyperoxia, and developmental stage.
ACKNOWLEDGMENTS
The work presented was supported by the National Health and Medical Research Council (NHMRC) of Australia and the Ophthalmic Research Institute of Australia (ORIA).
REFERENCES
1. Bustin SA. Quantification of mRNA using real-time reverse
transcription PCR (RT-PCR): trends and problems. J Mol Endocrinol 2002; 29:23-39. [PMID: 12200227].
2. Szabo A, Perou CM, Karaca M, Perreard L, Palais R, Quacken
-bush JF, Bernard PS. Statistical modeling for selecting house
-keeper genes. Genome Biol 2004; 5:R59-[PMID: 15287981]. 3. Vandesompele J, De Preter K, Pattyn F, Poppe B, Van Roy
N, De Paepe A, Speleman F. Accurate normalization of
real-time quantitative RT-PCR data by geometric averaging
of multiple internal control genes. Genome Biol 2002;
3:H0034.1-0034.11-[PMID: 12184808].
4. Galiveti CR, Rozhdestvensky TS, Brosius J, Lehrach H,
Konthur Z. Application of housekeeping npcRNAs for quantitative expression analysis of human transcriptome by real-time PCR. RNA 2010; 16:450-61. [PMID: 20040593]. 5. van Wijngaarden P, Brereton HM, Coster DJ, Williams KA.
Stability of housekeeping gene expression in the rat retina during exposure to cyclic hyperoxia. Mol Vis 2007;
13:1508-15. [PMID: 17893650].
6. Suzuki T, Higgins PJ, Crawford DR. Control selection for RNA quantitation. Biotechniques 2000; 29:332-7. [PMID: 10948434].
7. Radoníc A, Thulke S, Mackay IM, Landt O, Siegert W, Nitsche
A. Guideline to reference gene selection for quantitative
real-time PCR. Biochem Biophys Res Commun 2004;
313:856-62. [PMID: 14706621].
8. Zhong H, Simons JW. Direct comparison of GAPDH, beta-actin, cyclophilin, and 28S rRNA as internal standards for quantifying RNA levels under hypoxia. Biochem Biophys
Res Commun 1999; 259:523-6. [PMID: 10364451].
9. Kouadjo KE, Nishida Y, Cadrin-Girard JF, Yoshioka M, St-Amand J. Housekeeping and tissue-specific genes in mouse tissues. BMC Genomics 2007; 8:127-[PMID: 17519037].
10. Gee HE, Buffa FM, Camps C, Ramachandran A, Leek R, Taylor M, Patil M, Sheldon H, Betts G, Homer J, West
C, Ragoussis J, Harris AL. The small-nucleolar RNAs commonly used for microRNA normalisation correlate
with tumour pathology and prognosis. Br J Cancer 2011;
104:1168-77. [PMID: 21407217].
11. Latham GJ. Normalization of microRNA quantitative RT-PCR data in reduced scale experimental designs. Methods Mol
Biol 2010; 667:19-31. [PMID: 20827524].
12. Fleck BW, McIntosh N. Pathogenesis of retinopathy of prema -turity and possible preventive strategies. Early Hum Dev 2008; 84:83-8. [PMID: 18234458].
13. Ricci B. Oxygen-induced retinopathy in the rat model. Doc
Ophthalmol 1990; 74:171-7. [PMID: 2209374].
14. van Wijngaarden P, Coster DJ, Brereton HM, Gibbins IL, Williams KA. Strain-dependent differences in oxygen-induced retinopathy in the inbred rat. Invest Ophthalmol Vis Sci 2005; 46:1445-52. [PMID: 15790914].
Molecular Vision 2013; 19:501-508 <http://www.molvis.org/molvis/v19/501> © 2013 Molecular Vision
15. Penn JS, Tolman BL, Henry MM. Oxygen-induced retinopathy
in the rat: relationship of retinal nonperfusion to subsequent
neovascularization. Invest Ophthalmol Vis Sci 1994;
35:3429-35. [PMID: 8056518].
16. Reynaud X, Dorey CK. Extraretinal neovascularization induced by hypoxic episodes in the neonatal rat. Invest
Ophthalmol Vis Sci 1994; 35:3169-77. [PMID: 8045712]. 17. Penn JS, Tolman BL, Lowery LA. Variable oxygen expo
-sure causes preretinal neovascularization in the newborn
rat. Invest Ophthalmol Vis Sci 1993; 34:576-85. [PMID: 8449677].
18. Gao G, Li Y, Zhang D, Gee S, Crosson C, Ma J. Unbalanced expression of VEGF and PEDF in ischemia-induced retinal neovascularization. FEBS Lett 2001; 489:270-6. [PMID: 11165263].
19. van Wijngaarden P, Brereton HM, Gibbins IL, Coster DJ,
Williams KA. Kinetics of strain-dependent differential gene expression in oxygen-induced retinopathy in the rat. Exp Eye Res 2007; 85:508-17. [PMID: 17692314].
20. Gao G, Li Y, Fant J, Crosson CE, Becerra SP, Ma JX. Differ -ence in ischemic regulation of vascular endothelial growth factor and pigment epithelium–derived factor in brown norway and sprague dawley rats contributing to different susceptibilities to retinal neovascularization. Diabetes 2002; 51:1218-25. [PMID: 11916948].
21. Chan CK, Pham LN, Zhou J, Spee C, Ryan SJ, Hinton DR.
Differential expression of pro- and antiangiogenic factors in mouse strain-dependent hypoxia-induced retinal neovascu-larization. Lab Invest 2005; 85:721-33. [PMID: 15856049]. 22. Karali M, Peluso I, Marigo V, Banfi S. Identification and
characterization of microRNAs expressed in the mouse
eye. Invest Ophthalmol Vis Sci 2007; 48:509-15. [PMID: 17251443].
23. Ryan DG, Oliveira-Fernandes M, Lavker RM. MicroRNAs of the mammalian eye display distinct and overlapping tissue
specificity. Mol Vis 2006; 12:1175-84. [PMID: 17102797]. 24. Shen J, Yang X, Xie B, Chen Y, Swaim M, Hackett SF, Campo
-chiaro PA. MicroRNAs Regulate Ocular Neovascularization. Mol Ther 2008; 16:1208-16. [PMID: 18500251].
25. Bai Y, Bai X, Wang Z, Zhang X, Ruan C, Miao J.
MicroRNA-126 inhibits ischemia-induced retinal neovascu-larization via regulating angiogenic growth factors. Exp Mol Pathol 2011; 91:471-7. [PMID: 21586283].
26. Peltier HJ, Latham GJ. Normalization of microRNA expression levels in quantitative RT-PCR assays: identification of suit-able reference RNA targets in normal and cancerous human solid tissues. RNA 2008; 14:844-52. [PMID: 18375788].
27. Filipowicz W, Pogacic V. Biogenesis of small nucleolar ribonu
-cleoproteins. Curr Opin Cell Biol 2002; 14:319-27. [PMID: 12067654].
28. Mestdagh P, Van Vlierberghe P, De Weer A, Muth D, Wester
-mann F, Speleman F, Vandesompele J. A novel and universal
method for microRNA RT-qPCR data normalization.
Genome Biol 2009; 10:R64-[PMID: 19531210].
29. Ventresca MR, Gonder JR, Tanswell AK. Oxygen-induced
proliferative retinopathy in the newborn rat. Can J Ophthalmol 1990; 25:186-9. [PMID: 2354394].
30. Penn JS, Henry MM, Wall PT, Tolman BL. The range of PaO2
variation determines the severity of oxygen-induced
reti-nopathy in newborn rats. Invest Ophthalmol Vis Sci 1995;
36:2063-70. [PMID: 7657545].
31. Tea M, Fogarty R, Brereton HM, Michael MZ, Van der Hoek MB, Tsykin A, Coster DJ, Williams KA. Gene expression
microarray analysis of early oxygen-induced retinopathy
in the rat. J Ocul Biol Dis Infor. 2009; 2:190-201. [PMID: 20157446].
32. Bustin SA, Benes V, Garson JA, Hellemans J, Huggett J, Kubista M, Mueller R, Nolan T, Pfaffl MW, Shipley GL, Vandesompele J, Wittwer CT. The MIQE guidelines:
minimum information for publication of quantitative real-time PCR experiments. Clin Chem 2009; 55:611-22. [PMID: 19246619].
33. Uchida S, Hara K, Kobayashi A, Funato H, Hobara T, Otsuki K, Yamagata H, McEwen BS, Watanabe Y. Early life stress
enhances behavioral vulnerability to stress through the
acti-vation of REST4-mediated gene transcription in the medial
prefrontal cortex of rodents. J Neurosci 2010; 30:15007-18.
[PMID: 21068306].
34. Neal CS, Michael MZ, Rawlings LH, Van der Hoek MB, Gleadle JM. The VHL-dependent regulation of microRNAs in renal cancer. BMC Med 2010; 8:64-[PMID: 20964835]. 35. Meijerink J, Mandigers C, van de Locht L, Tonnissen E,
Goodsaid F, Raemaekers J. A novel method to compensate for different amplification efficiencies between patient DNA samples in quantitative real-time PCR. J Mol Diagn 2001; 3:55-61. [PMID: 11333300].
36. Simon P. Q-Gene: processing quantitative real-time RT-PCR data. Bioinformatics 2003; 19:1439-40. [PMID: 12874059]. 37. Roa W, Brunet B, Guo L, Amanie J, Fairchild A, Gabos Z,
Nijjar T, Scrimger R, Yee D, Xing J. Identification of a new
microRNA expression profile as a potential cancer screening tool. Clin Invest Med 2010; 33:E124-[PMID: 20370992].
Articles are provided courtesy of Emory University and the Zhongshan Ophthalmic Center, Sun Yat-sen University, P.R. China. The print version of this article was created on 25 February 2013. This reflects all typographical corrections and errata to the article through that date. Details of any changes may be found in the online version of the article.