A study on friction coef
fi
cient and wear coef
fi
cient of coated systems submitted to
micro-scale abrasion tests
Ronaldo Câmara Cozza
⁎
Centro Universitário da FEI–Fundação Educacional Inaciana“Padre Sabóia de Medeiros”, Departamento de Engenharia Mecânica, Av. Humberto de Alencar Castelo Branco, 3972, 09850-901, São Bernardo do Campo, SP, Brazil
CEETEPS–Centro Estadual de Educação Tecnológica“Paula Souza”, FATEC-Mauá, Av. Antônia Rosa Fioravante, 804, 09390-120, Mauá, SP, Brazil
a b s t r a c t
a r t i c l e i n f o
Available online 6 November 2012 Keywords:
Ball-cratering wear testing Thinfilms
Coatings Friction coefficient Wear coefficient
Several works on friction coefficient during abrasive wear tests are available in the literature, but only a few were dedicated to the friction coefficient in micro-abrasive wear tests conducted with rotating ball. This work aims to study the influence of titanium nitride (TiN) and titanium carbide (TiC) coating hardness on the friction coefficient and wear coefficient in ball-cratering micro-abrasive wear tests. A ball of AISI 52100 steel and two specimens of AISI D2 tool steel, one coated with TiN and another coated with TiC, were used in the experiments. The abrasive slurry was prepared with black silicon carbide (SiC) particles and distilled water. Two normal forces and six sliding distances were defined, and both normal and tangential forces were monitored constantly during all tests. The movement of the specimen in the direction parallel to the applied force was also constantly monitored with the help of an electronic linear ruler. This procedure allowed the calculation of crater geometry, and thus the wear coefficient for the different sliding distances without the need to stop the test. The friction coefficient was determined by the ratio between the tangential and the normal forces, and for both TiN and TiC coatings, the values remained, approximately, in the same range (fromμ= 0.4 toμ= 0.9). On the other hand, the wear coefficient decreased with the increase in coating hardness.
© 2012 Elsevier B.V. All rights reserved.
1. Introduction
Recently, the micro-scale abrasive wear test has gained large accep-tance in universities and research centers, being widely used in studies on the abrasive wear of materials.Fig. 1a[1]presents a schematic diagram of the principle of this abrasive wear test, where a rotating ball is forced against the tested specimen, in the presence of an abrasive slurry. There are two main equipment configurations to conduct this type of test:“free-ball”and “fixed-ball”. Fig. 1b[2,3] and1c[1,3,4]
shows examples of these equipments.
The aim of the micro-abrasive wear test is to generate“wear craters”
on the specimen.Fig. 2presents images of such craters when generated in coated systems, together with an indication of the total wear volume (V), the total crater depth (h), the coating thickness (hc), the internal crater diameter (a)[5]and the external crater diameter (b)[5].
The internal and external diameters of the wear crater are commonly measured by optical microscopy, but other methods are available. For example, Computer Aided Design (CAD) software[1,3]has been used for this purpose. The total wear volume and the total crater depth may be determined as a function of b, using Eqs. (1) [6] and (2) [7],
respectively, whereRis the radius of the ball. These equations are also valid for non-coated systems.
V≅πb 4 64R forb≪R ð1Þ h≅b 2 8R forb≪R ð2Þ
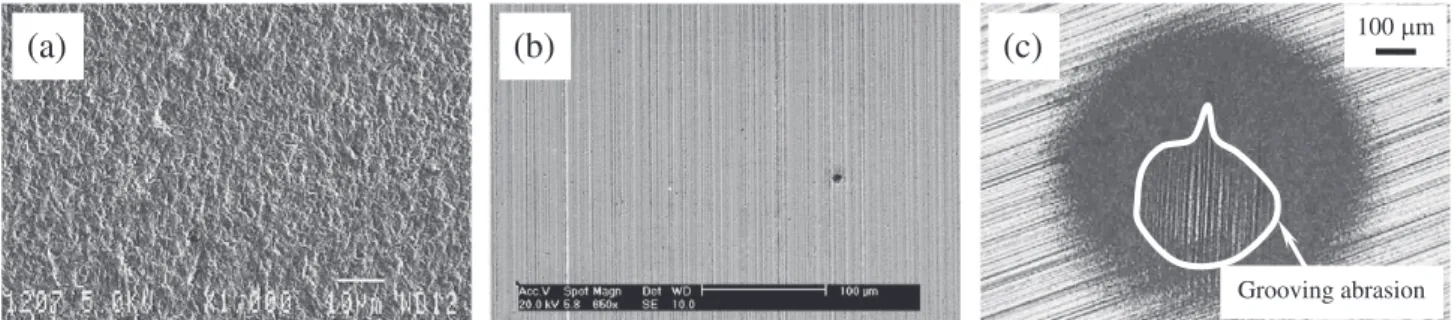
Two abrasive wear modes are usually observed on the surface of the worn crater:“rolling abrasion”results when the abrasive particles roll on the specimen, while“grooving abrasion”is observed when the abrasive particles slide[8–11]on the specimen. Depending on test conditions,“rolling abrasion”and“grooving abrasion”can occur simulta-neously in a given crater[1,3,4,8–10].Fig. 3a[8], b and c[3]presents, respectively, images of“rolling abrasion”,“grooving abrasion”and a simultaneous action of“rolling and grooving abrasion”.
The micro-abrasive wear test has been applied in the study of the abrasive wear of metallic[1–3,8]and non-metallic[3,4,11–15]materials and, depending on the equipment configuration, it is possible to apply normal loads (N) from 0.01 N[9,10]to 10 N[1,8,11,16,17]and ball rota-tional speeds (n) up to 80 rpm[1,12].
The wear behavior of different materials is analyzed based on the dimensions of the wear crater and/or on the wear mode. Since the early works of Hutchings[7–10,14,18], other important contributions ⁎ Tel.: +55 11 4353 2900; fax: +55 11 4109 5994.
E-mail address:[email protected].
0257-8972/$–see front matter © 2012 Elsevier B.V. All rights reserved. http://dx.doi.org/10.1016/j.surfcoat.2012.06.088
Contents lists available atSciVerse ScienceDirect
Surface & Coatings Technology
have been provided in terms of this type of test, such as: the wear mode transition[8–10], the wear coefficient (k)[12,13], micro-abrasive wear of coated systems[12–15,18–20], micro-contact modeling of abrasive wear[21–24], ridge formation[16,17,25,26]and angularity of abrasive particles[27].
Many works on friction coefficient (μ) during abrasive wear and other types of tests are available in the literature[28–31], but only a few were dedicated to the friction coefficient in micro-abrasive wear tests with rotating ball[14,22,32,33]. In particular, Shipway[22]has analyzed the friction coefficient in terms of the shape and movement of the abrasive particles, Kusano and Hutchings[32]presented a theo-retical model for friction coefficient in micro-abrasive wear tests with free ball equipment configuration and Cozza et al.[33]measured the tangential force developed during tests conducted in afixed ball equip-ment configuration, which allowed direct calculation of the friction coefficient by the ratio between the tangential and normal forces.
With the intent to collaborate with the understanding of the behavior of the friction coefficient and wear coefficient of thinfilms in micro-scale abrasion wear tests by rotative ball, this work has two purposes: to study the influence of TiN and TiC coatings hardness on thei)friction coefficient andii)wear coefficient.
2. Experimental details
2.1. Micro-abrasive wear test equipment
Equipment withfixed-ball configuration (Fig. 4a) was used in the micro-scale abrasive wear tests. This equipment was designed and as-sembled with some mechanical and electrical differences fromfi xed-ball equipments found in the literature[8–12,16,17,25,26,31].
In the test apparatus used in this work, the ball isfixed by two shafts, similar to systems available commercially[10,23], and their rotation (shafts and ball) is controlled by a couple“servo-motor/servo-controller”, which was purchased from Rexroth Bosch Group. This system allows the operator to select rotational speeds of the ball from 10−5rpm up to 9000 rpm, in both directions (clockwise and counter-clockwise). Nomenclature
a internal diameter of the wear crater (substrate) [mm] b external diameter of the wear crater (coating) [mm] D diameter of the ball [mm]
Ec Young's modulus of the coating [GPa] Ei Young's modulus of the indenter [GPa] E* reduced Young's modulus [GPa]
h total depth of the wear crater (coating + substrate) [mm] hc coating thickness [mm]
H hardness [GPa]
k wear coefficient [mm3/N.m]
kc wear coefficient of the coating [mm3/N.m] ks wear coefficient of the substrate [mm3/N.m]
kt total wear coefficient (substrate + coating) [mm3/N.m] n ball rotational speed [rpm]
N normal force [N] Q wear rate [mm3/m] R radius of the ball [mm] S sliding distance [m] t test time [s]
T tangential force (friction force) [N] v tangential sliding velocity [m/s]
V total wear volume (volume of the wear crater: coating+ substrate) [mm3]
Vc wear volume of the coating [mm3] Vs wear volume of the substrate [mm3]
Greek letters
α significance level μ friction coefficient μhigherhigher friction coefficient
μlower lower friction coefficient
νc coefficient of Poisson of the coating νi coefficient of Poisson of the indenter
ξ dimensionless constant (it indicates the severity of wear)
(b)
Shaft Ball Specimen
(c)
Shaft Ball Specimen
(a)
Tangential force – T Normal force – N Specimen Ball Abrasive slurry nFig. 4b shows the translation system. Part“A”is responsible for the translation movement of the specimen, which is forced against the ball. This translation movement is made with the help of a second coupled “servo-controller/servo-motor” (also provided by Rexroth Bosch Group); it rotates a screw and the normal force is applied, as presented inFig. 4c. The load cell that controls the normal force defined for the test is located between parts“A”and“B”.
The tangential force (T) generated during the tests is measured by a second load cell, where the specimen isfixed (Fig. 4c), and its value is shown by a readout system.
“Normal”and“tangential”forces load cells have a maximum capacity of 20 N and an accuracy of 0.004 N.
Finally, with the help of an electronic linear ruler (Fig. 4d–f) and a readout system (Fig. 4g), it is possible to continuously measure the displacement of the specimen (or, wear crater depth—h) during the tests, with precision of 1μm. These electronics instruments were used due to its accuracy; the value of 1μm is an excellent precision to this type of micro-abrasive wear test.
2.2. Materials
Experiments were conducted with one ball made of AISI 52100 steel, which presented a diameter (D) of 25.4 mm (1″). Two specimens of AISI D2 tool steel (nominal chemical composition of 1.59 wt.% C, 0.34 wt.% Mn, 0.29 wt.% Si, 0.02 wt.% P, 0.006 wt.% S, 11.20 wt.% Cr, 0.56 wt.% Mo, 0.94 wt.% V), one coated with titanium nitride (TiN) and the other coated with titanium carbide (TiC), were used in the tests. Before the deposition coatings, the AISI D2 tool steel was received annealed and after it was submitted to austenitizing at 1080 °C for 30 min, quenching in oil, and tempering at 540 °C for 2 h, with subse-quent cooling in air.
The thin films were deposited at the Instituto Tecnológico de Aeronáutica (ITA), in a Reactive Diode RF Magnetron Sputtering chamber.
Table 1 shows the parameters that were kept constant during the
depositions andTable 2presents the individual deposition conditions and the thickness (hc) of the thinfilms. Their reduced Young's modulus (E*) values were calculated based on nanoindentation data and these values allowed the calculation of the Young's modulus of the thinfilms, through Eq.(3). 1 E¼ 1−ν2 i Ei þ 1−ν2 c Ec ð 3Þ
Ei,νi,Ecand νcare the Young's modulus and the coefficient of Poisson of the indenter and coating[34,35], respectively, and their values are mentioned inTable 3.
The adhesion of the coatings was analyzed under the Rockwell C adhesion test, defined by the standard DIN-CEN/TS 1071-8. The quality indications were between HF1 and HF4, that specify the condition of
“sufficient adhesion”.
The abrasive used was black silicon carbide (SiC) with average particle size of 5μm[1,3,4,36,37].Fig. 5 [36]presents a micrograph of the abrasive particles (Fig. 5a) and its particle size distribution (Fig. 5b). The abrasive slurry was prepared as a mixture of 25% of SiC and 75% of distilled water, in volume. This mixture results in 1.045 g of SiC/cm3of distilled water[1,3,4,33,37].
Table 4presents the hardness (H) values of the materials used in this work (substrate, thinfilms, ball[1,3,4,33,37]and abrasive particles
[1,3,4,36,37]). The values for the thinfilms were calculated based on nanoindentation data, with a Berkovich indenter.
2.3. Micro-abrasive wear tests
Table 5shows the test conditions selected for the experiments conducted in this work.
Two values of normal force were defined for the wear experiments: N1= 1.25 N andN2= 5 N.
h
cBall
(b)
h
V
(a)
Coating Substrate(c)
200 µmb
a
Rotation directionFig. 2.Images of wear craters generated in coated systems: (a) total wear volume—V(schematic illustration); (b) total crater depth—hand coating thickness—hc(schematic illustration);
(c) internal diameter—aand external diameter—b[5].
(a)
(b)
(c)
100 mGrooving abrasion
Fig. 3.Abrasive wear modes: (a) rolling abrasion[8]; (b) grooving abrasion; (c) simultaneous action of rolling abrasion and grooving abrasion (with grooving abrasion at the center and rolling abrasion at the edges of the wear crater)[3]. (a) and (b): images obtained by Scanning Electron Microscope—SEM; (c): image obtained by Optical Microscope. In the case (c), the techniques of optical microscopy are better than SEM to show the full image of the wear crater and the actions of the abrasive wear modes.
The ball rotational speed wasn= 37.6 rpm, which was previously selected by Trezona et al.[8]and Adachi and Hutchings[9,10]. For n= 37.6 rpm andD= 25.4 mm (D= 1″;R= 12.7 mm), the tangential sliding velocity at the external diameter of the ball is equal to v= 0.05 m/s, which probably reduces or eliminates the occurrence of hydrodynamic effects during the tests[10].
Tests were run for six different sliding distances (S),S1= 10 m, S2= 16 m, S3= 25 m, S4= 40 m, S5= 63 m and S6= 100 m. These values were based on the Renard's Series—R20/4[38]. The correspondent test times were, respectively,t1=200 s (3 min 20 s),t2=320 s (5 min
20 s), t3=500 s (8 min 20 s), t4=800 s (13 min 20 s), t5=1260 s (21 min) andt6=2000 s (33 min 20 s), as presented inTable 5.
The electronic linear ruler presented inFig. 4allowed constant monitoring of the crater depth (h), and thus the calculation of the wear volume, for each test time, without the need to stop the test for crater dimension measuring. Three repetitions were conducted for each value ofN, totalizing 12 experiments. Each value of normal force,N1andN2, is the same for each test time, fromt1tot6.
The abrasive slurry was continuously agitated and was manually fed to the specimen-ball contact, with the help of a dropper, at a rate of one
(a)
Shafts
Sphere
Shafts
Load cell for tangential force
measurement
Ball
Linear displacement of the
specimen (“
h
”)
Specimen
Load cell for normal force
control
(linear displacement of the specimenRotation of the screw
and application of the normal force)
(c)
(b)
Part B
Part A
Back view of the equipment.
Fig. 4.(a) Micro-abrasive wear test equipment withfixed-ball configuration; (b) translation system; (c) general view of the equipment used in the experiments of this work—specimen: schematic illustration; (d) full view of the electronic linear ruler and support built with profiles“U”; (e)flattened piece of granite fabricated to support the electronic linear ruler; (f)fixing of the electronic linear ruler with the part“B”; (g) readout system that works together with the electronic linear ruler and indicates the displacement of the specimen (or, wear crater depth—h) during the tests, with a precision of 1μm.
drop every 20 s. This frequency is equal to that selected by Kusano and Hutchings[32], for the same type of micro-abrasive wear test. 2.4. Data acquisition and result analysis
The calculation of individual values for the wear volumes of the coating and the substrate was conducted based on the following procedure.
First, for each test time presented inTable 4, the respective crater depth (h) was measured (with the electronic linear ruler), and from Eq.(4) [8], the total wear volume (V) (coating and substrate) could be calculated.Ris the radius of the ball and the dimensionh(total depth of the wear crater) is schematized inFig. 2b.
V≅πRh2 forh≪R: ð4Þ
The wear volume of the substrate (Vs) and the wear volume of the coating (Vc) were calculated from Eqs.(5) and (6), respectively;hcis the coating thickness (Fig. 2b).
Vs≅πR hð −hcÞ 2 forh≪R ð5Þ Vc≅πR 2hhc−h 2 c forh≪R: ð6Þ
The total wear coefficient (kt), the wear coefficient of the substrate (ks) and the wear coefficient of the coating (kc) were calculated from Eqs.(7), (8) and (9), respectively.
kt¼π Rh2 NS ð7Þ ks¼π R hð −hcÞ 2 NS ð8Þ kc¼ πR 2hhc−h 2 c NS ð9Þ
Values of normal load (N) and tangential force (T) were registered during all the tests, once everyt= 40 s. Then, the friction coefficient was determined using Eq.(10).
μ¼NT ð10Þ
For each specimen (“AISI D2 tool steel coated with TiN”and“AISI D2 tool steel coated with TiC”), the three curves of friction coefficient as a function of the test time (μ=f(t)) obtained underN1= 1.25 N were compared with the three curves of μ=f(t) obtained under N2= 5 N through ANOVA (Analysis of Variance[39]), with a signifi -cance level (α) of 10%.
(d)
Support built with profiles “U”.
Linear ruler
Flattened piece of granite fabricated to support the linear ruler.
(e)
(f)
Fixing of the linear ruler with the part “B”.
Linear ruler.
(g)
Front view of the equipment. Fig. 4(continued). Table 2Conditions of deposition of the TiN and TiC coatings. Thinfilm Flux of N2 [sccm] Flux of CH4 [sccm] FN2 FN2þFAr FCH4 FCH4þFAr Pressure [mTorr] Time [min] hc [μm] TiN 6.0 – 0.23 – 3.5 165.0 2.0 TiC – 5.0 – 0.19 2.5 105.0 2.3 Table 1
Constant parameters of deposition of the TiN and TiC coatings.
Parameter Condition
Temperature 350 °C
Polarization voltage 0 V
RF generator power applied about the magnetron cathode 500 W
Initial pressure of Ar 3 mTorr
Base pressure 2 × 10⁻⁶
Later, the six μ=f(t) curves produced on the “AISI D2 tool steel + TiN”were compared with the sixμ=f(t) curves produced on the“AISI D2 tool steel+ TiC”, also through ANOVA andα= 10%.
Finally, for each specimen, the kt=f(t) curves were analyzed through ANOVA withα= 10%, too, following the same method adopted for theμ=f(t) curves.
These analyses were addressed to verify if the curves of friction co-efficient and wear coefficient as a function of the time are, statistically, equal or different, for the different coatings and normal forces. 3. Results and discussion
3.1. Abrasive wear modes
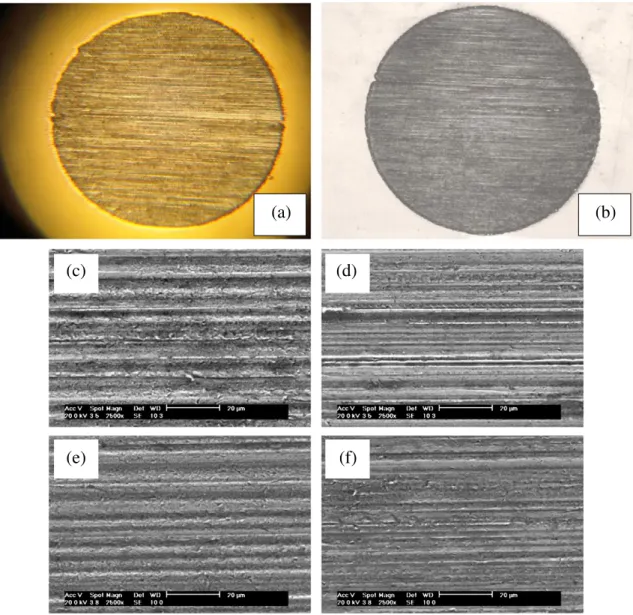
Optical microscopy analysis of the wear craters obtained in this work indicated that, in all cases, the abrasive wear mode was grooving abrasion (Fig. 6a and b). In all the cases, the tests were perforating, i.e. thefinal crater depth was larger than thefilm thickness.
Later, detailed analyses were conducted with a Scanning Electron Microscope and the occurrence of rolling abrasion was observed alongside the grooves (Fig. 6c–f). This phenomenon, the occurrence of rolling abrasion at the surface of or in between the grooves, was called“micro-rolling abrasion”by Cozza et al. [33]and Cozza[37], in previous works.
Fig. 6c and d presents SEM images of the center of the wear craters produced on the AISI D2 tool steel specimen coated with TiN, under N1= 1.25 N andN2= 5 N, respectively.Fig. 6e and f presents images of the center of the wear craters generated on the substrate coated with TiC, forN1= 1.25 N andN2= 5 N, respectively.
3.2. Friction coefficient behavior
Fig. 7presents the behavior of the friction coefficient (μ) as a function of the test time, for both AISI D2 tool steel specimens coated with TiN and TiC. In thisfigure, trend lines were drawn to approximately indicate the borders of the region with the experimental friction coefficient values. Then, two quantities,μhigherandμlower, were defined as the value of the upper and lower trend lines, respectively, fort6=2000 s; this procedure was equally conducted by Cozza et al.[33]. It is important to emphasize
thatμhigherandμlowerwere not calculated; they are approximate values defined based on the trend lines inserted in the graphs ofμ=f(t), for t6=2000 s.
For both“AISI D2 tool steel + TiN”and“AISI D2 tool steel + TiC”
and for bothN1= 1.25 N andN2= 5 N, the friction coefficient range remained fromμ= 0.4 toμ= 0.9. With the AISI D2 tool steel coated with TiN, it was observed a ratio between the higher friction coefficient and the lower friction coefficient ofμhigher/μlower≅1.8, and with the AISI D2 coated with TiC, the value wasμhigher/μlower≅2.
Through ANOVA, it was observed that:
(i) “AISI D2 + TiN”: for bothN1= 1.25 N andN2= 5 N, the friction coefficient values obtained are statistically different.Fig. 7a in-dicates that the friction coefficient values were slightly larger forN2= 5 N;
(ii) “AISI D2 + TiC”: for bothN1= 1.25 N andN2= 5 N, the friction coefficient values obtained are statistically different.Fig. 7b in-dicates that the friction coefficient values were slightly larger forN2= 5 N;
(iii) Comparison between“AISI D2 + TiN”and“AISI D2 + TiC”: for bothN1= 1.25 N andN2= 5 N, the friction coefficient values obtained are statistically different.
The average values of friction coefficient were: (i) “AISI D2 + TiN”forN1= 1.25 N:μ= 0.60 ± 0.08; (ii) “AISI D2 + TiN”forN2= 5 N:μ= 0.65 ± 0.09; (iii) “AISI D2 + TiC”forN1= 1.25 N:μ= 0.67 ± 0.09; (iv) “AISI D2 + TiC”forN2= 5 N:μ= 0.74 ± 0.10. 3.3. Relationship between hardness and friction coefficient
The hardness of a material affects the occurrence of rolling abrasion and/or grooving abrasion, as described in the wear map of Adachi and Hutchings[9,10]. Besides, the abrasive wear mode might have an im-portant role on the friction coefficient values. Kusano and Hutchings
[32], conducting ball-cratering abrasive wear tests in a test apparatus with“free-ball”configuration, obtained values of friction coefficient of approximately μ= 0.2, under conditions of rolling abrasion. On the other hand, Cozza et al.[33]observed higher values, fromμ= 0.2 to
Table 3
Values of the Young's modulus and coefficient of Poisson of the indenter and coatings, with the respective reduced Young's modulus.
Element E[GPa] ν E⁎[GPa]
Berkovich indenter 1140[34] 0.07[34] – TiN coating 341.9 0.19[35] 270.9 TiC coating 147.0 0.20 135.1
(a)
20 µm 0,01 0,1 1 10 100Diameter [
µ
m]
Distribution (%)
80 70 60 50 40 30 20 10 0(b)
Fig. 5.SiC abrasive particles[36]: (a) scanning electron micrograph; (b) particle size distribution. Table 4
Hardness of the materials used in this work.
Material Hardness—H[GPa (HV)]
Substrate AISI D2 tool steel 7.3 (744)
Thinfilm TiN 25.6
TiC 14.3
Ball AISI 52100 steel 8.4 (856)[1,3,4,33,37]
μ= 1.2, in a test device with“fixed-ball”configuration and under condi-tions ofgrooving abrasion.
The range of friction coefficient values obtained in this work (from μ= 0.4 toμ= 0.9) is included in the range obtained in the previous work of Cozza et al.[33](fromμ= 0.2 toμ= 1.2) and it may be related with the dominant occurrence of grooving abrasion.
In terms of the specimens analyzed in this work, the substrate (AISI D2 tool steel) was the same for both TiN and TiC coated speci-mens and then it is probably correct to consider that its hardness
had the same influence on the occurrence of the abrasive wear mode (grooving abrasion in all experiments) and on the friction co-efficient behavior. In fact, although the curvesμ=f(t) are statistically different, the average values are similar (“AISI D2 tool steel + TiN”: 0.6 and 0.65, to 1.25 N and 5 N, respectively; “AISI D2 tool steel + TiC”: 0.67 and 0.74, to 1.25 N and 5 N, respectively). Thus, in this work, the hardness of the coatings did not have a significant influence on the friction coefficient values as a function of the test time.
Table 5
Test conditions selected for the micro-abrasive wear experiments.
Test condition⇒ 1 2 3 4 5 6
Normal force—N1[N] 1.25 1.25 1.25 1.25 1.25 1.25
Normal force—N2[N] 5 5 5 5 5 5
Sliding distance—S[m] 10 16 25 40 63 100
Ball rotational speed—n[rpm] 37.6 37.6 37.6 37.6 37.6 37.6
Tangential sliding velocity—v[m/s] 0.05 0.05 0.05 0.05 0.05 0.05
Test time—t 200 s 320 s 500 s 800 s 1260 s 2000 s
(3 min 20 s) (5 min 20 s) (8 min 20 s) (13 min 20 s) (21 min) (33 min 20 s)
(c)
(d)
(e)
(f)
(b)
(a)
Fig. 6.Wear craters obtained in the experiments. (a) AISI D2 tool steel with TiN and (b) AISI D2 tool steel with TiC; images obtained with Optical Microscope, where it is possible to note only the occurrence of grooving abrasion. (c)–(f): Occurrence of micro-rolling abrasion, as related in previous works[33,37]. (c) and (d): AISI D2 tool steel coated with TiN, normal force ofN1 = 1.25 N andN2 = 5 N, respectively; (e) and (f): AISI D2 tool steel coated with TiC, normal force ofN1 = 1.25 N andN2 = 5 N, respectively. Sliding distance of S6 = 100 m.
In this work, Analysis of Variance was not addressed to friction co-efficient as a function of the hardness of the substrate because the substrate material was the same (AISI D2 tool steel) for both TiN and TiC coatings.
3.4. Wear coefficient behavior
Fig. 8presents the behavior of the wear coefficient as a function of the test time, for the“AISI D2 tool steel coated with TiN”and“AISI D2 tool steel coated with TiC”. Thisfigure shows the total wear coefficient (kt) (substrate + coating), the wear coefficient of the substrate (ks) and the wear coefficient of the coating (kc).
Through ANOVA, it was observed that:
(i) ForN1= 1.25 N: the wear coefficient values obtained are sta-tistically different, for TiN and TiC coatings.Fig. 8a indicates that the wear coefficient values were larger for the TiC coatings (lower hardness);
(ii) ForN2=5 N: the wear coefficient values obtained are statistically different, for TiN and TiC coatings.Fig. 8b indicates that the wear coefficient values were larger for the TiC coatings (lower hard-ness);
(iii) Comparison between“AISI D2+TiN”and“AISI D2+TiC”: for both N1=1.25 N andN2=5 N the wear coefficient values obtained are statistically different.
For both“AISI D2 tool steel + TiN”and“AISI D2 tool steel + TiC”, the application of the normal forceN2= 5 N resulted in higher values ofkt,ksandkcthan withN1= 1.25 N, which is a result in qualitative agreement with the literature[11,40]; higher normal forces favor higher wear coefficients and lower normal forces favor lower wear
coefficients. Besides, with the increase of the thinfilm hardness, the wear coefficient decreased, which is also in qualitative agreement with the Archard's law (Eq.(11) [41]).
Q¼ξNH: ð11Þ
WhereQis the rate of wear andξis a dimensionless constant that indicate the severity of wear[41].
AnalyzingFig. 8a and b, it is possible to note that, for both TiN and TiC coatings, the wear coefficients of the coatings (kc- TiC andkc- TiN) are similar for the two values of normal force. This similarity is related to a similarity infilm thickness (2.0μm and 2.3μm, TiN and TiC, respectively), which provides similar wear volumes. Nevertheless, it is important to no-tice that, from approximately 400 s, the wear coefficientkcof the coating with the lowest hardness (TiC) was consistently higher than that with the highest hardness (TiN).
Each specimen presented a distinct behavior in terms of the wear coefficient (ktandks) as a function of the test time. For the“AISI D2 tool steel + TiN”, the total wear coefficient and the wear coefficient of the substrate decreased as a function of the test time, while thekt andksvalues for the“AISI D2 tool steel + TiC”presented a maximum point at aboutt4= 800 s. In micro-abrasive wear tests it is usually recommended to conduct a comparison between two tested materials only after the steady state of wear is achieved, i.e. after the point where no significant variation in wear coefficient is observed as a func-tion of time. This idea opposes a direct comparison between the values ofksandktinFig. 8, since the steady state of wear was not achieved in some cases, especially with the TiC-coated specimen. On the other hand, some work must be dedicated to the understanding of why two 0.0 0.2 0.4 0.6 0.8 1.0 1.2 0 250 500 750 1000 1250 1500 1750 2000 2250
Friction coefficient -
µ
Test time -
t
[s]
µ
higherµ
lower(a)
N1 = 1.25 N N2 = 5 N TiNFriction coefficient -
µ
Test time -
t
[s]
0.0 0.2 0.4 0.6 0.8 1.0 1.2 0 250 500 750 1000 1250 1500 1750 2000 2250µ
higherµ
lower(b)
N1 = 1.25 N N2 = 5 N TiCFig. 7.Friction coefficient as a function of the test time. AISI D2 tool steel coated with (a) TiN and (b) TiC, against abrasive particles of SiC (average particle size of 5μm) and ball of AISI 52100 steel.
coated specimens with the same substrate material presented such difference in behavior.
4. Conclusions
The results obtained in this work have indicated that:
(1) The hardness of the coatings did not have a significant influence on the friction coefficient values; they remained in the same range, fromμ= 0.4 toμ= 0.9, and with average values between 0.6 and 0.74. Besides, for both “AISI D2 tool steel + TiN”and
“AISI D2 tool steel + TiC” the friction coefficient curves presented, practically, the same behavior, independent of the hardness of the coatings;
(2) The TiN-coated specimen (higher hardness) presented lower wear coefficient values (kt,ksandkc) than the TiC-coated specimen. In terms of the wear coefficient of the coatingkc, the difference may be associated either with the higher thickness or to the lower hard-ness of the TiC coating.
Acknowledgments
The author gratefully acknowledges FAPESP—São Paulo Research Support Foundation, for the full financial support through Project Number 2012/00930-5 for the oral presentation of this paper at the 39th ICMCTF—International Conference on Metallurgical Coatings & Thin Films, Prof. Maria Helena Santos Takeda, from Polytechnic School of the University of São Paulo, for the help in the statistics
analysis, Prof. José Carlos Bressiani, from Nuclear and Energetic Re-searches Institute, for the silicon carbide and the abrasive particle size distribution analysis, Paulo Zanini, Rafael Rozolen and Vitor Benkard Lira, from Rexroth Bosch Group, for the help in the start-up of the servo-motors and servo-controllers.
References
[1] R.C. Cozza, M.Sc. Dissertation, Polytechnic School of the University of São Paulo, São Paulo - SP, Brazil, 2006, 217 p. (Available online:http://www.teses.usp.br/). [2] W.M. da Silva, R. Binder, J.D.B. de Mello, Wear 258 (2005) 166.
[3] R.C. Cozza, J.D.B. de Mello, D.K. Tanaka, R.M. Souza, Wear 263 (2007) 111. [4] R.C. Cozza, D.K. Tanaka, R.M. Souza, Surf. Coat.Technol. 201 (2006) 4242. [5] R.C. Cozza, R.C. Cozza, A.A.C. Recco, A.P. Tschiptschin, R.M. Souza, D.K. Tanaka,
Tecnol. Metal. Mater. Miner. São Paulo 6 (4) (2010) 237 abr.-jun. (Available online: http://www.abmbrasil.com.br/).
[6] D.A. Kelly, I.M. Hutchings, Wear 250 (2001) 76.
[7] K.L. Rutherford, I.M. Hutchings, J. Test. Eval. 25 (2) (1997) 250. [8] R.I. Trezona, D.N. Allsopp, I.M. Hutchings, Wear 225–229 (1999) 205. [9] K. Adachi, I.M. Hutchings, Wear 255 (2003) 23.
[10] K. Adachi, I.M. Hutchings, Wear 258 (2005) 318. [11] K. Bose, R.J.K. Wood, Wear 258 (2005) 322.
[12] J.C.A. Batista, A. Matthews, C. Godoy, Surf. Coat.Technol. 142–144 (2001) 1137. [13] J.O. Bello, R.J.K. Wood, Wear 258 (2005) 294.
[14] K.L. Rutherford, I.M. Hutchings, Surf. Coat.Technol. 79 (1996) 231. [15] A. Ramalho, Surf. Coat.Technol. 197 (2005) 358.
[16] P.H. Shipway, C.J.B. Hodge, Wear 237 (2000) 90.
[17] M.G. Gee, A. Gant, I.M. Hutchings, R. Bethke, K. Schiffman, K. Van Acker, S. Poulat, Y. Gachon, J. von Stebut, Wear 255 (2003) 1.
[18] I.M. Hutchings, Tribol. Int. 31 (1–3) (1998) 5. [19] D.N. Allsopp, I.M. Hutchings, Wear 251 (2001) 1308. [20] K.L. Rutherford, I.M. Hutchings, Tribol. Lett. 2 (1996) 1. [21] J.A. Williams, Wear 225–229 (1999) 1.
[22] P.H. Shipway, Wear 257 (2004) 984.
[23] P.E. Sinnett-Jones, J.A. Wharton, R.J.K. Wood, Wear 259 (2005) 898. 0.00 0.05 0.10 0.15 0.20 0.25 0.30 0.35 0.40 0.45 0.50 0 200 400 600 800 1000 1200 1400 1600 1800 2000
(a)
Wear coefficient
-k
[10
-3mm
3/N.m]
Test time -
t
[s]
kt - TiC kt - TiN ks - TiC ks - TiN kc - TiC kc - TiN kt - TiC kt - TiN ks - TiC ks - TiN kc - TiC kc - TiNTest time -
t
[s]
0.00 0.05 0.10 0.15 0.20 0.25 0.30 0.35 0.40 0.45 0.50 0 200 400 600 800 1000 1200 1400 1600 1800 2000(b)
Wear coefficient -
k
[10
-3mm
3/N.m]
[24] J.A. Williams, A.M. Hyncica, J. Phys. D: Appl. Phys. 25 (1992) A81. [25] R.I. Trezona, I.M. Hutchings, Wear 233–235 (1999) 209.
[26] D.N. Allsopp, R.I. Trezona, I.M. Hutchings, Tribol. Lett. 5 (1998) 259. [27] G.B. Stachowiak, G.W. Stachowiak, Wear 256 (2004) 600. [28] Y. Xie, J.A. Williams, Wear 196 (1996) 21.
[29] A. Neville, V. Kollia-Rafailidi, Wear 252 (2002) 227. [30] S. Dhanasekaran, R. Gnanamoorthy, Wear 262 (2007) 617.
[31] L. Ceschini, G. Palombarini, G. Sambogna, D. Firrao, G. Scavino, G. Ubertalli, Tribol. Int. 39 (2006) 748.
[32] Y. Kusano, I.M. Hutchings, Wear 258 (2005) 313. [33] R.C. Cozza, D.K. Tanaka, R.M. Souza, Wear 267 (2009) 61. [34] G.M. Pharr, Mater. Sci. Eng. A 253 (1998) 151.
[35] R.F. Bunshah, HANDBOOK of Hard Coatings—Deposition Technologies, Properties and Applications, Materials Science and Processing Technology Series, Noyes Publications, William Andrew Publishing, LLC, Norwich, New York, USA, 2001. [36] V.A. Izhevskyi, L.A. Genova, J.C. Bressiani, A.H.A. Bressiani, Cerâmica 50 (2004) 261. [37] R.C. Cozza, Ph.D. Thesis, Polytechnic School of the University of São Paulo, São
Paulo - SP, Brazil, 2011, 327 p. (Available online:http://www.teses.usp.br/). [38] Standard DIN 804 - Edition: March/1977.
[39] G.E.P. Box, J.S. Hunter, W.G. Hunter, Statistics for Experimenters—Design, Innovation, and Discovery, 2nd Edition John Wiley & Sons, Inc., Hoboken, New Jersey, USA, 2005. [40] K. Bose, R.J.K. Wood, Diam. Relat. Mater. 12 (2003) 753.
[41] I.M. Hutchings, Tribology—Friction and Wear of Engineering Materials, 7th edition Edward Arnold, a division of Hodder Headline PLC, London, UK, 1992.
![Fig. 1. Micro-abrasive wear testing by rotating ball: (a) schematic diagram of its principle [1];](https://thumb-us.123doks.com/thumbv2/123dok_us/11047894.2991994/2.892.121.771.700.1089/fig-micro-abrasive-testing-rotating-schematic-diagram-principle.webp)

![Fig. 5. SiC abrasive particles [36]: (a) scanning electron micrograph; (b) particle size distribution.](https://thumb-us.123doks.com/thumbv2/123dok_us/11047894.2991994/6.892.179.731.911.1085/fig-abrasive-particles-scanning-electron-micrograph-particle-distribution.webp)