Application of PCA Based Hybrid Taguchi Method
for Multi-Response Optimization of CNC Milling
Of Composite Al6061+10%SiC
p
and
Al6061+15%SiC
p
Shaik Lalu, N1, Amaranages wara Rao2,Koppula Supriya3 1
Department of Mechanical Engineering, Nimra College of Engineering and Technology, Ibrahim Patnam, Vijayawada, India 2
Associate Professor, Department Of Mechanical Engineering, Nimra College Of Engineering And Technology, Ibrahim Patnam, Vijayawada, India
3
assistant Professor, Dvr &Dr Hs Mic College Of Technology, Vijayawada, India
Abstract: Now a day’s increased demand of lightweight materials with high strength to weight ratio in the aerospace and automotive industries has led to the development and use of Al-alloy-based composites. In this project I done an attempt has been made to prepare Al6063-SiCP composite material and the optimization of CNC milling process parameters for 10% and 15% Al6063-SiCP composite material. The attractive characteristics, strength as well as weight ratio makes the comprehensive research on Al-SiCp MMC is carried out whole world because of it is widely used in automotive & aerospace industries. However, the behavior of Al with different percentages of SiCp combined action together with wetting agents. The present study investigates with the mechanical properties and microstructure of Al-alloy with 10%, 15% weight of SiCp. The compositions were added up to the ultimate level at electrical furnace & used for the fabrication of the aluminum metal matrix composites. The fabricate material is to study of composition of SiCp. The fabricate material is to test on BHN, ROCKWELL, HARDNESS, TENSILE, TORSION, & IMPACT to get mechanical properties at different composition of SiCp. In order to improve the quality and productivity the present study highlights the optimization of CNC milling process parameters like speed, feed rate, depth of cut and different coated HSS tools to provide a good surface finish as well as high material removal rate. In this project an attempt has been made to optimize the process such that the best surface roughness value as well as high material removal rate can be obtained in a process. Hence a multi objective optimization problem has been obtained which can be solved by the hybrid Taguchi method comprising of principal components analysis as well as by utility theory. In this work, Individual response correlation has been eliminated first by mean of Principal Component Analysis (PCA) to meet the basic assumption of Taguchi method. Correlated responses have been transformed into uncorrelated quality indices called as principal components. Quality loss estimates have been calculated from the principal components and the utility values are found out for the same. Then the overall utility index has been calculated. Finally, Taguchi method has been used to solve the optimization problem
Keywords: MMC, SiCp, Mechanical properties, Stir casting process, CNC Milling, Principal Components Analysis, Utility theory,Taguchi method
I. INTRODUCTION
provides a extensive introduction to this embryonic field of materials science through an exposition of the properties and the microstructural characteristics of these materials, a discussion of the production processes for MMCs. MMCs consist of a metal base that is reinforced with one or more constituents, such as continuous graphite, alumina (Al2O3), silicon carbide (SiC), or boron fibers or discontinuous graphite or ceramic materials in particulate or whisker form. Most common MMCs are Al2O3 or SiC particulate reinforced light alloys (usually Aluminium).
The machining of this composite material (MMC) of Aluminium 6061 with Silicon Carbide (about10%, 15%) may done by using CNC milling machine. And then by using hybrid taguchi method combined with PCA and utility theory concept, the optimum values of surface roughness and MRR may calculate. To carry out this present work the following are the some of the research papers.
II. READINESS OF MMC
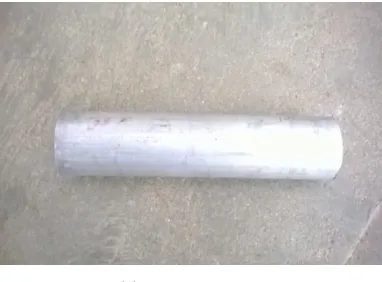
We use AL-6061 T6 and silicon carbide (SIC) of 30microns.After the raw materials we perform stir casting method to make the MMC as shown in fig 1 below
The particles used for MMC in this study were a type of SiCp particles with average diameter of 25 lm. The volume fraction of SiCp particles added to the melt was restricted to 10%. The reason for using a SiCp is that it has a high
Fig 1 (a) Aluminium 6061-T6
hardness, a low coefficient of thermal expansion and a good wetting property. The SiCp particles were mixed and dispersed in the molten 6061 Al-alloy using the Vortex Method. A schematic view of stir casting process used in this process has been presented in Fig. 1. The 6061 Al-alloy was melted in a crucibleand then stirred at high speed to create a vortex by stainless steel agitator coated with molybdenum using the plasma spray method. The SiC particles were then gradually added and stirred in. During this stage 1-2% calcium was added to the melt as wetting agent. The effect of calcium is that it accumulates in high concentrations in the vicinity of the surface of SiC particles. It reduces the surface tension of aluminum as well as increases the wetting properties of aluminum and SiC. In this way, mixing and dispersion time also reduces a large extent. It was possible to disperse the particles evenly after 60 min of stirring. The whole process of
melting and mixing was carried out under an inert atmosphere of argon gas. The important points in these conditions are the
[image:3.612.211.402.271.412.2]agitator. If the temperature of the molten Al-alloy is too low, it
will not be possible to create a vortex and if it is too high,
shown in fig 2. The as-cast billets of 6061 Al-alloy sicp (particle size=24 lm ad vf=10%) of 55mm diameter and with a hardness value of 47 HB were tuned
Stir casting Process
Pouring of Molten Metal into Mould
A. Heat Treatment Annealing Process
Annealing is applied to both grades to promote softening. Complete and partial annealing heat treatments are the only ones used for the non-heat treatable alloys. The exception is the 5000 series alloys which are sometimes given low temperature stabilisation treatment and this is carried out by the producer. Annealing is carried out in the range 300-410°C depending on the alloy. Heating times at temperature vary from 0.5 to 3 hours, conditional on the size of the load and the alloy type. Generally, the time need not be longer than that required to stabilise the load at temperature. Rate of cooling after annealing is not critical. Where parts have been solution heat-treated a maximum cooling rate of 22°C per hour must be maintained until the temperature is reduced to 295°C. Below this temperature, the rate of cooling is not important.
B. Mechanical Property Test
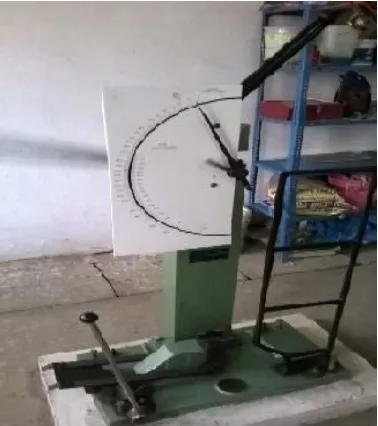
generally exhibit greater impact strength. Statics tests are unsuitable for determining the impact strength. Dynamic tests have been developed to establish impact resistance by using a notches specimen.The specimen is held in an anvil and is broken by a single blow of the pendulum or hammer, which falls from a fixed height (h1). After breaking the specimen the pendulum continues to swing on the other side through a height (h2). If the weight of the hammer is W, then the energy delivered to the specimen to break it is (h1-h2). The pendulum type impact machine is provided with scales and pointer, and scales are usually calibrated to read energy required to break the specimen in kilojoules.Charpy V-notch test was conducted on impact machine as shown in figure 1 for different percentages of Al6061-SiC and results were shown in the table 1. Graphically these results are shown in figure 2
Fig 2 impact machine
Impact Test Results in Joules
%SiCp 5% 10% 15%
Charpy test 7.7 12 09
Impact load Vs wt % of SiCp
C. Rockwell
In the Rockwell hardness test, the hardness is determined by the depth of penetration of a indenter, rather than by surface area of the indentation. the specimen placed on stage is brought into contact with the penetrator , the penetrator is then slowly forced into the specimens surface by weights acting through a system of levers.
The hardness test was conducted on hardness machine as shown in figure 3.14 for different percentages of Al6061-SiC and results were shown in the table
%SiCp 5% 10% 15%
Brinell hardness 85 97 98.5
Rockwell hardness 17 26.5 28.5
At LOAD=140kgf, BALL=2.4mm
1) Torsion Test: Torsion is the twisting of an object due to an applied torque. It is expressed in Newton-metres (N-m). In sections perpendicular to the torque axis, the resultant shear stress in this section is perpendicular to the radius. Torsion was conducted on torsion testing machine for different percentages of Al6061-SiC and results were shown in the table
Angle of twist in degrees
5% 10% 15%
0-5 3.7 8.5 11
5-10 6.4 17 14.5
10-15 11.9 20.9 17.2
15-20 14.5 23 19.5
20-25 16.4 26.5 20.5
25-30 17.8 26.5 21.3
Graph : Torque (N-m) Vs Angle of twist in degrees
Table 3.4. Ultimate & Yield Results In KN/mm2
%SiCp 5% 10% 15%
Yield strength 79.6 90.1 101.7
Ultimate strength 104.1 122.8 143.5
Ultimate strength & Yield stress Vs wt % of Sicp
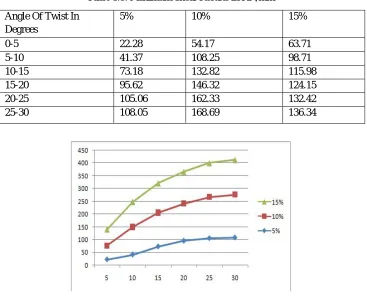
[image:7.612.124.491.322.619.2]3) Shear Stress: When Yielding occurs in any material, the maximum shear stress at the point of failure equals or exceeds the maximum shear stress when yielding occurs in the tension test specimen. Shear stress was found out for different percentages of Al6061-SiC and results were shown in the table 3.5. Graphically these results are shown in figure 3.20.
Table 3.5. Maximum Shear Results in KN/mm2
Angle Of Twist In Degrees
5% 10% 15%
0-5 22.28 54.17 63.71
5-10 41.37 108.25 98.71
10-15 73.18 132.82 115.98
15-20 95.62 146.32 124.15
20-25 105.06 162.33 132.42
25-30 108.05 168.69 136.34
Figure Shear stress Vs Angle of twist in degrees
4) Principal Component Analysis (PCA) is a way of identifying patterns in the correlated data, and expressing the data in a way so as to highlight their similarities and differences, Johnson and Wichern (2002). The main benefit of PCA is that, the data can be compressed once the patterns in data have been identified, i.e. by reducing the number of dimensions, without much loss of information. The various PCA methods are discussed below. Assuming, the number of experimental runs in Taguchi's OA design ism , and the number of quality characteristics is n . The Experimental results can be expressed by the following series:
X1 = { X1(1), X1(2),... X1(k),... X1(n)} Xi = { Xi(1), Xi(2),... X1(k),... X1(n)} Xm = { Xm(1), Xm(2),... Xm(k),... Xm(n)}
Here Xi represents the ith experimental results and is called the comparative sequence in grey relational analysis.
Let X0 be the reference sequence:
Let X0= { X0(1), X0(2),... X0(k),... X0(n)}
The value of the elements in the reference sequence means
the optimal value of the corresponding quality characteristic.
Xo and Xj both includes n elements, and X0(k)
Xi(k)represent the numeric value of ^element in the
reference sequence and th
e Comparative sequence,
respectivel
y, k =1,2,……,n . The
Following illustrates
proposed parameter optimization processes in detail, (Su and
Tong,
1997).
Step 1:
Normalizatio
n of
th
e responses
Characteristics)
When the range of the series is too large or the optimal value
of a qualit y
characteristi
c is too
huge, it will cause
influence of some factors to be overlooked. The
5) EquipmentsUsed: (a) The machine used for the milling tests is a 'M-TAB' CNC milling machine as shown in fig
.
Three different cutting tools are used in this investigation are shown in fig
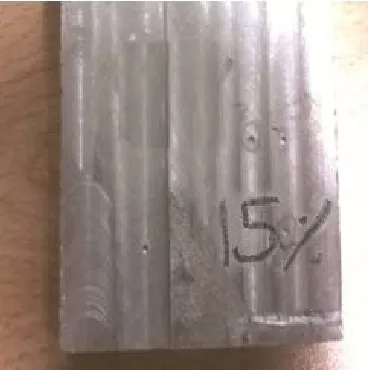
Three different work pieces are used in this investigation are Aluminium+Silicon Carbide (5%), Aluminium+Silicon Carbide (10%) and Aluminium+Silicon Carbide (15%) as shown in fig 1, 2 and 3 respectively.
In this test, a flat ring having geometry; outer diameter: inner diameter: height in proportions of 6:3:2; was upset plastically between two flat platens. shows the ring compression sample with OD: ID: H = 15:7.5:5 mm (6: 3: 2). These ring samples were allowed to deform slowly up to 50% at the rate of 0.25 mm/sec by using computer controlled electrical screw driven 100 kN universal testing machine (Model: UT 9102; Dak System Inc). The internal diameter of the ring was measured intermittently by stopping the test up to a maximum deformation of 50% or up to fracture whichever is earlier. As the height is reduced, the ring expands radially outwards. By measuring the change in specimen’s internal diameter and using the curves which are obtained through theoretical analysis, the coefficient of friction was determined.
Aluminium + Silicon Carbide (5%)
Aluminium + Silicon Carbide (15%)
Different Levels of the Experiment Aluminum 6063+ SiC
Levels
d (mm) N (rpm) f (mm/min) Tool Type
1 0.3 1300 30 HSS
2 0.6 1600 40 HSS+TiN
3 0.8 1900 60 HSS+AlTiN
Material - I : Al 6063 + SiC(5%)
[image:10.612.214.398.78.263.2]
Table : Experimental Results
Measured Roughness Parameters and MRR
S .No.
Ra Rq Rku Rsm MRR
1 1.537 1.945 3.73 0.144 96.780
2 3.418 4.427 3.395 0.245 287.681
3 4.313 5.356 2.648 0.223 513.763
4 2.942 3.653 2.900 0.145 191.785
6 2.027 2.613 0.197 192.661
3.21
0.276 253.394
7 3.206 4.206 3.272
8 2.183 2.547 2.210 0.143 144.828
9 3.874 4.894 2.835 0.289 381.818
The surface roughness parameters have been measured in this experiment using the Talysurf (Taylor Hobson, Surtronic 3+).
The measured roughness parameters along with the Design Matrix
. PCA CALCULATIONS FOR Al 6063 + SiC(5%)
DATAANALYSIS
Calculations for Normalization
S. No. Ra Rq Rku Rsm MRR
Ideal 1.000 1.000 1.000 1.000 1.000
Sequence
1 1.000 1.000 0.582 1.000 0.178
2 0.449 0.420 0.670 0.474 0.570
3 0.356 0.353 0.855 0.512 1.060
4 0.521 0.563 0.732 0.558 0.383
5 0.704 0.639 0.548 0.455 0.752
6 0.757 0.764 0.588 0.558 0.385
7 0.479 0.452 0.65 0.399 0.443
8 0.703 0.733 1.000 0.769 0.292
9 0.396 0.367 0.880 0.381 0.733
: Principal Component
Major Principal Components
S.No. MAJOR PRINCIPAL
COMPONENT S
V1 V2 V3
Ideal -2.097 0.772 -0.187
sequence
1 -1.851 -0.094 -0.098
2 -1.064 0.527 0.017
3 -1.163 1.010 0.001
4 -1.176 0.374 0.154
5 -1.258 0.574 -0.286
6 -1.359 0.208 -0.120
7 -1.045 0.480 0.038
8 -1.636 0.294 0.287
9 -1.041 0.769 0.039
In order to eliminate response correlations, Principal Component Analysis has been applied to derive five independent quality indices called principal components. The analysis of the correlation matrix has been shown in the table 11. The independent quality indices are denoted as PC1, PC2, PC3, PC4 and PC5. represents the values of these independent principal components for 9 experimental runs. The principal components are calculated using the equation 5.
It has been found that the cumulative accountability proportion for the first three components, by itself is 100%. Therefore the fourth and fifth components can be eliminated and the first three components have been taken into further consideration. Quality loss values have been calculated and the values
The utility values are calculated using equation 6&7 and they are shown in table 14. The three values of the constants that are used for calculating the utility values are found as
Al = -15.969, A2 = -3.758 and A3 = -10.560.
6) UtilityValues
Utility Values
S.No.
V1 V2 V3
1 9.00 0.000 7.674
3 0.555 2.062 4.254
4 1.164 1.255 1.565
5 1.844 2.354 7.674
6 2.431 0.641 9.700
7 0.095 1.737 3.728
8 5.170 0.974 0.000
9 0.000 9.070 3.407
Figure: S/N Ratio Plot for Al 6063+SiC(5%)
Measured Roughness Parameters and MRR
S .No.
Ra Rq Rku Rsm MRR
2 2.154 2.617 2.821 0.173 287.471
3 2.066 2.562 3.248 0.178 513.361
4 2.176 2.409 3.954 0.228 190.109
5 3.776 4.394 3.437 0.346 388.189
6 1.850 2.287 3.320 0.147 190.109
7 3.245 4.611 3.028 0.272 254.345
8 1.733 2.725 3.043 0.179 143.236
9 1.529 1.594 3.757 0.175 381.118
The parameters of surface roughness has been measured by this
experiment using the Talysurf (Taylor Hobson, Surtronic 3+). This experiment measures the roughness parameters along with the Design of
matrix have been shown in Table
Use “figure caption” for your Figure captions, and “table head” for your table title. Run-in heads, such as “Abstract,” will require you to apply a style (in this case, italic) in addition to the style provided by the drop down menu to differentiate the head from the text.
PCA CALCULATIONS FOR Al 6063 +SiC(10%) DATA ANALYSIS.
Experimental data have been normalized using equation 1&2. For surface roughness a Higher the better criterion has been selected. The normalized data have been shown in the table 18.
Normalized Data
S. No. Ra Rq Rku Rsm MRR
Ideal 1.000 1.000 1.000 1.000 1.000
Sequence
1 0.7040 0.6440 0.5422 0.8486 1.0400
2 0.7441 0.7462 1.0040 0.8450 0.3435
3 0.7565 0.7758 0.8627 0.8246 0.187
4 0.7460 0.7510 0.7242 0.6445 0.5045
5 0.473 0.4516 0.8437 0.4245 0.2458
6 0.877 0.8752 0.862 1.000 0.5055
7 0.4756 0.4744 0.939 0.5540 0.3758
8 0.9510 0.8936 0.928 0.8521 0.6570
9 1.0005 1.000 0.759 0.8540 0.2552
After normalization a check has been made to verify whether the responses i.e. the quality indices are correlated or not. The correlation coefficient between the different surface.
8) Calculations for Eigen Values and Eigen Vector
Eigen Values, Accountability Proportion andCumulative
Accountability Proportion
Eigen Values 0.405 0.083 0.024 0.007
0.001
AP 0.779 0.160 0.046 0.013 0.002
CAP 0.779 0.939 0.985 0.998 1.000
Eigen Vectors
VARIABLE PC1 PC2 PC3 PC4 PC5
Ra 0.446 0.042 0.467 -0.501 0.677
Rq 0.453
0.51
2 0.453 -0.393 -0.731
Rku 0.445
0.40
1 -0.841 -0.135 0.032
Rsm 0.434 -0.540 0.264 0.941
0.054
MRR 0.225 -0.946 -0.505 -0.313 -0.062
9) Calculation for principle component
Experimental data have been normalized using equation 1&2. For surface roughness a Higher the better criterion has been selected. The normalized data have been
S. No. Ra Rq Rku Rsm MRR
Ideal 1.000 1.000 1.000 1.000 1.000
Sequence
1 0.700 0.640 0.522 0.886 1.000
2 0.741 0.762 1.000 0.850 0.335
3 0.755 0.778 0.867 0.826 0.187
4 0.740 0.710 0.722 0.645 0.505
5 0.413 0.416 0.837 0.425 0.248
6 0.857 0.872 0.862 1.000 0.505
7 0.476 0.474 0.939 0.540 0.378
8 0.910 0.896 0.928 0.821 0.670
After normalization a check has been made to verify whether the responses i.e. the quality indices are correlated or not. The correlation coefficient between the different surface.
10)Calculations for Eigen Values and Eigen Vectors
Eigen Values, Accountability Proportion andCumulative Accountability Proportion
Eigen Values 0.405 0.083 0.024 0.007
0.001
AP 0.799 0.960 0.076 0.053 0.042
CAP 0.799 0.935 0.885 0.898 1.500
11)Calculations for Principal Components: Principal Component S.No
. MAJOR PRINCIPAL
COMPONENTS
V1 V2 V3
Ideal 2.195 -0.351 -0.272
sequence
1 1.587 -0.664 -0.174
2 1.676 0.927 -0.176
VARIABLE PC1 PC2 PC3 PC4 PC5
Ra 0.446 0.042 0.377 -0.471 0.697
Rq 0.443 0.122 0.373 -0.303 -0.791
Rku 0.447 0.531 -0.781 -0.045 0.002
Rsm 0.484 -0.150 0.144 0.851
0.044
MRR 0.295 -0.866 -0.435 -0.233 -0.063
3 1.661 0.282 -0.081
4 1.430 -0.063 -0.172
5 1.047 0.220 -0.373
6 1.896 0.931 -0.077
7 1.264 0.153 -0.478
8 1.898 -0.097 -0.184
9 1.818 0.103 0.173
III. CONCLUSION
The result from the project work give to suggest that with composition of Sic is increase, an hardness are increase , normalized displacement and impact strength have been observed. The best result has been abtain at 15% weight fraction of 320 grit size SiC simillarly dispersion of sic particles in the samples preparation
Optimal parameter setting has been valuated for Al6061+SiC (5%) , Al6061+SiC (10%), Al6061+SiC (15%)
Optimal parameter setting has been valuated for Al6061+SiC (5%) Depth cut = 0.3, speed=1897rpm, Feed= 35mmlmin and tool type is HSS+A1TiN
Optimal parameter setting has been valuated for Al6061+SiC (10%) Depth cut = 0.7, speed=1800rpm, Feed= 45mmlmin and tool type is HSS+A1TiN
Optimal parameter setting has been valuated for Al6061+SiC (15%) Depth cut = 0.7, speed=1897rpm, Feed= 45mmlmin and tool type is HSS+A1TiN
REFERENCES
[1] S.V. Prasad, “Aluminium metal matrix composites for automotive applications: tribological considerations”, Tribology Letters, Vol. 17, No.3, October 2004.
[2] G.B. Veeresh Kumar, “Studies on Al6061 -SiC and Al7075-Al2O3 Metal Matrix Composites”, Journal of Minerals and Materials Characterization
& Engineering, Vol. 9, No.1, pp.43 -55, 2010.
[3] Sanjeev Kumar and Vikramjeet Sharma, “Effects of Thermal Cyclic Loading on Cast Aluminium Composite Reinforced with Silicon Carbide and Fly Ash Particles”, M.E.Thesis, Thapar University, Patiala, India, July 2010 .
[4] Vishal Sharma and Sanjeev Das, “Synthesis and Interfacial Characterization of Al 4.5wt% /Cu /Zircon Sand /Silicon Carbide Hybrid Composite”, Department of Physics and Material Sciences, M.E.Thesis, Thapar University, Patiala, India, June 200 7.
[5] Sanjeev Das, Siddhartha Das, Karabi Das, “Abrasive Wear of Zircon Sand Alumina Reinforced Al4.5wt% Cu Alloy Matrix Composites – A Comparative Study”, Journal of Science Direct, pp 746 -751, June 2006.
[6] Lin W. S., Lee B. Y., Wu C. L., (2001), "Modeling the surface roughness and cutting force for turning", Journal of Materials Processing Technology, Volume 108, pp. 286-293.
[7] Feng C. X. (Jack) and Wang X., (2002), "Development of Empirical Models for Surface Roughness Prediction in Finish Turning", International Journal of Advanced Manufacturing Technology, Volume 20, pp. 348-356.
[8] Suresh P. V. S., Rao P. V. and Deshmukh S. G., (2002), "A genetic algorithmic approach for optimization of surface roughness prediction model", International Journal of Machine Tools and Manufacture, Volume 42, pp. 675-680.
[9] Choudhury S. K. and Bartarya G., (2003), "Role of temperature and surface finish in predicting tool wear using neural network and design of experiments", International Journal of Machine Tools and Manufacture, Volume 43, pp. 747-753.
[10] Chien W.-T. and Tsai C.-S., (2003), "The investigation on the prediction of tool wear and the determination of optimum cutting conditions in machining 17-4PH stainless steel", Journal of Materials Processing Technology, Volume 140, pp. 340-345.