5
X
October 2017
Fuzzy Logic Based Fault Classification Scheme for
Digital Distance Protection
Khushboo Sahu1, Dr. (Mrs.) Supriya Tripathi2
1, 2
Electrical Department, Bhilai Institute of Technology Durg, Chhattisgarh, INDIA
Abstract-In this paper, a fuzzy logic-based fault classification scheme for transmission lines is proposed. The classification procedure is carried out by only post fault current phasor of three phases of the transmission line. The proposed technique is able to classify all the possible types of faults including single-phase to ground, two-phases, two-phases to ground and three-phase faults with high accuracy. In addition, this method can identify the faulted three-phase(s) from non-faulted three-phase(s). The proposed method has a good performance in high fault resistances, and high fault distances from relaying point. Large numbers of test cases are generated to verify the performance of proposed technique. The simulation studies have been carried out by using MATLAB/SIMULINK. Sim Power Systems and Fuzzy Logic Toolbox have been used from MATLAB.
Keywords-Transmission line, Discrete Fourier transform (DFT), Fuzzy logic system (FLS), Fault detection (FD), Fault classification (FC), Fault inception angle (FIA).
I. INTRODUCTION
Along with other electrical components, the transmission line suffers from the unexpected failures due to various faults. Protecting of transmission lines is most important task to safeguard electric power systems. For safe operation of transmission line systems, the protection systems should be able to detect, classify, locate accurately and clear the fault as fast as possible to maintain stability in the network. The protective systems are required to prevent the propagation of these faults in the system. The occurrence of any transmission line faults gives rise to the transient condition which may lead to the instability of the system. The purpose of a protective relaying system is to detect all theabnormal signals indicating faults on a transmission system. After detection of the fault, the faulted part should be isolated from the rest of the system to prevent the fault propagation into healthy parts.Transmission line relaying involves three major tasks: fault detection, fault classification and fault location. Fast detection of a transmission line fault enables quick isolation of the faulty line from service and protects it from the transient effects of the fault.
Recent protection schemes are based on artificial intelligence (AI) based systems such as artificial neural network (ANN), neuro-fuzzy and neuro-fuzzy logic approaches. Fast and high accurate classification of occurred faults with high reliability is necessary for these techniques because recent fault distance protection schemes utilize the results obtained from fault classification. For example, in ANN-based fault location [1]-[4] and distance protection [5]-[7], the fault classifier performs an important role for enabling the corresponding ANN. Also, the accuracy of fuzzy and fuzzy neural-network-based fault location approaches is highly dependent on the fault classifier operation [8]-[11].
In addition to fault distance location, the ANN and Fuzzy Logic based schemes are also usable in fault classification successfully. The ANN-based approaches are quite accurate in estimating the correct fault type, however, the entire fault and operating conditions such as fault resistance (Rf), fault inception angle (FIA), fault location, system pre-fault load, etc. must be trained for a good performance. Also, ANN has the shortcoming of implicit knowledge representation. On the other hand, the key benefit of fuzzy logic is that the representation of its knowledge is explicit, using simple “If-Then” relations. Also, the fuzzy logic systems are subjective and heuristic and in comparison with ANN, fuzzy-logic techniques can be the simpler and faster methods for planning the fault classifier.
In [8], only the LG (phase to ground) and LLG (two phasesto ground) faults are classified, but the type of fault has notbeen determined. Also, in [1]-[7], [9] and [10] only the natureof the fault (i.e., whether LG, LL, LLG, or symmetrical) hasbeen determined. In [11], all ten types of possible shortcircuitfaults (i.e., a-g, b-g, c-g, a-b, b-c, c-a, a-b-g, b-c-g, c-ag,a-b-c/a-b-c-g) have been determined by using only themagnitude and phase angle of three phase currents.Unfortunately, the proposed fuzzy based strategy in [11] hassome restrictions such as classification errors in high systemloading level, high distances from relaying point and highfault resistance.
especially at high distances from relaying point and high fault resistance. Thisprotection algorithm is an accurate method for faultclassification of transmission lines which uses only amplitude of current signals from sending end side considering the effects of variation in fault resistance, fault location, and fault inception angle. Different offline fault cases have been simulated toinvestigate its performance in terms of accuracy and robustness.
II. POWER SYSTEM NETWORK SIMULATION
A. The System Studied
[image:3.612.195.446.237.321.2]A 220 kV, 50Hz transmission line system has been used to develop and implement the proposed strategy using fuzzy logic. Fig. 1 shows a single-line diagram of the system studied. The system consists of two sources of 220 kV each located on either ends of the transmission line along with a three phase fault simulator which is used to simulate faults at various positions on the transmission line. The studied network has been simulated using Simulink and SimPowerSystem toolbox of MATLAB.
Figure 1: Single line diagram of simulated power system network
III. FAULT CLASSIFICATION SCHEME
A. Fault Classification Strategy
The fault classification technique has been developed on the basis of extensive simulation studies carried out on the power system model shown in Fig. 1using MATLAB. Post-fault samples of three phase currents are considered for fault classification. Using these fault data the task of fault classification is carried out. The magnitudes of each fundamental current signals recorded at the relay location are evaluated by using discrete Fourier transform and the magnitudes of these current signals are used to calculate the characteristic features which will be the input for FLS. The fault classification algorithm is based on the angular differences among the sequence components of the fundamental fault current as well as on the fundamental magnitudes of phase currents. The
characteristic features are calculated in terms of∆1, ∆2, ∆3 and ∆4 from the fundamental current magnitudes of the phase currents
and the characteristic features are calculated in terms ofang_A, ang_B, and ang_Cwhich are angular difference among the sequence components of the fundamental fault currents. These characteristics features are calculated as described below.
B. Characteristics Features Calculations using Current Magnitudes
From three First of all, from the post-fault current samples the ratios R1,R2 and R3are calculated as follows:
R1= max {abs (Ia)} / max {abs (Ib)}R2= max {abs (Ib)} / max {abs (Ic)} R3= max {abs (Ic)} / max {abs (Ia)}
where Ia, Ib, Ic are the post-fault samples of the three phase currents. Next, the normalized values of R1,R2 and R3 are found out as
follows:
R1n= R1/ max (R1,R2, R3) R2n = R2/ max (R1,R2, R3) R3n = R3 / max (R1,R2, R3)
Finally, the differences of these normalized values are found out as follows.
Δ1= R1n− R2n Δ2 = R2n− R3n Δ3 = R3n− R1n
To indicate the presence of ground in the fault the zero sequence current has been used to calculate ∆4. The zero sequence current
samples ar calculated as:
=1
3( + + )
When I0 value exceeds the threshold value, it indicates that a fault involving ground has occurred otherwise a line-to-line fault not
involving ground has occurred. Now ∆4 is calculated as,
Δ4= max {abs (Io)}
C. Characteristics Features Calculations using Sequence Currents
For an example, when a phase-a-to-ground bolted fault occurs in an unloaded system, the phasor diagram of sequence components of fault currents is shown in Fig. 2.
2: Phasor diagram for a-g fault
In figure 4.2, the positive and negative sequence components of the post fault currents relative to phase “a” are denoted as Ia1f and
Ia2frespectively. Similarly, the sequence components for phases “b” and “c” are denoted as Ib1f, Ib2f and Ic1f and Ic2f respectively.
The symbol “a” is a complex operator whose value is . . From Fig. 2, the angles between the positive and negative
sequence components of phase a, b, and c are given below.
ang_A = |ang(Ia1f) – ang(Ia2f)| = 0° ang_B = |ang(Ib1f) – ang(Ib2f)| = 120° ang_C =|ang(Ic1f) – ang(Ic2f)| = 120°
Similar these relationships can also be written for other type of asymmetrical faults (i.e., b-g, c-g, a-b, b-c, c-a, a-b-g, b-c-g, and c-a-g) and these relations are given in Table 1.
For symmetrical faults, the zero and negative sequence currents do not present in the system. Hence, the angles Ang_A, Ang_B and Ang_C are not defined for this case. Now it is to be noted that the relationships given in Table 1 are only valid for solid faults in an unloaded system. Depending upon the present pre-fault power level, fault resistance, fault location, fault inception angle, etc., the values of these three quantities are going to deviate from their corresponding ideal values (as given in Table 1).To find out the ranges of variations of these three variables with the variation of the operating conditions, a large number of fault studies have been carried out under different combinations of fault resistance, fault location and FIA and the values of these three quantities have been computed for each of these faults. From these data, the mean values of each of these three quantities have been calculated for each specific type of fault and subsequently, these mean values have been rounded to their nearest whole number.
[image:4.612.220.376.126.281.2]For an example, the mean value of the variable has been found to be 26.75, which has been rounded to its nearest whole number (i.e., 30). Similar exercises have been carried out for the other variables also. Now, for subsequent reference, these rounded, nearest whole numbers would be termed as “approximate mean value.” These mean values are given in Table 2.
Table 1: Fundamental Relations for Asymmetrical Faults Table 2: Approximate Mean Values of Different Quantities
Type of Fault Ang_A Ang_B Ang_C
a-g 30° 150° 90°
b-g 90° 30° 150°
c-g 150° 90° 30°
a-b-g 30° 90° 150°
b-c-g 150° 30° 90°
c-a-g 90° 150° 30°
a-b 30° 90° 150°
b-c 150° 30° 90°
c-a 90° 150° 30°
Symmetrical - - -
Type of Fault Ang_A Ang_B Ang_C
a-g 0° 120° 120°
b-g 120° 0° 120°
c-g 120° 120° 0°
a-b-g 60° 60° 180°
b-c-g 180° 60° 60°
c-a-g 60° 180° 60°
a-b 60° 60° 180°
b-c 180° 60° 60°
c-a 60° 180° 60°
Symmetrical - - -
°
[image:4.612.94.578.568.732.2]IV. DEVELOPMENT OF FUZZY LOGIC BASED FAULT CLASSIFIER
A Fuzzy logic system (FLS) uses a collection of fuzzy membership functions and rules, instead of Boolean logic, to reason about data. Basically, a Fuzzy knowledge based system comprises of three parts, namely, Fuzzification, inference rules and Defuzzification which are described in the following sections.
A. Fuzzification
FLS has input variables ∆1, ∆2, ∆3, ∆4, Ang_A, Ang_B and Ang_C. The output variables for FLS are Trip1, Trip2 which are
expressed by u1, and u2 respectively. The linguistic input variables contain two fuzzy subsets: 1) high (H); 2) low (L).The linguistic
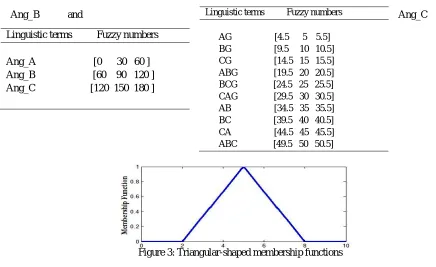
[image:5.612.74.264.272.342.2]output variables contain two fuzzy subsets: 1) Trip high (TH); 2) Trip low (TL). Fuzzy ratings for input and output linguistic terms are shown in Table 3, 4, 5 and 6 respectively. Triangular-shaped membership functions are used for input and output variables as shown in Fig.3. The membership functions are selected on a hit and trial basis with the aim of improving the classification accuracy.
Table 3: Fuzzy Ratings for Input Linguistic Terms ∆1, ∆2, ∆3 Table 4: Fuzzy Ratings for Input Linguistic Terms ∆4
Table 5: Fuzzy Ratings for Input Linguistic Terms Ang_A, Table 6: Fuzzy Ratings for Output Linguistic
Terms
[image:5.612.316.505.273.342.2]Ang_B and Ang_C
Figure 3: Triangular-shaped membership functions
B. Fuzzy Inference Rules
To ensure the change trends of output variables, based on a set of extensive simulation, the rules of fuzzy knowledge based systems are given in Table 7. The output membership function of each rule is calculated by the MAX–MIN method proposed in the relative. 1) If Δ1 is high & Δ2 is medium & Δ3 is low & Δ4 is high &Ang_A is aprx30° & Ang_B is aprx150° & Ang_c is aprx90° then
fault type is “a-g”.
Linguistic terms Fuzzy numbers
low [-1 -0.45 0.1 ] medium [0 0.15 0.32 ] high [ 0.28 0.6 1 ]
Linguistic terms Fuzzy numbers
low [0 0.05 0.1 ] high [0.15 5.5 10 ]
Linguistic terms Fuzzy numbers
AG [4.5 5 5.5] BG [9.5 10 10.5] CG [14.5 15 15.5] ABG [19.5 20 20.5] BCG [24.5 25 25.5] CAG [29.5 30 30.5] AB [34.5 35 35.5] BC [39.5 40 40.5] CA [44.5 45 45.5] ABC [49.5 50 50.5]
Linguistic terms Fuzzy numbers
[image:5.612.66.502.399.666.2]2) If Δ1 is low & Δ2 is high & Δ3 is medium & Δ4 is high & Ang_A is aprx90° & Ang_B is aprx30° & Ang_c is aprx150° then fault type is “b-g”.
3) If Δ1 is medium & Δ2 is low & Δ3 is high & Δ4 is high & Ang_A is aprx150° & Ang_B is aprx90° & Ang_c is aprx30° then fault type is “c-g”.
4) If Δ1 is low & Δ2 is high & Δ3 is low & Δ4 is high & Ang_A is aprx30° & Ang_B is aprx90° & Ang_c is aprx150° then fault type is “a-b-g”.
5) If Δ1 is low & Δ2 is low & Δ3 is high & Δ4 is high & Ang_A is aprx150° & Ang_B is aprx30° & Ang_c is aprx90° then fault type is “b-c-g”.
6) If Δ1 is high & Δ2 is low & Δ3 is low & Δ4 is high & Ang_A is aprx90° & Ang_B is aprx150° & Ang_c is aprx30° then fault type is “c-a-g”.
7) If Δ1 is low & Δ2 is high & Δ3 is low & Δ4 is low & Ang_A is aprx30° & Ang_B is aprx90° & Ang_c is aprx150° then fault type is “a-b”.
8) If Δ1 is low & Δ2 is low & Δ3 is high & Δ4 is low & Ang_A is aprx150° & Ang_B is aprx30° & Ang_c is aprx90° then fault type is “b-c”.
9) If Δ1 is high & Δ2 is low & Δ3 is low & Δ4 is low & Ang_A is aprx90° & Ang_B is aprx150° & Ang_c is aprx30° then fault type is “c-a”.
10) If Δ1 is medium & Δ2 is medium & Δ3 is low & Δ4 is low & Ang_A is none & Ang_B is none & Ang_c is none then fault type is “a-b-c”.
11) If Δ1 is medium & Δ2 is low & Δ3 is medium & Δ4 is low & Ang_A is none & Ang_B is none & Ang_c is none then fault type is “a-b-c”.
12) If Δ1 is low & Δ2 is medium & Δ3 is medium & Δ4 is low & Ang_A is none & Ang_B is none & Ang_c is none then fault type is “a-b-c”.
13) If Δ1 is medium & Δ2 is low & Δ3 is low &Δ4 is low & Ang_A is none & Ang_B is none & Ang_c is none then fault type is “a-b-c”.
14) If Δ1 is low & Δ2 is medium & Δ3 is low & Δ4 is low & Ang_A is none & Ang_B is none & Ang_c is none then fault type is “a-b-c”.
15) If Δ1 is low & Δ2 is low & Δ3 is medium & Δ4 is low & Ang_A is none & Ang_B is none & Ang_c is none then fault type is “a-b-c”.
A “Mamdani” type of Fuzzy Inference System (FIS) was utilized for taking the crisp output of the fault type. To implement the fuzzy inference system, the “min” and “max” operators were used for “and”, “implication” and “aggregation” methods, respectively. The “centroid” defuzzification method was used to defuzzify the output of the fuzzy inference system [15].
V. RESULTS OF FUZZY LOGIC BASED FAULT CLASSIFIER
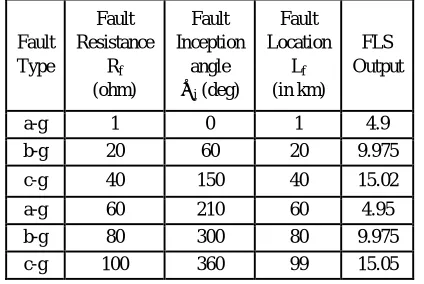
[image:6.612.199.411.582.724.2]Simulation of three phase transmission line model has been done at different fault location, fault resistance and fault inception angle for all phase to phase and phase to ground faults to verify the performance of the fuzzy logic based fault classifier. The simulation test result of all possible types of shunt faults (LG, LLG, LL and LLL) are given in Table 7, 8, 9 and 10.
Table 7: Simulation Result of Fuzzy Logic Based Fault Classifier for LG Faults
Fault Type Fault Resistance Rf (ohm) Fault Inception angle
Φi (deg)
Fault Location Lf (in km) FLS Output
a-g 1 0 1 4.9
b-g 20 60 20 9.975
c-g 40 150 40 15.02
a-g 60 210 60 4.95
b-g 80 300 80 9.975
Table 8: Simulation Result of Fuzzy Logic Based Fault Classifier for LLG Faults
Table 9: Simulation Result of Fuzzy Logic Based Fault Classifier for LL Faults
Table 10: Simulation ResultFuzzyLogic Based Fault Classifier for LLL Faults
From the test results given in Table 7-10, it is clear that the Fuzzy Logic based Fault Classifier is able to classify the fault accurately. Thus, even the extreme fault case of high impedance fault near the far end of the line is classified correctly by the developed Fuzzy Logic based Fault Classifier.
VI. CONCLUSIONS
An accurate fault classification technique using fuzzy logic system has been proposed, which can be implemented for the digital protection of the power transmission line. The proposed protection technique requires the consideration of the three phase post fault current samples at one end of line only. The fault classification algorithm is based on the angular differences among the sequence components of the fundamental fault current as well as on the relative magnitudes of fundamental phase current. This features calculated are given as input to the fuzzy logic system for fault classification. Fuzzy rule bases for classifying faults involving ground and faults not involving ground have been developed. The appropriate rule base is selected for fault classification, on the basis of whether the fault involves ground or not. Simulation studies carried out considering wide variations in fault resistance, fault inception angle and fault location for different types of fault have proved the validity of the proposed approach.The simulation results obtained with the proposed protection scheme confirm the reliability and suitability of the proposed technique under different
Fault Type Fault Resistance Rf (ohm) Fault Inception angle
Φi (deg)
Fault Location Lf (in km) FLS Output
a-b-g 1 0 1 19.95
b-c-g 20 60 20 24.97
c-a-g 40 150 40 30.01
a-b-g 60 210 60 19.95
b-c-g 80 300 80 24.92
c-a-g 100 360 99 30.1
Fault Type Fault Resistance Rf (ohm) Fault Inception angle
Φi (deg)
Fault Location Lf (in km) FLS Output
a-b 0.01 0 1 35
b-c 0.01 60 20 40
c-a 0.01 150 40 45
a-b 0.01 210 60 35
b-c 0.01 300 80 40
c-a 0.01 360 99 45
Fault Type Fault Resistance Rf (ohm) Fault Inception angle Φi (deg) Fault Location Lf (in km) FLS Output
a-b-c 0.01 0 1 50
a-b-c 0.01 30 20 50
a-b-c 0.01 150 40 50
a-b-c 0.01 210 60 50
a-b-c 0.01 210 80 50
[image:7.612.204.406.411.549.2]fault situations. Thus, the proposed technique can be applied as an independent protection scheme or as a supplement to existing protection schemes.
VII. ACKNOWLEDGMENT
I would like to sincerely thank Mr., Assistant Professor (Dept. of Electrical Engg.) who provided expertise that greatly assisted the research work.
REFERENCES
[1] R. N. Mahanty, and P. B. Dutta Gupta, “Application of RBF neural network to fault classification and location in transmission lines”, IEE Proc.-Gener. Transm.
Distrib., vol. 151, no. 2, pp. 201-212, March 2004.
[2] D. Thukaram, H. P. Khincha and H. P. Vijaynarasimha, “Artificial neural network and support vector machine approach for locating faults in radial distribution
system,” IEEE Trans. on Power Delivery, vol. 20, no. 2, pp. 710-720, April 2005.
[3] J. Gracia, A. J. Mazon, and I. Zamora, “Best ANN structures for fault location in single-and double-circuit transmission lines”, IEEE Trans. on Power Delivery,
vol. 20, no. 4, pp. 2389-2395, Oct. 2005.
[4] M. Tarafdar Hagh, K. Razi, and G. Ahrabian “Fault classification and location of transmission lines using artificial neural network,” The 8th International Power
Engineering Conference – IPEC 2007, pp. 1541- 1546, 3-6 Dec. 2007.
[5] P.K. Dash, A.K. Pradhan, and G. Panda, “Application of minimal radial basis function neural network to distance protection”, IEEE Trans .on Power Deliv.,
vol, 16, no.1, pp. 68–74, 2001.
[6] A.K. Pradhan, P.K. Dash, and G. Panda “A fast and accurate distance relaying scheme using an efficient radial basis function neural network,” Electric Power
Systems Research, pp. 1–8, 2001.
[7] Sanaye-Pasand, M.; Khorashadi-Zadeh; "An extended ANN-based high speed accurate distance protection algorithm," Electrical Power and Energy Systems,
pp. 387–395, 2006.
[8] A. Ferrero, S. Sangiovanni, and E. Zapitelli, “A fuzzy set approach to fault type identification in digital relaying,” IEEE Trans. on Power Delivery, vol. 10, pp.
169–175, Jan. 1995.
[9] H.Wang andW.W. L. Keerthipala, “Fuzzy neuro approach to fault classification for transmission line protection,” IEEE Trans. on Power Delivery, vol. 13, pp.
1093–1104, Oct. 1998.
[10] P. K. Dash, A. K. Pradhan, and G. Panda, “A Novel Fuzzy Neural Network Based Distance Relaying Scheme,” IEEE Trans. on Power Delivery, vol. 15, no. 3,
July 2000.
[11] Biswarup Das, and J. Vittal Reddy, “Fuzzy-logic-based fault classification scheme for digital distance protection,” IEEE Trans. On Power Delivery, vol. 20, no.
2, pp. 609-616, April 2005.
[12] R.N.Mahanty and P.B.Gupta,2007,” A fuzzy logic based fault classification approach using current samples only”, Electric Power Systems Research 77 ,pp 501–507.
[13] PSCAD/EMTDC Version 4.01, Manitoba HVDC Research Center, Winnipeg, Manitoba, Canada.
[14] MatLab, Natick, MA: The MathWorks.