Expansion of Liquid
4He Through the Lambda
Transition
M.E. Dodd, P.C. Hendry, N.S. Lawson, P.V.E. McClintock and C.D.H. Williams∗
Department of Physics, Lancaster University, LA1 4YB, UK
∗School of Physics, University of Exeter, EX4 4QL, UK
Zurek suggested (Nature317, 505; 1985) that the Kibble mechanism, through which topological defects such as cosmic strings are believed to have been cre-ated in the early Universe, can also result in the formation of topological de-fects in liquid4He, i.e. quantised vortices, during rapid quenches through the
superfluid transition. Preliminary experiments (Hendry et al, Nature 368, 315; 1994) seemed to support this idea in that the quenches produced the pre-dicted high vortex-densities. The present paper describes a new experiment incorporating a redesigned expansion cell that minimises vortex creation aris-ing from conventional hydrodynamic flow. The post-quench line-densities of vorticity produced by the new cell are no more than 1010m−2, a value that is at least two orders-of-magnitude less than the theoretical prediction. We conclude that most of the vortices detected in the original experiment must have been created through conventional flow processes.
PACS numbers: 11.27.+d, 05.70.Fh, 11.10.Wx, 67.40.Vs
1. INTRODUCTION
After a physical system has passed rapidly through a continuous phase-transition, its order-parameter can have components with large differences between adjacent, but causally disconnected, “domains”. In such systems topological defects can form at the domain boundaries.1 This idea was
proposed by Kibble2 in connection with the grand unified theory (GUT)
depends on the rate at which the system passes through the transition. Zurek also pointed out that this mechanism of defect production was applicable, in principle, to all continuous phase-transitions, and that it should there-fore be possible to validate some aspects of cosmological theories through laboratory-scale experiments. The first of these examined weakly first-order phase-transitions in liquid crystals.6, 7 Later, the corresponding experiments
were carried out using the second-order superfluid phase-transitions of liq-uid4He8 and liquid3He.9, 10 All these experiments produced defect densities
reported as being consistent with Zurek’s estimates.3–5
In this paper we describe an improved version of the 4He experiment8
in which particular care has been taken to minimise the production of topo-logical defects (i.e. quantised vortices) by ordinary hydrodynamic flow pro-cesses. Our new results, of which a preliminary report11 has already been
published, show no convincing evidence of any vortex creation at all. But they allow us to place an approximate upper-bound on the initial density of vortices produced by the Kibble-Zurek mechanism.
2. THEORETICAL BACKGROUND
A considerable amount is known about the properties12–15 of vortices,
and about how they are created at very low temperatures16–18but the
mech-anism responsible for the vorticity that appears19, 8 as a result of passing
through the λ-transition (which separates the normal helium-I and the su-perfluid helium-II phases) is not understood. One possibility is that pre-existing rotational flow caused by e.g. convection or boiling in the helium-I phase is, with the onset of long-range order, converted into quantised vortex lines in helium-II; this is quite distinct from the Zurek scenario which we shall now briefly describe.
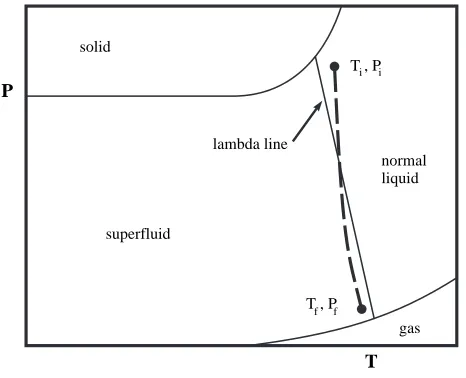
The underlying idea3 is quite simple. A small isolated volume of helium-I is initially held at pressure Pi, and temperature Ti, just above
the temperature Tλ(Pi) of the λ-transition. The logarithmic infinity in its
heat capacity atTλ makes it impossible tocool the sample quickly into the
superfluid phase but the pressure dependence of Tλ means that it can be
taken through the transition very rapidly by adiabatic expansion into the helium-II phase, to a final pressurePf and temperature Tf (Fig 1).
The analogy3–5 between liquid helium and the early Universe arises
because they both be considered to undergo second-order phase transitions describable in terms of Ginsburg-Landau theory.20 In each case the potential
contribution to the free-energy density can be written as:
V =α(T)|ψ|2+1
2β|ψ|
4 (1)
where the parameterαis positive at temperatures aboveTλand negative
be-low it, andβis a constant. For liquid4He the order-parameter is the modulus
of the complex-scalar field ψ, i.e. the Bose condensate wave-function which is a solution of the Ginsburg-Pitaevskii equation.20 In the cosmological
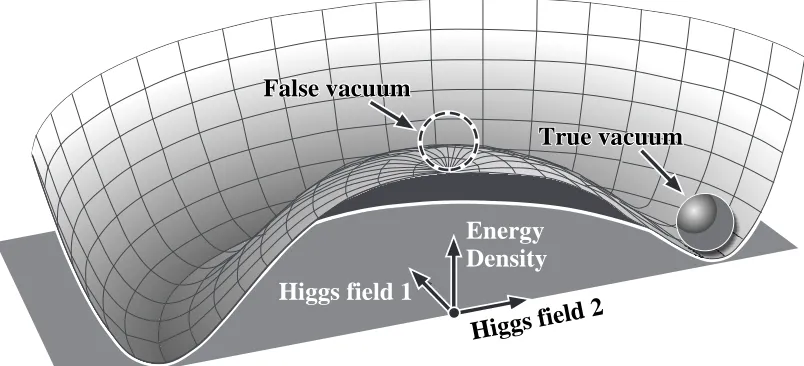
anal-ogy the components of ψ are Higgs fields.4, 5 In the symmetric (helium-I)
phase T > Tλ and the time-average of the order-parameter hψi = 0.
Be-low Tλ this gauge symmetry, is broken so hψi becomes non-zero, and the
real and imaginary parts of the potential in equation 1 acquire the same “sombrero” shape as the corresponding cosmological free energy expressed in terms of Higgs fields (Fig. 2). In the early Universe a symmetry-breaking phase-transition from a false-vacuum state to a true-vacuum state is thought to have occurred once the temperature had fallen to∼1027K, about 10−35s
after the big bang. Although there are many variants of the basic model, with and without inflation, it is believed that a variety of topological defects2
would have been produced in the transition because an event horizon pre-vented adjacent regions from being causally connected. Cosmic strings21 —
thin tubes of false vacuum — are one such defect and may have had a role in galaxy formation. It is these that correspond to the quantised vortices found in helium-II. The analogy between the helium and cosmological phase transitions may thus be summarised as follows –
Higgs field 1 ←→ Re ψ
Higgs field 2 ←→ Imψ
False vacuum ←→ He I True vacuum ←→ He II
Cosmic string ←→ quantized vortex line
3. DETECTING VORTICITY
In our initial experiments,8, 23 the vortex density was measured by
A considerable amount is known about the decay13–15, 24 of
hydrody-namically created vortex tangles in helium-II. Numerical simulations24, 25
give a good qualitative description of the manner in which a homogeneous isotropic tangle evolves and decays. The rate at which it occurs in this temperature range is governed by the Vinen14 equation
dL
dt =−χ2
¯
h m4
L2 (2)
whereLis the vortex-line density at timet, the4He atomic mass ism4, and
χ2 is a dimensionless parameter. The relationship between vortex density
and second-sound attenuation is known15 from experiments with rotating
helium, and may for present purposes be written
L= 6c2
κBdln(S0/S) (3)
wherec2 is the velocity of second-sound,S and S0 are the signal amplitudes
with and without vortices present respectively. B is a weakly temperature dependent parameter, κ=h/m4 is the quantum of circulation, anddis the
transducer separation. Integrating equation 2 and substituting for L from equation 3 gives an expression for the recovery of the signal:
1 ln(S0)−ln(S)
= 6c2
κBd χ
2κt
2π +
1
L1
(4)
where L1 is the vortex density immediately after the expansion. All the
constants in this expression are known, although χ2 and B do not seem to
have been measured accurately within the temperature range of interest.
4. THE FIRST EXPERIMENT
A description of our first attempt to realise a bulk version4 of Zurek’s
experiment has been given in a previous paper23but, briefly, the arrangement
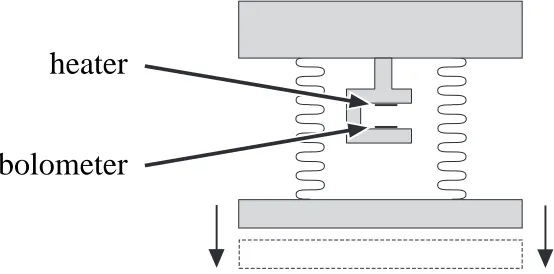
was as follows. A cell with phosphor-bronze concertina walls was filled, by condensing in isotopically26 pure 4He through a capillary tube, and then
sealed with a needle-valve (Fig. 3). The top of the cell was fixed rigidly to the cryostat but its bottom surface could be moved to compress the liquid, or released to expand it, using a pull-rod from the top of the cryostat. The cell was in vacuo surrounded by a reservoir of liquid 4He at ∼ 2 K. A
Straty-Adams capacitance gauge27 recorded the pressure in the cell and
the mechanical linkage allowed the cell to increase its volume by∼20% very rapidly under the influence of its own internal pressure.
As described above, the vortex density was inferred from the amplitude of second-sound pulses created with a thin-film heater. The signal was de-tected with a bolometer and passed, viaa cryogenic FET preamplifier, to a Nicolet 1280 data processor which recorded some ∼200 pulses during 1–2 s following the expansion. The last pulses in the sequence defineS0, the signal
amplitude in the (virtual) absence of vortices.28 Fig. 4 shows examples of
data recorded with this first version of the experiment.
There was a “dead period” of about 50 ms after the mechanical shock of the expansion which caused vibrations that obscured the signals. The ini-tial vortex-density was therefore obtained from plots such as Fig. ??(a) by back-extrapolation to the momentt= 0 of traversing the transition and was found to be∼1012−1013m−2consistent with the theoretical expectation.3–5
However, an unexpected observation in these initial experiments8 was that
small densities of vortices were created even for expansions that occurred wholly in the superfluid phase (Fig. 4c), provided that the starting point was very close to Tλ. The phenomenon was initially23 attributed to
vor-tices produced in thermal fluctuations within the critical regime, but it was pointed out29 that effects of this kind are only to be expected for expansions
starting within a few microkelvin of the transition,i.e. much closer than the typical experimental value of a few millikelvin. The most plausible interpre-tation — that the vortices in question were of conventional hydrodynamic origin, arising from non-idealities in the design of the expansion chamber — was disturbing, because expansions starting above Tλ traverse the same
region. Thus some, at least, of the vortices seen in expansions through the transition were probably not attributable to the Zurek-Kibble mechanism as had been assumed. It has been of particular importance, therefore, to undertake a new experiment with as many as possible of the non-idealities in the original design eliminated or minimised.
5. THE NEW EXPERIMENT
vor-ticity. However, the period during which this happens is very short; the entire expansion takes only a few milliseconds so only limited growth can occur from the surface-vorticity sheet of half-vortex-rings.30
With hindsight, we can identify the principal causes of unintended vor-tex creation in the original experiment,8, 23 in order of importance, as follows:
(a) expansion of liquid into the cell from the filling capillary, which was closed by a needle valve 0.5 m up-stream; (b) expansion of liquid out of a shorter capillary connecting the cell to the Straty-Adams capacitive pressure-gauge; (c) flow out of and past the fixed yoke (a U-shaped structure) on which the second-sound transducers were mounted. In addition, (d) there were the undesirable transients caused by the expansion system bouncing against the mechanical stop at room temperature. The walls of the cell were made from bronze bellows,8, 23 rather than being a stretchy cylinder, but the effects of
the flow parallel to the convoluted surfaces were relatively small.
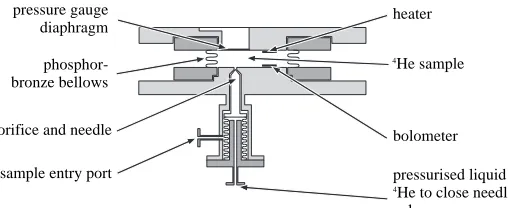
The design of our new expansion cell (Fig. 5) addressed all the listed problems, as follows: (a) a hydraulically-operated needle-valve eliminated the dead-volume of capillary tube; (b) the phosphor-bronze diaphragm of the pressure gauge27 became an integral part of the upper cell-wall eliminating
the long tube leading to the pressure gauge; (c) the cell was shortened from 25mm to∼5mm so that the heater-bolometer pair could be mounted flush with its top and bottom inner surfaces, thereby eliminating any need for a yoke; (d) some damping of the expansion was provided by the addition of a (light motor-vehicle) hydraulic shock-absorber.
The operation of the apparatus, the technique of data collection and analysis were much as described previously8, 23except that the rate at which
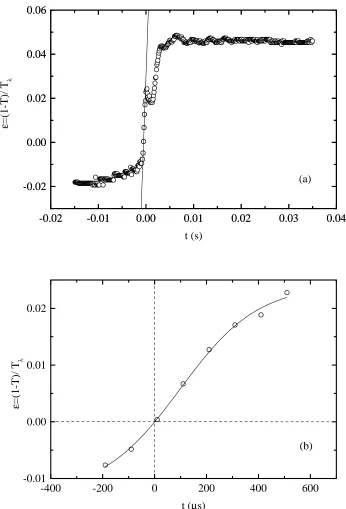
the sample passed through theλ-transition was determined directly by simul-taneous measurements of the position31of the pull-rod (giving the volume of the cell, and hence its pressure) and the temperature of the cell. We define the dimensionless distance from the transition by
ǫ= Tλ−T
Tλ
(5)
and the quench timeτq by
1 τq = dǫ dt ǫ=0 (6)
The quench time is readily determined fromǫ(t) near the transition. In the case illustrated in Fig. 6, shown in expanded form in part (b), it was
τq= 17±1 ms. We are thus able take both the pressure-dependence of Tλ,
and the non-constant rate of expansion, explicitly into account.
6. RESULTS FROM THE NEW CELL
The improvements in the cell-design intended to eliminate vortices orig-inating from conventional fluid-flow were clearly successful; as we had hoped, and unlike the first cell, expansion trajectories that stay within the super-fluid phase, even those starting as close as 42 mK to the transition, create no detectable vorticity (Fig. 7).
We were surprised, however, to discover that no detectable vorticity was created even when the expansion trajectory passed through the transition. Signal amplitudes measured just after two such expansions are shown by the data points of Fig. 8. It is immediately evident that, unlike the results obtained from the original cell,8 there is now no evidence of any systematic
growth of the signal amplitude with time or, correspondingly, for the creation of any vortices at the transition. One possible reason is that the density of vortices created is smaller than the theoretical estimates,3–5 but we must
also consider the possibility that they are decaying faster than they can be measured.
7. THE DECAY OF A VORTEX TANGLE
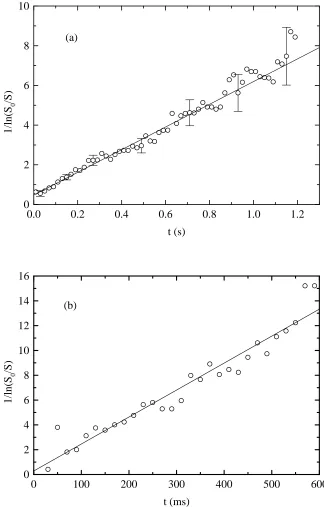
To try to clarify matters, we performed a subsidiary set of experiments, deliberately creating vortices by conventional means and then following their decay by measurements of the recovery of the second-sound signal amplitude. By leaving the needle-valve open, so that∼0.2 cm3 of liquid from the dead volume outside the needle-valve actuator-bellows squirted into the cell during an expansion, we could create large densities of vorticity and observe their decay. Despite the highly non-equilibrium situation that arises immediately following the expansion, as liquid squirts into the cell, it was found that the temperature reached a steady value after∼6 ms. Fig. 9 shows two examples of attenuation plots ([ln(S/S0)]−1 against time t) and these always, within
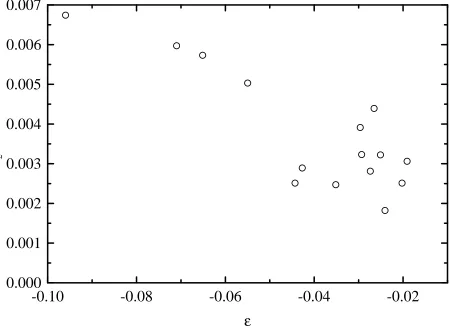
the experimental errors, had the linear form predicted by equation 4. Fig. 10 summarises the results of a number of expansions from which it was possible to determine χ2/B as a function of temperature and pressure. We found
thatχ2/Bwas weakly temperature-dependent and over the range of interest,
0.02< ǫ <0.06 it could be approximated by χ2/B= 0.004±0.001.
S/S0 with time for different values of L1, assuming B = 1, yielding the
curves shown in Fig. 8. From the τq derived from the gradient in Fig 6, and
Zurek’s estimate (based on renormalisation-group theory) of
LRG=
L0
(τq/τ0)2/3
where L0 = 1.2×10¹²m−2, τ0= 100 ms (7)
we are thus led to expect that L1 ≈4×10¹²m2. Direct comparison of the
calculated curves and measured data in Fig. 11 shows that this is plainly not the case. In fact, the data suggest that L1, the vorticity created by the
transition, is no more than 1010m−2, smaller than the expected value by at
least two orders-of-magnitude.
8. DISCUSSION
Given the apparently positive outcome of the earlier investigations,8
the null result of the present experiment has come as something of a sur-prise. There are several points to be made. First, Zurek did not expect his estimates of L1 be accurate to better than one, or possibly two,
orders-of-magnitude, and his more recent estimate32 suggests somewhat lower
defect-densities. So it remains possible that his picture3–5, 32 is correct for 4He in
all essential details, and that an improved experiment with faster expansions now being planned will reveal evidence of the Kibble-Zurek mechanism at work in liquid 4He. Secondly, it must be borne in mind that (2), and the
value of χ/B measured (from plots like those in Fig. 10) from the data of Fig. 9, refer to hydrodynamically generated vortex lines. Vorticity gener-ated in the nonequilibrium phase transition might perhaps be significantly different, e.g. in respect of its loop-size distribution.33 It could therefore
decay faster, and might consequently be unobservable in the present exper-iments. Thirdly, it is surprising to us that the 3He experiments9, 10 seem
to agree with Zurek’s original estimates3–5 whereas the present experiment
shows that they overstate L1 by at least two orders-of-magnitude. It is not
yet known for sure why this should be, although an interesting explanation of the apparent discrepancy has recently been suggested34 by Karra and
Rivers. They suggest that fluctuations near to Tλ may change the winding
number, i.e. reduce the density of vortices produced in the 4He experiment,
ACKNOWLEDGMENTS
We acknowledge valuable discussions or correspondence with S.N. Fisher, A.J. Gill, R.A.M. Lee, R.J. Rivers, W.F. Vinen G.A. Williams and W.H. Zurek. The work was supported by the Engineering and Physical Sci-ences Research Council (U.K.), the European Commission and the European Science Foundation.
REFERENCES
1. A.J. Gill, Contemporary Phys.39, 13 (1998). 2. T.W.B. Kibble,J. Phys. A9, 1387 (1976). 3. W.H. Zurek,Nature317, 505 (1985).
4. W.H. Zurek,Acta Physica Polonica B24, 1301 (1993). 5. W.H. Zurek,Phys. Rep. 276, (1996).
6. I. Chuang, N. Turok and B. Yurke,Phys. Rev. Lett.66, 2472 (1991); I. Chuang, R. Durrer, N. Turok and B. Yurke,Science 251, 1336 (1991). 7. M.J. Bowick, L. Chander, E.A. Schiff and A.M. Srivastava, Science 263, 943
(1994).
8. P.C. Hendry, N.S. Lawson, R.A.M. Lee, P.V.E. McClintock and C.D.H. Williams,Nature368, 315 (1994).
9. C. B¨auerle, Y.M. Bunkov, S.N. Fisher, H. Godfrin and G.R. Pickett, Nature
382, 332 (1996).
10. M.H. Ruutu, V.B. Eltsov, A.J. Gill, T.W.B. Kibble, M. Krusius, Y.G. Makhlin, B. Placais, G.E. Volovik and W. Xu,Nature382, 334 (1996).
11. M.E. Dodd, P.C. Hendry, N.S. Lawson, P.V.E. McClintock and C.D.H. Williams, “Non-appearance of vortices in fast mechanical expansions of liquid
4
He through the lambda transition”, preprint cond-mat/9808117, Phys. Rev. Lett., in press.
12. H.E. Hall and W.F. Vinen,Proc. Roy. Soc. London A238, 204 & 215 (1956). 13. W.F. Vinen,Proc. Roy. Soc. London A240, 114 & 128 (1957).
14. W.F. Vinen,Proc. R. Soc. Lond. A242, 493 (1957).
15. R.J. Donnelly,Quantized Vortices in He II(Cambridge University Press, Cam-bridge, 1991).
16. E. Varoquaux, W. Zimmermann Jr. and O. Avenel, in Excitations in Two-Dimensional and Three-Two-Dimensional Quantum Fluids, ed. A.F.G. Wyatt and H.J. Lauter, Plenum, New York, 1991.
17. C.M. Muirhead, W.F. Vinen and R.J. Donnelly,Phil. Trans. R. Soc. Lond. A
311, 433 (1984).
18. P.C. Hendry, N.S. Lawson, P.V.E. McClintock, C.D.H. Williams and R.M. Bow-ley, Phys. Rev. Lett. 60, 604 (1988); Phil. Trans. R. Soc. Lond. A 332, 387 (1990).
19. D.D. Awshalom and K.W. Schwarz,Phys. Rev. Lett.52, 49 (1984). 20. V.L. Ginsburg and L.P. Pitaevskii,Soviet Phys. JETP 34, 858 (1958).
22. A. Guth and P. Steinhardt, “The inflationary universe”, in The New Physics, ed. P.C.W. Davies (Cambridge University Press, Cambridge, 1989).
23. P.C. Hendry, N.S. Lawson, R.A.M. Lee, P.V.E. McClintock and C.D.H. Williams,J. Low Temp. Physics 93, 1059 (1993).
24. K.W. Schwarz and J.R Rozen,Phys. Rev. Lett.66, 1898 (1991). 25. J. Koplik and H. Levine,Phys. Rev. Lett.71, 1375 (1993). 26. P.C. Hendry and P.V.E. McClintock,Cryogenics27, 131 (1987). 27. G.C. Straty and E.D. Adams,Rev. Sci. Instrum.40, 1393 (1969). 28. M.E. Dodd,Ph.D. Thesis(University of Lancaster, 1998).
29. W.F. Vinen,Creation of Quantized Vortex Rings at theλ-Transition in Liquid Helium-4, unpublished.
30. F.V. Kustmartsev,Phys. Rev. Lett.76, 1880 (1996). 31. R.A.M. Lee,Ph.D. Thesis (University of Lancaster, 1994). 32. P. Laguna and W.H. Zurek,Phys. Rev. Lett.78, 2519 (1997).
33. G.A. Williams, J. Low Temperature Phys.93, 1079 (1993); and “Vortex loop phase transitions in liquid helium, cosmic strings and highTcsuperconductors”,
preprint cond-mat/9807338.
34. G. Karra and R.J. Rivers, “A re-examination of quenches in 4
He(and3
He)”, submitted toPhys. Rev. Lett.(1998).
35. P.C. Hendry, N.S. Lawson, R.A.M. Lee, P.V.E. McClintock and C.D.H. Williams,Physica B 210, 209 (1995).
36. M.E. Dodd, P.C. Hendry, N.S. Lawson, R.A.M. Lee and P.V.E. McClintock, Czech. J. Phys.46, 43 (1996).
P
T superfluid
T , P T , P solid
lambda line
normal liquid
gas
i i
[image:11.595.162.395.389.578.2]f f
Higgs field 1
Energy
Density
True vacuum
False vacuum
Higgs
field
[image:12.595.109.511.390.573.2]2
heater
[image:13.595.141.418.349.486.2]bolometer
0 200 400 600 800 1000 1200 0.0
0.2 0.4 0.6 0.8 1.0
(a)
S/S
ref
t (ms)
0 200 400 600 800 1000 1200
0.0 0.2 0.4 0.6 0.8 1.0 1.2
(b)
S/S
ref
t (ms)
0 200 400 600 800 1000 1200
0.0 0.2 0.4 0.6 0.8 1.0
(c)
S/S
ref
[image:14.595.195.434.135.675.2]t (ms)
Fig. 4. Recovery of the scaled second-sound signal amplitudeS as a function of time t in our original experiment, for various expansion trajectories: (a) through the lambda line, Ti = 1.81 K, Pi = 29.6 bar, Tf = 2.05 K, Pf =
6.9 bar; (b) starting well below the lambda line, Ti = 1.58 K, Pi = 23.0 bar,
Tf = 1.74 K, Pf = 4.0 bar; (c) starting slightly (∼10 mK) below the lambda
4He sample
heater
bolometer
pressurised liquid
4He to close needle
valve pressure gauge
diaphragm
orifice and needle phosphor-bronze bellows
[image:15.595.146.400.424.528.2]sample entry port
-0.02 -0.01 0.00 0.01 0.02 0.03 0.04 -0.02
0.00 0.02 0.04 0.06
-0.02 -0.01 0.00 0.01 0.02 0.03 0.04 -0.02
0.00 0.02 0.04 0.06
(a)
ε
=(1-T)/ T
λ
t (s)
-400 -200 0 200 400 600
-0.01 0.00 0.01 0.02
(b)
ε
=(1-T)/ T
λ
[image:16.595.129.475.171.680.2]t (µs)
0.0 0.5 1.0 1.5 2.0 2.5 0.0 0.2 0.4 0.6 0.8 1.0 1.2 1.4 1.6 (a) S/S 0 t (s)
0.0 0.5 1.0 1.5 2.0 2.5
0.0 0.2 0.4 0.6 0.8 1.0 1.2 1.4 1.6 (b) S/S 0 t (s)
[image:17.595.196.430.144.676.2]0.0 0.2 0.4 0.6 0.8 1.0 1.2 0.0 0.2 0.4 0.6 0.8 1.0 1.2 1.4 1.6 (c) S/S 0 t (s)
Fig. 7. Second-sound pulse amplitudeS/S0 as a function of time following
pressure quenches entirely within the helium-II phase: (a) starting far (∼
490 mK) belowTλ withTi= 1.37 K, Pi= 24.2 bar,Tf = 1.47 K, Pf = 7.2 bar;
(b) starting∼150 mK belowTλwithTi= 1.74 K,Pi= 23.8 bar,Tf = 1.76 K,
Pf = 6.9 bar; (c) starting slightly (∼ 40 mK) below Tλ with Ti = 1.85 K,
0.0 0.5 1.0 1.5 2.0 2.5 0.0
0.2 0.4 0.6 0.8 1.0 1.2
(a)
S/S
0
t (s)
0.0 0.5 1.0 1.5 2.0 2.5
0.0 0.2 0.4 0.6 0.8 1.0 1.2 1.4
(b)
S/S
0
t (s)
0 1 2 3 4 5
0.0 0.2 0.4 0.6 0.8 1.0 1.2
(c)
S/S
0
[image:18.595.195.429.115.671.2]t (s)
Fig. 8. Second-sound pulse amplitude S/S0 as a function of time
follow-ing pressure quenches through the λ transition: (a) starting close to the transition, with Ti = 1.81 K, Pi = 30.3 bar, Tf = 2.03 K, Pf = 6.2 bar
(ǫi = −0.032); (b) starting further above the transition, with Ti = 2.05 K,
Pi= 22.7 bar,Tf = 2.09 K,Pf = 5.9 bar (ǫi =−0.089); (c) starting far above
the transition, with Ti = 1.96 K, Pi = 34.1 bar, Tf = 2.07 K, Pf = 6.1 bar
0.0 0.2 0.4 0.6 0.8 1.0 1.2 0
2 4 6 8 10
(a)
1/ln(S
0
/S)
t (s)
0 100 200 300 400 500 600
0 2 4 6 8 10 12 14 16
(b)
1/ln(S
0
/S)
[image:19.595.146.470.175.682.2]t (ms)
Fig. 9. Plots of (lnS0−lnS)−1 versustime t for hydrodynamically created
-0.10
-0.08
-0.06
-0.04
-0.02
0.000
0.001
0.002
0.003
0.004
0.005
0.006
0.007
χ
2/B
[image:20.595.92.542.289.625.2]ε
Fig. 10. Measured values of the parameterχ2/B as a function of distanceǫ