Munich Personal RePEc Archive
Export performance, competitiveness
and commodity composition
Athanasoglou, Panayiotis and Backinezos, Constantina and
Georgiou, Evangelia
Bank of Greece
May 2010
Online at
https://mpra.ub.uni-muenchen.de/31997/
EXPORT PERFORMANCE, COMPETITIVENESS AND COMMODITY
COMPOSITION
Panayiotis P. Athanasoglou*
Bank of Greece
Constantina Backinezos
Bank of Greece
Evangelia A. Georgiou
Bank of Greece
ABSTRACT
The study of export performance, especially for countries with serious external imbalances, is essential for economic decision-making. This study attempts to evaluate Greek export performance during the 1996-2001 period, using detailed panel data on bilateral trade by product. Factors explaining Greek export market shares are analysed with the method of Constant Market Shares. In addition, the dynamics of the specialization pattern of Greek exports and the effect of price competitiveness on export market shares are examined. The results show a considerable change in export structure, mainly the geographical structure, with a favourable effect on market shares. Although the pattern of comparative advantages and the technological intensity of Greek exports have improved, exports remain concentrated in low- and medium-technology sectors, while product variety and quality have declined. Finally, the results show heterogeneity among the panels. In the aggregate, export market shares are inelastic with respect to relative and absolute prices, which would call for focus on non-price factors to improve competitiveness in international markets. However, elasticities are greater than one for a considerable proportion of commodities.
Keywords: export performance; market shares; New Trade Theory; comparative advantages; Markov matrix; price and non-price competitiveness.
Acknowledgements: The views presented in this paper are personal and do not necessarily reflect the views of the Bank of Greece. We would like to thank Heather Gibson for comments and participants in the Bank of Greece workshop.
JEL classification codes: C22; F12; F14; O14.
*
Correspondence:
Panayiotis P. Athanasoglou, Economic Research Department, Bank of Greece, 21, E. Venizelos Ave., 102 50 Athens, Greece,
Tel. +30210-3202449 Fax +30210-3202696
1.
Introduction
Export performance is an important factor that must be taken into consideration in
economic policy decision making, especially under the current circumstances, with financial
market turmoil already showing detrimental effects on the real sector of the economy. The
study of export performance, in particular for countries like Greece, with serious external
imbalances, might prove crucial for the choice of policies aimed at addressing these
imbalances. In spite of the fact that Greece is a member of the EU and EMU, Greek export
performance cannot be characterized as impressive, since total exports of goods remain low at
about 7.6% of GDP and cover no more than one third of total imports. This picture reflects the
limited competitiveness of Greek products, and their inadequate differentiation and penetration
into foreign markets.
This paper attempts to evaluate Greek export performance during the period
1996-2006. The data used are very detailed in terms of products included and markets covered (279
exported products and 95 countries) and represent approximately 95% of total Greek exports.
As far as we know, this is the first time that Greek export performance has been approached
with such a detailed data set spanning a substantial period of time.
Given the competition that Greek exports - as well as exports of other developed
economies - face in international markets from countries like China, Greek export performance
may be considered rather satisfactory. In the second half of the 90s, the geographic
composition of destination markets for Greek exports demonstrated a significant change. The
share of the South-Eastern European (SE Europe) and Mediterranean-Middle Eastern (MME)
markets in total exports increased. This shift had a favourable effect on Greek market shares. In
addition, the technological intensity of Greek exports improved, as products of medium and
high technology represented an increasing share of total exports. In addition, the change in
commodity specialization of exports occurred mainly in new markets such as those of SE
Europe. However, a further improvement in this direction is necessary, in order to fully exploit
the fast-growing international demand for high-technology products. At the same time, the
structure of exports in terms of product variety and quality is among the main factors
constraining export performance. As far as specialization is concerned, Greek exports remained
focused on low- and medium-technology products during the period under review. In 1996,
majority of the exported products showed comparative advantages. Finally, the price
competitiveness of Greek exports seems to be rather limited. It is therefore necessary to
consider additional, non-price factors that could increase total competitiveness in international
markets.
The present study is organized as follows. The degree of exposure of the Greek
economy to international trade and particularly the structure of exports by commodity and area
of destination are analyzed in section 2. In section 3, the method of Constant Market Share
Analysis (CMSA) is applied in order to measure the factors underlying changes in Greek
export market shares. The role of the commodity (variety and quality) composition of Greek
exports is described in section 4. Section 5 presents the competitive position of Greek exports
in international markets and an analysis (both static and dynamic) of the specialization pattern
of Greek exports. Finally, the effect of price competitiveness on export market shares is
examined. Section 6 summarizes the results and the conclusions of this analysis.
2. Greek export structure and international trade exposure of the Greek
economy
2.1. Greek export structure by product type, technological intensity and
geographical destination area
The structure of Greek exports by product and geographical destination changed
considerably during the 1996-2006 period. The contribution of foodstuff and other
manufactured products in exports declined in favor of products in the categories of chemicals,
machinery and transportation equipment. Overall, the participation of medium- and
high-technology products in exports improved significantly, although their share in total exports is
still rather low. At the same time, Greek exports shifted away from their traditional destination
of the EU market towards new destinations in the SE Europe region.
The structure of Greek exports by product (one-digit category of the Standard
International Trade Classification (SITC),1 indicates that, the combined share of “foodstuff”
and “other manufactured” products2 in total Greek exports fell from 80% in 1996 to 64% in
1
The data used for the analysis of the Greek export structure by product and area include 279 products, as defined by the four-digit SITC.
2
2006 (Figure 1). On the other hand, exports of “chemicals” and “machinery” almost tripled and
doubled their shares, respectively (it should be mentioned that the euro area countries as a
whole developed increased specialization in exports of chemicals over the period examined). 3
The changes in the composition of Greek exports by technological intensity are shown
in Figure 2. Exported goods are grouped into three categories: “low”, “medium” and “high”
technology. During the period of interest, the share of low-technology products in total exports
fell from 85% in 1996 to 67% in 2006, while that of medium-technology exports more than
doubled. The share of high-technology products in exports also increased, although to a lesser
extent. However, the gradual substitution of low technology-products by medium- and
high-technology ones is slow and limited, placing Greek exports in an unfavourable position relative
to the rest of the euro area countries (low-technology products represent two thirds of Greek
exports and less than one third of EU countries). The technological content of exported
products must be given serious consideration if Greece is to benefit from the growth prospects
•Raw materials excluding fuel (2).
•Chemicals: chemical and pharmaceuticals (5).
•Machinery: mechanical and transportation equipment (7).
•Other manufactured products: manufactured products classified by raw material (6) and other manufactured products (8).
3
Di Mauro and Forster (2008).
45 6 6 9 35 48 7 6 7 31 48 8 7 6 31 44 8 8 7 33 44 11 10 7 28 44 10 11 6 29 43 10 12 6 29 45 9 14 6 25 44 11 16 6 23 40 10 18 6 26 39 12 16 8 25 0% 20% 40% 60% 80% 100%
1996 1997 1998 1999 2000 2001 2002 2003 2004 2005 2006
Other manufactured products Mechanical and transportation equipment Chemicals Raw materials except fuel
[image:5.595.90.503.168.439.2]Food, beverages, tobacco, fats & oils
of foreign demand, since the markets for high-technology goods are the most dynamic. In
addition, Greek exports, as well as the exports of other EU countries (like Portugal) that
specialize in low technology products, face strong competition from countries with low labour
costs, such as China.
The large EU-15 market remained the major destination for Greek products, despite the
fact that its share in Greek exports decreased from 60% in 1996 to 51% in 2006 (Figure 3).
However, the process of this geographical redistribution was rather significant in terms of size
and consequences. The redirection of Greek exports to alternative destinations, mainly to the
SE Europe and the MME countries started in the early 1990s and accelerated during the period
under consideration. Specifically, the shares of exports towards these markets rose from 12%
and 7% respectively in 1996 to 20% and 11% in 2006. These two regions together absorb
almost one third of Greek exports; at the same time, Greek products have a substantial market
share in these regions.
Several factors were the key drivers of these developments. First, the increasing
competition from third countries encountered by Greek exports in EU-15 markets forced them
to find alternative destinations. Second, the already considerable presence of Greek firms and
85 9 6
84 10 6
82 11 7
81 11 8
76 13 11
76 15 9
75 16 9
73 19 8
70 20 9
68 23 9
67 22 11
0% 20% 40% 60% 80% 100%
[image:6.595.91.504.163.419.2]1996 1997 1998 1999 2000 2001 2002 2003 2004 2005 2006
Figure 2. Composition of Greek exports by technological intensity (percentage change in total exports value)
financial institutions in SE Europe and MME countries provided them with knowledge of the
local market environment. Third, proximity allowed easy access. Finally, these countries were
growing fast. By contrast, the shares of Greek exports towards the USA and the rest of the
world did not change significantly.
2.2 Trade exposure of the Greek economy
Over the past three decades, the trade exposure of many European countries expanded
under the influence of several factors, such as the gradual international trade liberalization, the
smaller distance between markets and lower transportation costs, consumer demand for wider
product variety and the increased significance of vertical differentiation. The establishment of
initially the EEC (1961) and later the EU (1992) set among its objectives the strengthening of
free trade and the development of an expanded common market, to the benefit of all the
participating countries. In particular, smaller countries would benefit from the restructuring of
production and the resulting increase in foreign trade.
The positive correlation between growth rates and international trade exposure is
supported by a number of empirical studies (Balassa, 1985, Edwards, 1992, Dollar, 1992 and
60 12 7 4 16 60 13 8 5 15 61 13 8 4 13 62 13 8 6 12 52 18 10 6 15 52 18 9 5 16 52 18 10 5 15 53 20 9 4 15 52 21 9 5 13 53 19 10 5 14 51 20 11 4 14 0% 20% 40% 60% 80% 100%
[image:7.595.101.513.95.375.2]1996 1997 1998 1999 2000 2001 2002 2003 2004 2005 2006
Figure 3. Geographical distribution of Greek exports
(percentage share in total exports value)
Proudman et al., 1997). In addition, Sachs and Warner (1995) exploring the effect of trade
liberalization on economic development, after World war II, in two groups of countries: “open”
and “closed”, found that increased exposure of less developed economies to international trade
supports higher growth rates than in more developed countries. These higher growth rates can
be attributed to technology transfer or concentration of capital. However, the openness of the
Greek economy to international trade during the 1996–2006 period seems to have remained
[image:8.595.98.518.262.518.2]relatively low, mainly due to low export performance.4
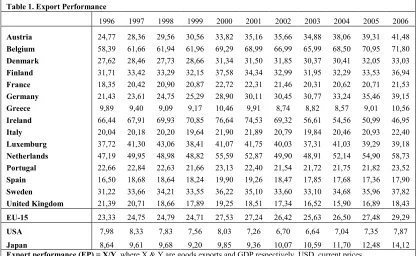
Table 1. Export Performance
1996 1997 1998 1999 2000 2001 2002 2003 2004 2005 2006
Austria 24,77 28,36 29,56 30,56 33,82 35,16 35,66 34,88 38,06 39,31 41,48
Belgium 58,39 61,66 61,94 61,96 69,29 68,99 66,99 65,99 68,50 70,95 71,80
Denmark 27,62 28,46 27,73 28,66 31,34 31,50 31,85 30,37 30,41 32,05 33,03
Finland 31,71 33,42 33,29 32,15 37,58 34,34 32,99 31,95 32,29 33,53 36,94
France 18,35 20,42 20,90 20,87 22,72 22,31 21,46 20,31 20,62 20,71 21,53
Germany 21,43 23,61 24,75 25,29 28,90 30,11 30,45 30,77 33,24 35,46 39,15
Greece 9,89 9,40 9,09 9,17 10,46 9,91 8,74 8,82 8,57 9,01 10,56
Ireland 66,44 67,91 69,93 70,85 76,64 74,53 69,32 56,61 54,56 50,99 46,95
Italy 20,04 20,18 20,20 19,64 21,90 21,89 20,79 19,84 20,46 20,93 22,40
Luxemburg 37,72 41,30 43,06 38,41 41,07 41,75 40,03 37,31 41,03 39,29 39,18
Netherlands 47,19 49,95 48,98 48,82 55,59 52,87 49,90 48,91 52,14 54,90 58,73
Portugal 22,66 22,84 22,63 21,66 23,13 22,40 21,54 21,72 21,75 21,82 23,52
Spain 16,50 18,68 18,64 18,24 19,90 19,26 18,47 17,85 17,68 17,36 17,90
Sweden 31,22 33,66 34,21 33,55 36,22 35,10 33,60 33,10 34,68 35,96 37,82
United Kingdom 21,39 20,71 18,66 17,89 19,25 18,51 17,34 16,52 15,90 16,89 18,43
EU-15 23,33 24,75 24,79 24,71 27,53 27,24 26,42 25,63 26,50 27,48 29,29
USA 7,98 8,33 7,83 7,56 8,03 7,26 6,70 6,64 7,04 7,35 7,87
Japan 8,64 9,61 9,68 9,20 9,85 9,36 10,07 10,59 11,70 12,48 14,12
Export performance (EP) = Χ/Υ, where Χ & Υ are goods exports and GDP respectively, USD, current prices.
Source: OECD, National Accounts, online.
As indicated in Table 1, Greek export performance, as measured by exports as a
percentage of GDP, is the lowest among the EU-15 countries and approximately one third of
the EU average (1996: 9.9%, 2006: 10.6%). The slight improvement observed since 2002 can
be explained by the favourable effect of EMU participation. The overall openness5 of the
Greek economy increased substantially (from 33.6% in 1900 to 37.9% in 2006). However, it
remained significantly lower than the EU-15 average (which increased from 45.3% in 1996 to
4
59% in 2006). Finally, the index of international trade exposure6 is close to the EU-15 level
and exceeds those of other European countries such as Spain due mainly to imports.
3. Market shares of Greek exports and constant market share analysis
methodology
3.1 Market shares of Greek exports
Further evaluation of the export performance of the Greek economy requires a study of
Greek export shares in foreign markets. Export market share analysis allows the isolation of the
effects of foreign demand and reflects changes mainly in export competitiveness. The export
market share of total Greek exports in all destinations is defined in this study as the ratio of the
value of Greek exports over the value of total world imports.7
Export market shares may differ depending on the definition of world imports. That is,
world imports may be either weighted by the participation of each destination area in total
exports of the country of interest, or taken as an unweighted sum. Market shares calculated
using exports and imports in value terms are also different from shares based on volumes,
partly reflecting movements in exchange rates. However, they are used more often because
detailed data on international trade volumes are not easily available and are of limited
reliability due to the presence of measurement errors. As a result, the conclusions of export
market shares analysis may vary sometimes depending on the use of value or volume data,8 but
are similar in most cases.
The analysis of Greek export market shares, in Figure 4 and Table 2, shows that the
share of Greek exported goods in the world market declined slightly, overall, from 0.32% in
1996 to 0.30% in 2006. It should be mentioned, that, according to the IMF,9 during the same
period (1996-2006), the export market shares of OECD and EU countries also fell (by 13.4%
and 12.8% respectively) due mainly to competition from China.
6
Trade Exposure = Export performance + (1 – Export performance) * Import penetration. The index is shown in Table 14 of the Appendix.
7
The export market share of product i in market j, is defined, as the ratio of the value of exports of product i in this market j over total imports of product i in market j.
8
ΕCB (2005).
9
Greek exports achieved considerable market share in the markets of South-Eastern
Europe. This was approximately eight times higher than the world total and increased from
2.3% in 1996 to 2.7% in 2006. The next highest Greek export market shares are observed in
the MME region and rose from 1.1% in 1996 to 1.3% in 2006. Greek export market share in
the EU-15 market declined and remained at a level below 0.5% in 2006.
Greek export market shares by product category and destination area are shown in
Table 2. The market share of “chemicals” increased considerably from 0.20% in 1996 to 0.31%
in 2006,10 in all major markets of EU-15, SE Europe and MME. In addition, the market share
of “machinery” showed improvement in the same markets. By contrast, with the exception of
some destinations, the market shares of “foodstuff products” “raw materials” and “other
manufacturing products” declined. It must be noted, that market shares of exports from several
developed countries declined in markets for manufacturing products such as textiles and
clothing.
10
[image:10.595.100.513.71.298.2]Michel (2005) showed that, during the 1991-2001 period, developed countries clearly specialized in exports of electronic equipment and, to a smaller degree, in exports of chemicals, while a decline in market shares is
Figure 4. Greek export market shares by geographical area
(current prices, percentage in total value of imports in each area)
0,0 0,5 1,0 1,5 2,0 2,5 3,0 3,5
1996 1997 1998 1999 2000 2001 2002 2003 2004 2005 2006 0,0 0,5 1,0 1,5 2,0 2,5 3,0 3,5
SE Europe MME EU-15 Total
Table 2. Greek export market shares by product category and destination area
(current prices, percentage of total imports (value) of each area)1
All products
total Food
Raw materials except fuel Chemicals Mechanical and transportatio n equipment Other manufacture d products 1996 -2000 2001 -2006 1996 -2000 2001 -2006 1996-2000 2001-2006 1996 -2000 2001 -2006 1996-2000 2001-2006 1996 -2000 2001 -2006
Total 0,32 0,30 1,03 0,94 1,44 1,30 0,20 0,31 0,05 0,07 0,40 0,37
EU-15 0,51 0,46 1,58 1,33 1,52 1,41 0,20 0,40 0,08 0,11 0,64 0,50
SE Europe 2,54 2,72 5,34 5,21 14,91 12,52 1,80 1,94 0,77 0,97 2,59 3,31
MME 1,09 1,14 1,14 1,30 5,17 4,39 1,12 1,22 0,27 0,49 1,81 1,45
USA 0,11 0,10 0,57 0,50 0,39 0,44 0,04 0,04 0,01 0,01 0,15 0,13
Rest of the
world 0,11 0,10 0,41 0,43 0,54 0,51 0,10 0,10 0,02 0,02 0,12 0,11 1 The cases where export market shares increase are in bold characters.
Export market shares of “chemicals” and “machinery” in the EU-15 market rose
between the two sample sub periods (1996-2000 and 2001-2006), while market shares of all
other product categories declined in the same period. Improved Greek export shares in the
South-Eastern European markets were due to exports of “chemicals” and “other manufacturing
products”. Finally, in the MME markets, exports of “chemicals”, “machinery” and “foodstuff
products” were the major contributors to increased market shares. Greek export market shares
by technological intensity and destination area are presented in Table 3, which indicates in
separate sections that market shares of medium-technology products and, to a lesser extent, of
high-technology products increased in all world markets as well as in the major markets
(EU-15, SE Europe and MME), between the two sub periods under review. At the same time, the
Table 3. Greek export market shares by technological intensity and destination area
(current prices, percentage of total imports value of each area)1
Tecnological intensity
Total Low Medium High
1996-2000
2001-2006
1996-2000
2001-2006 1996-2000
2001-2006
1996-2000
2001-2006
All areas total 0,32 0,30 0,51 0,48 0,15 0,23 0,05 0,07
EU-15 0,51 0,46 0,80 0,67 0,17 0,31 0,07 0,12
SE Europe 2,54 2,72 3,21 1,65 1,42 3,69 0,71 0,89
MME 1,09 1,14 1,61 1,49 0,78 0,89 0,26 0,54
USA 0,11 0,10 0,20 0,18 0,03 0,03 0,01 0,01
Rest of the world 0,11 0,10 0,19 0,18 0,07 0,08 0,02 0,02 1 The cases where export market shares increase are in bold characters.
products fell in all destinations. Note that, among the southern euro area countries (France,
Greece, Italy, Portugal and Spain), all but the last one improved the technological intensity of
their exports considerably during the 1994-2005 period. This development was more
pronounced in Greece and Portugal and consistent with the expectations concerning the
convergence process after their entry in the EU and, later, in the EMU.
3.2 Constant Market Shares Analysis
3.2.1 Theoretical consideration
Constant Market Share Analysis (CMSA) is a method for examining export
performance, by focusing on the role of a country’s export structure (its composition by
product and geographic distribution) and competitiveness. Specifically, if the country under
review specialized in products and markets where the demand is growing fast, then its export
market shares would be expected to rise.
The CMSA model, in its simple form, suggests that the export market shares of a given
Sij = qij / Qij = fij(cij ) , (1)
Where: S is the country’s export market share, q and Q are the country’s and world exports,
respectively, c is the competitiveness index, i is the exported product category, and j is the
destination market.
Differentiating equation (1) with respect to time, implies:
q΄ij =
∑
∑
j i
Sij Q΄ij +
∑
∑
j i
Qij S΄ij
=
∑
∑
j i
Sij Q΄ij +
∑
∑
j i
Qij f΄ij (cij ) , (2)
Which, after rearrangement takes the following form:
q΄ij = SQ΄+(
∑
i
Si Q΄i - SQ΄ )+(
∑
∑
j i
SijQ΄ij -
∑
i
SiQ΄i )+
∑
∑
j i
QijS΄ij , (3)
Equation (3) indicates that a country’s exports change can be decomposed into several terms:
•
The world growth effect (first term on right-hand side), which will be positive if thegrowth rate of the country’s exports is higher than the growth rate of world exports.
•
The commodity and market effects (second and third term in parenthesesrespectively). A positive effect results if specialization takes place in particular
commodities or markets, that are growing strongly. In this case, the analysis of
commodity and market effects is static, assuming that export market shares are
constant.
•
The competitiveness effect (last term). This term is a residual one and expresses thedifference between the actual change in export market shares and the two effects
described above. The calculation of competitiveness in this case allows for changes in
market shares.
3.2.2 Problems of definition and application
Application of the CMSA is associated with a series of problems:11
•
Measurement of trade flows: Market shares calculated on the basis of volumes are themost appropriate. However, market shares based on values are widely used due to lack
of reliable data on volumes.
11
•
Interpretation of commodity composition and geographic market structure: The changein the product composition of exports is related mainly to demand conditions, like
consumer preferences and competition from third countries, in the destination country.
The change in the geographic structure from the demand side reflects mainly consumer
preferences and traditional trade relations between the two countries (exporter and
destination country). From the supply side, geographic structure is related to
productivity, as well as to the monetary and fiscal policy of the exporting country.
•
Definition of competitiveness: The change in exports due to competitiveness is theresidual after subtracting the three first terms of equation (3). This residual is “total
competitiveness” and accounts for relative price including the effect of exchange rate
movements as well as other non-price factors that determine competitiveness, such as
product quality, services related to the export activity, timing etc.
•
Other problems related to the application of the CMSA methodology:: the commodityand market effects are asymmetric. The results obtained depend on whether the
commodity effect or the market effect is calculated first. In addition, if time in equation
(3) is discrete and not continuous, it would not be safe to assume that commodity
composition and geographic structure remain the same for a very long period of time.
3.2.3 CMSA results for the 1996-2006 period.
3.2.3.1 Introductory remarks
The four terms of equation (3) were calculated for the period 1996-2006 and the
sub-period 2001-2006, that is after Greece joined EMU using export market shares based on
values. Calculations are based on average annual changes during the period under review, thus
minimizing the problem of discrete time. They were also performed for changes between the
first and the last year of the period, with similar results. The CMSA method was applied in two
ways depending on whether the commodity composition effect or the geographic structure
effect was calculated first. The final result is the simple average of the two results. In this way,
the issue of calculation order was controlled for. In addition to applying the decomposition to
•
Exports to five specific areas: EU-15, USA, South Eastern Europe (SE Europe),Mediterranean and Middle East (MME) and rest of the world.
•
Exports grouped by product according to the one digit categories of the SITC.•
Exports grouped by technological intensity: low, medium and high technology.3.2.3.2 Results
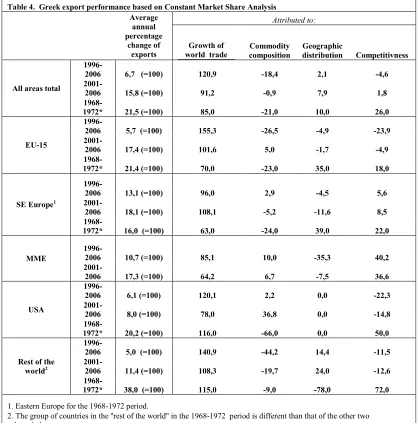
The results of the CMSA in Tables 4 and 5 indicate that the increase in Greek exports
during the 1996-2006 period is smaller than the potential, given the growth of world trade. This
can be attributed mainly to the product composition of Greek exports – namely the
specialization in products facing rather unfavourable demand conditions - and to the negative
effect of competitiveness. By contrast, the geographical structure of Greek exports had a
positive effect on export growth. These results are similar to those of a related study (Michel,
2005), which concludes that during the 1997-2001 period, competitiveness and product
composition had a negative effect on Greek exports12.
In addition, according to a previous study13 of Greek exports, the effect of commodity
composition on Greek export performance is the same for the period 1968-1972. The effects of
world trade and competitiveness are different, however. During the 1968-1972 period, the
growth of Greek exports was faster than that of world trade, while the effect of competitiveness
was substantial and positive. It must be noted that high competitiveness in this period reflects
the considerable subsidies to most Greek exporting firms. During the 2001-2006 five year
period, export performance as a whole, improved with respect to that of the longer 1996-2006
period. The market effect remained positive and high, while the commodity composition effect
remained negative, though at a lower level. Finally, the competitiveness effect changed from
negative to a marginal positive.
12
Specifically, Michel (2005) applied CMS analysis for the EU-15 countries for the periods 1991-1997 and 1997-2001. During the first period all countries market shares fell, mainly because of the geographic structure of their export markets, which was not successful for most countries. In addition, for most countries the product composition of exports had a slightly negative effect, while the effects of competitiveness were mixed. The decline in the market share continued in the second period at a slower pace. In this period, competitiveness was the main reason for the decline in export market share in most EU-15 countries, while the effect of geographic structure and product composition was smaller. Results for Greece for the 1991-1997 period indicate that all three factors had a strong negative effect, while in the second period there was a significant negative effect was for competitiveness and product composition only.
13
Table 4. Greek export performance based on Constant Market Share Analysis Average annual percentage change of exports Attributed to: Growth of world trade
Commodity composition
Geographic
distribution Competitivness
All areas total
1996-2006 6,7 (=100) 120,9 -18,4 2,1 -4,6
2001-2006 15,8 (=100) 91,2 -0,9 7,9 1,8
1968-1972* 21,5 (=100) 85,0 -21,0 10,0 26,0
EU-15
1996-2006 5,7 (=100) 155,3 -26,5 -4,9 -23,9
2001-2006 17,4 (=100) 101,6 5,0 -1,7 -4,9
1968-1972* 21,4 (=100) 70,0 -23,0 35,0 18,0
SE Europe1
1996-2006 13,1 (=100) 96,0 2,9 -4,5 5,6
2001-2006 18,1 (=100) 108,1 -5,2 -11,6 8,5
1968-1972* 16,0 (=100) 63,0 -24,0 39,0 22,0
MME
1996-2006 10,7 (=100) 85,1 10,0 -35,3 40,2
2001-2006 17,3 (=100) 64,2 6,7 -7,5 36,6
USA
1996-2006 6,1 (=100) 120,1 2,2 0,0 -22,3
2001-2006 8,0 (=100) 78,0 36,8 0,0 -14,8
1968-1972* 20,2 (=100) 116,0 -66,0 0,0 50,0
Rest of the world2
1996-2006 5,0 (=100) 140,9 -44,2 14,4 -11,5
2001-2006 11,4 (=100) 108,3 -19,7 24,0 -12,6
1968-1972* 38,0 (=100) 115,0 -9,0 -78,0 72,0
1. Eastern Europe for the 1968-1972 period.
2. The group of countries in the ''rest of the world'' in the 1968-1972 period is different than that of the other two sub-periods.
*Source: P. Athanasoglou (1993).
The results of the CMSA by area indicate that, for exports to the EU15 all the effects
deteriorated relative to those obtained for total exports, while the improvement observed for
total exports during the 2001-2006 period was evident also in the performance of exports to
EU-15 market. Over the 1996-2006 period, only the market effect was negative for exports to
the SE Europe, while over the 2001-2006 period the commodity composition effect was also
negative. Negative effects on export growth were also present in the market effect for exports
to the MME markets, competitiveness for exports to the USA and competitiveness and export
composition for exports to the rest of the world. It must be noted that the positive market effect
the commodity composition of exports and competitiveness had positive effects on exports to
[image:17.595.88.509.131.629.2]some markets, except that of the EU-15.
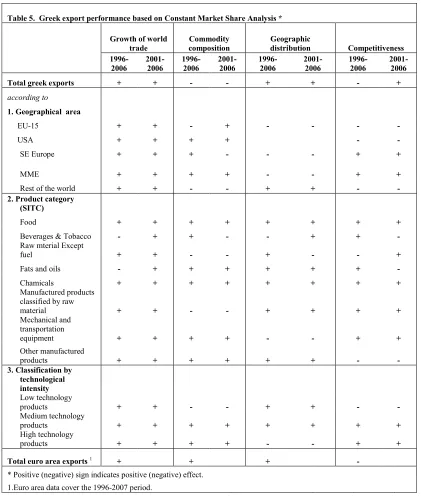
Table 5. Greek export performance based on Constant Market Share Analysis *
Growth of world trade
Commodity composition
Geographic
distribution Competitiveness
1996-2006 2001-2006 1996-2006 2001-2006 1996-2006 2001-2006 1996-2006 2001-2006
Total greek exports + + - - + + - +
according to
1. Geographical area
EU-15 + + - + - - - -
USA + + + + - -
SE Europe + + + - - - + +
MME + + + + - - + +
Rest of the world + + - - + + - -
2. Product category
(SITC)
Food + + + + + + + +
Beverages & Tobacco - + + - - + + -
Raw mterial Except
fuel + + - - + - - +
Fats and oils - + + + + + + -
Chamicals + + + + + + + +
Manufactured products classified by raw
material + + - - + + + +
Mechanical and transportation
equipment + + + + - - + +
Other manufactured
products + + + + + + - -
3. Classification by technological
intensity
Low technology
products + + - - + + - -
Medium technology
products + + + + + + + +
High technology
products + + + + - - + +
Total euro area exports 1 + + + -
* Positive (negative) sign indicates positive (negative) effect. 1.Euro area data cover the 1996-2007 period.
The results of the analysis by technological intensity are presented in Table 5 and show
that commodity composition and competitiveness had a negative effect on the exports of low
technology products, while the geographic structure had a negative effect on exports of high
technology products. By contrast, all effects on exports of medium technology products were
Concluding, world trade growth and the geographical structure of destination markets
had positive effects on Greek export performance during the 1996-2006 period, while the
effects of export composition and competitiveness are negative. The effects of the last two
factors showed substantial improvement during the 2001-2006 five year period; the effect of
product composition remained negative, but was much smaller while the effect of
competitiveness turned positive, albeit low. The next two sections focus on the study of
commodity composition and competitiveness and their effects on Greek export performance.
4. The role of commodity composition of exports: variety and quality
4.1 Introductory remarks
“New Trade Theory” suggests that foreign income and price competitiveness only
partially explain export performance, implying that factors such as variety, quality and the
technological content of exported goods are also important. Krugman (1989) argues that the
high income elasticity of exports in developed economies is associated with a high level of
product variety. In addition, Grossman and Helpman (1991) focused on the role of innovation
and the development of new varieties (horizontal differentiation) and the role of improved
quality (vertical differentiation) in international trade. Dixit and Norman (1980) presented a
similar analysis. Consequently, the “New Trade Theory” replaces the traditional hypothesis of
perfect competition and constant returns to scale by the alternative of monopolistic competition
and increasing returns in output markets. Within this framework, increased product variety and
improved quality of exported goods may cause an upward shift in the export demand curve.
The welfare effects from trade, identified by the “New Trade Theory” can be attributed to: 1)
lower costs due to economies of scale; 2) increased consumer welfare since consumers can buy
different varieties of the same product at a relatively lower price; and 3) lower structural costs
due to liberalization and expansion of international trade.
Several recent empirical studies (Anderton, 1999, Funke and Ruhwedel, 2001,
Hummels and Klenow, 2002, and Schott, 2004) support the positive effect of improved product
variety and quality on export performance. Specifically, Anderton (1999) using investment and
technology as proxy for variety and quality, found a significant influence on UK’s trade. Funke
Asian countries contributed to a considerable rise in their exports. In the case of Greece,
Athanasoglou and Bardaka (2010) suggested that there is a positive relationship between
product differentiation and export performance, since the variable used as a proxy for nonprice
competitiveness is also an indirect index of product variety and quality.14
4.2 Product Variety
Several direct indices have been used in economic literature in order to measure
product variety15 (Κandogan, 2003), such as:
•
the number of product categories exported;•
the Funke and Ruhwedel index (2001);•
the extensive margin index developed by Hummels and Klenow (2002); and•
the intra-industry trade index developed by Grubel and Lloyd (1975).Although the first index is easy to calculate, it weights equally small and large product
categories and ignores differentiation within the same category.
The Funke and Ruhwedel (2001) index, developed by Feenstra (Feenstra, 1994), results
from estimating production or utility functions. (Κardogan, 2003). This index is given by:
A t
FR = ln(
Α − − ∈ Α ∈ Χ Χ
∑
∑
1 1 pt Pt p pt Pt p) – ln (
Α − ∈ Α ∈ Χ Χ
∑
∑
1 pt P p pt P p) , (4)
t
P =
{
p ΧΑpt>0}
, Pt−1={
pΑ −
Χpt 1>0
}
και P= Pt−1∩ Ptwhere: ΧΑ
pt is the volume of exports of product p from country A at time t. The first term on
the right hand side shows the change in the total volume of exports between two consecutive
time periods and the second term shows the change in the volume between the two time
periods. Their difference represents the increase in the volume of exports of new products. This
index takes into account the significance of each product category exported by country A.
However, its calculation requires very detailed data in order to distinguish an increase in the
volume of exports of products common in both periods from an increase in variety.
14
In Athanasoglou and Bardaka (2010) the capital stock is used as a proxy for non price competitiveness. In addition, Muscatelli et al. (1995) reached similar conclusions.
15
The extensive margin index shows the share of world exports in the markets where the
country under review exports. A low extensive margin indicates limited product variety. For
country A, the index is given by:
W A i s X
W is
A
X X HK Ais
∑∑
≠ ∈
= , (5)
where: Xisw is world exports of product s to country i, XAis country A exports of product s to
country i (with XAis >0), while X W is total world exports. The HKA index takes into account the
significance of all product categories, although the weights used are the shares in total world
exports and not in country A’s exports. In addition, it may overestimate product differentiation,
as long as the increase in trade is totally attributed to product variety.
Exported product variety is also approximated by the intra-industry trade index (IIT)
proposed by Grubel and Lloyd (1975). The (IIT) index reflects exports and imports of products
that belong to the same sector from and to a country. According to OECD (2002), a
considerable expansion of intra-industry trade was observed during the 1980’s in the majority
of its member countries (especially in economies with a high degree of openness) in sectors
with relatively high technological content (chemicals, machinery and electronic equipment).
At this point it must be noted that there is a difference between vertical and horizontal
intra-industry trade. The former refers to exports and imports of products in the same sector but
at a different stage of production, while the latter refers to exports and imports of products in
the same sector and at the same stage of production. This study focuses on horizontal
intra-industry trade of products which:
•
are close substitutes in their final use (consumption), but incorporate differentinputs (use, intensity);
•
use the same inputs, but have different final use;•
use the same inputs and have the same final use.In economic analysis, a sector includes firms that produce similar products. Trade
statistics use a different approach which according to Grubel and Lloyd (1975), “is based on ad
hoc similarities of inputs and final use”. For this reason, in external trade statistics a sector
machinery) includes both computers and pencil sharpeners. However, although a part of
intra-industry trade may be spurious, a significant part of it is genuine (Gray, 1979).16
The intra-industry trade (ITT) index of sector i at time t is expressed by:
+
−
−
=
, 0≤ ≤ , (6) [image:21.595.92.488.281.483.2]where:
x
itandm
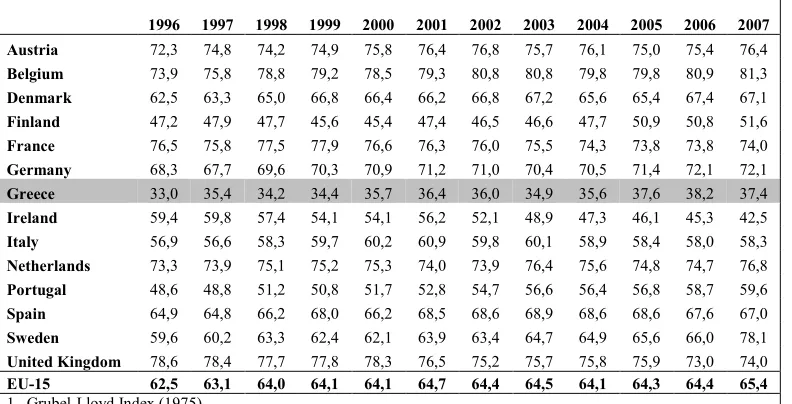
itare exports from and imports into the country under review in sector i.Table 6. Intra industry trade indices 1
1996 1997 1998 1999 2000 2001 2002 2003 2004 2005 2006 2007 Austria 72,3 74,8 74,2 74,9 75,8 76,4 76,8 75,7 76,1 75,0 75,4 76,4
Belgium 73,9 75,8 78,8 79,2 78,5 79,3 80,8 80,8 79,8 79,8 80,9 81,3
Denmark 62,5 63,3 65,0 66,8 66,4 66,2 66,8 67,2 65,6 65,4 67,4 67,1
Finland 47,2 47,9 47,7 45,6 45,4 47,4 46,5 46,6 47,7 50,9 50,8 51,6
France 76,5 75,8 77,5 77,9 76,6 76,3 76,0 75,5 74,3 73,8 73,8 74,0
Germany 68,3 67,7 69,6 70,3 70,9 71,2 71,0 70,4 70,5 71,4 72,1 72,1
Greece 33,0 35,4 34,2 34,4 35,7 36,4 36,0 34,9 35,6 37,6 38,2 37,4
Ireland 59,4 59,8 57,4 54,1 54,1 56,2 52,1 48,9 47,3 46,1 45,3 42,5
Italy 56,9 56,6 58,3 59,7 60,2 60,9 59,8 60,1 58,9 58,4 58,0 58,3
Netherlands 73,3 73,9 75,1 75,2 75,3 74,0 73,9 76,4 75,6 74,8 74,7 76,8
Portugal 48,6 48,8 51,2 50,8 51,7 52,8 54,7 56,6 56,4 56,8 58,7 59,6
Spain 64,9 64,8 66,2 68,0 66,2 68,5 68,6 68,9 68,6 68,6 67,6 67,0
Sweden 59,6 60,2 63,3 62,4 62,1 63,9 63,4 64,7 64,9 65,6 66,0 78,1
United Kingdom 78,6 78,4 77,7 77,8 78,3 76,5 75,2 75,7 75,8 75,9 73,0 74,0
EU-15 62,5 63,1 64,0 64,1 64,1 64,7 64,4 64,5 64,1 64,3 64,4 65,4
1. Grubel-Lloyd Index (1975).
Source: OECD ITCS (International Trade by Commodity Statistics).
The intra-industry trade index of Greece, as shown in Table 6, is the lowest in the
EU-15 countries and below the European average17. This indicates that Greece produces and
exports a limited variety of products. It should also be noticed that the intra-industry trade
index in Greece (as well as in Portugal and Sweden) increased more than the European average
during the period 1996-2007
16
Aquino (1978) showed that the intra-industry trade index is biased downwards when trade of a particular product is not in equilibrium.
17
4.3 Product Quality
Structural changes in production and the replacement of traditional, labour intensive
products by new products, intensive in specialized labour and high technology is expected to
lead to a considerable improvement of export performance. While available inputs and prices
are traditionally the main factors determining the structure of production and external trade of a
country, in the case of new products, quality also plays a major role in determining
competitiveness and establishing a substantial market share, especially in international
markets. In addition, other relevant factors include the reputation of the firm or the product and
other processes, such as marketing and delivery time.
In this paper, relative price is used as a proxy for the quality of a product. A quality
index for total exports is given by:
Qt =
∑
∑
∑
= = = k j f t i t j n i n i g t iP
w
P
1 , , 1 1 ,, (7)
where: Qt = quality index at time t,
P
g
t
i, = Greek average export price,
P
f
t
i, = average export
price of competitors of Greek exports, i=1, …, η, the number of products and j=1, …, k, the
[image:22.595.109.525.503.754.2]number of competitors (n= 279 and k= 15).
Figure 5. Quality of Greek exports and market shares
0,50 0,55 0,60 0,65 0,70 0,75 0,80 0,85 0,90 0,95 1,00 1,05 1,10
1996 1997 1998 1999 2000 2001 2002 2003 2004 2005 2006 0,25 0,30 0,35 0,40 0,45 0,50 0,55 0,60 0,65
Quality index of Greek exports (left axis))
Quality index of Greek exports to the EU-15 (left axis) )
Market share in the EU-15 (right axis) Total market share (right axis)
The quality index of total exports as shown in Figure 5 has deteriorated in the last
several years, while the quality of exports to the EU-15 had been deteriorating up to 2004 and
started to improve in the 2005-2006 period. According to IMF estimates, 18 the quality of
Greek exports is lower than that of the exports of Portugal and Spain.
In order to address the statistical significance of the difference between Greek exports
and her competitor’s exports, Wilcoxon’s non parametric statistic19 was used. This test showed
that the difference in question was statistically significant at a 5% level during the 1996-2006
period, except for the three- year period 2000-2002. In addition, the same statistic was used to
test the hypothesis that Greek exports to the EU-15 are of the same quality as those to the rest
of the world, which was refuted for the whole period under review, except for the year 2000.
5. Competitiveness
5.1 Balassa index of comparative advantage.
The “Revealed Comparative Advantage” (RCA) index developed by Balassa (1965) is
widely used to determine the comparative advantage in exports and the competitive position of
a country. The index is given by:
Βij =
x
x
x
x
w i
wj ij
/ /
, (8)
with Xwj=
∑
=
n
i1
Χij and Χi=
∑
=k
j1
Χij
where: Χij = country’s i exports of commodity j, Xwj = world exports of commodity j , Xi = total
exports of country i, Xw= total world exports, i=1,...,η the number of countries και j=1, …, k
the number of commodities.
18
See footnote 10.
19
Wilcoxon’s non parametric statistical test is used when two sets of observations are related or represent repeated measurements of a particular sample, in place of the Student t statistic and when the population does not follow the normal distribution. It is based on the calculation of the differences between corresponding observations and the ranking of the absolute values of the differences. The hypothesis to be tested is whether the distribution of the
differences is symmetric around zero (0) or not. The statistic is given by: W= j n
j jr
S
∑
=1
, where rj are the observed
A country i has a revealed comparative advantage in commodity j, according to (8), if
(xij / xwj) > (xi / xw), that is if the commodity j’ s export market share is higher than the country’s
total export market share.
The Index Βijreflects the international specialization of a country, since it evaluates its
export market share in a particular commodity or sector in relation to a benchmark, such as the
total export market share of this country. Theoretically, the Βij index takes values between 0
and +∞. However, actually, the upper limit is xw / xi , which approaches ∞ when xi
→
0.Therefore, country i has a comparative advantage if 1 ≤ Βij < xw / xi and a comparative
disadvantage if 0 < Βij ≤ 1 and the Βij index follows an asymmetric distribution with 0 as the
lower limit, a variable upper limit and a variable average. Specifically, the numerator of (8) is
not weighted by the share of each commodity in total country exports, while the denominator is
a weighted average of export market shares of all products. Consequently, if a country achieves
high export shares in a few products with a small export share in world markets (the case of
small economies), the result would be an average index Βij>1. In addition, since the values of
this index may change over time, a country’s degree of specialization as measured by this
index may change as well.
An index with symmetric distribution used instead of the Βij index is the Laursen (1998)
index given by:
ΒLij =
1 1
+ −
ij ij
B B
, (9)
This index takes values between -1 and 1 and its average value is BLij =0, which has
no effect on the ranking by size of BLij. Finally, country i has a comparative advantage in
commodity j if 0
≤
ΒLij≤
1
and a comparative disadvantage if -1≤ BLij <0 .5.1.2 Descriptive statistics for the
Β
ij index of Greek exportsTable 7 presents the descriptive statistics of Βij indices of Greek exported products by
area of destination.20 The overall index average is greater than one (>1) and relatively high for
all individual destination areas, while the index average increased between periods 1996-2000
and 2001-2006 in all areas of destination excluding SE Europe and the USA. However, an
examination of the standard deviation and the frequency of the maximum and minimum values
showed intense asymmetry. Therefore, an examination of the median was preferred. The
median of the Βij index increased between the periods under review for all destination areas
except the USA, where it remained stable at less than one (<1). This indicates a comparative
disadvantage of Greek exports, contrary to examination of the average that shows the existence
[image:25.595.91.495.192.475.2]of a comparative advantage.
Table 7. Descriptive statistics for the ΒijIndex*
Average Median
Standard
deviation Minimum Maximum
1996-2000
2001-2006
1996-2000
2001-2006
1996-2000
2001-2006
1996-2000
2001-2006
1996-2000
2001-2006 Total 2,48 2,69 0,61 0,74 7,15 7,25 0,00 0,00 92,39 87,83
(7) (4) (1) (1) EU-15 2,32 2,73 0,34 0,43 6,83 9,42 0,00 0,00 77,56 155,02
(42) (48) (1) (1)
SE Europe 1,70 1,56 0,62 0,67 3,97 2,90 0,00 0,00 52,59 40,30
(23) (26) (1) (1)
MME 2,81 2,88 0,70 0,74 11,33 14,01 0,00 0,00 170,64 297,54
(52) (58) (1) (1)
USA 6,61 5,88 0,05 0,05 58,14 39,06 0,00 0,00 1.271,74 872,09
(456) (500) (1) (1) Rest of the
world 3,70 3,90 0,36 0,47 20,70 17,16 0,00 0,00 407,26 227,54
(87) (66) (1) (1)
* Number of occurences of min and max values in parentheses
The median of the ΒLij index (Figure 6) took negative values (comparative
disadvantage) and improved during the period 1996-2006 for all areas, especially the EU-15.
The average level of the Βij index for the five “best” commodities (those with the highest Βij
index value) and for the five “worst” commodities (those with the lowest Βij index value) is
presented in Table 8. During the period 1996-2000, the five “best” Greek exports represent a
considerable proportion of the total value of exports, especially exports to the rest of the world
(25%), the EU-15 and the USA (18%) and overall exports (16%). During the 2001-2006
period, these percentages declined significantly in all areas of destination except for the MME
countries. The percentage share of the five “worst” commodities in total export value in both
periods under examination is close to zero. The commodities appearing more frequently among
the five “best” are articles of apparel, fur skins, tobacco, apparel made of fur, cotton seeds,
The correlation coefficient between the Βij index and the structure of Greek exports by
commodity for the different areas of destination is presented in Figure 7. Overall, this
coefficient declined during the 1996-2006 period, in particular, a decline was observed in the
EU-15, while the coefficient increased in SE Europe and the MME. This indicates that, with
the exception of these two markets, the specialization of Greek exports is not closely related to
[image:26.595.109.522.92.345.2]the country’s comparative advantage.
Figure 6. Median of the BLij index
-0,70 -0,60 -0,50 -0,40 -0,30 -0,20 -0,10 0,00
1996 1997 1998 1999 2000 2001 2002 2003 2004 2005 2006 -0,70 -0,60 -0,50 -0,40 -0,30 -0,20 -0,10 0,00
SE Europe Total
MME ΕΕ-15
Figure 7. Correlation coefficient of the Bij index and the structure of Greek exports1
0,00 0,20 0,40 0,60 0,80
1996 1997 1998 1999 2000 2001 2002 2003 2004 2005 2006 0,00 0,20 0,40 0,60 0,80
Total ΕU-15
SE Europe MME
[image:26.595.110.524.516.734.2]This development is supported by the decline in export market shares during the
1996-2006 period (section 3.1), as well as by the decline in the share of the “best” exports in the total
[image:27.595.88.510.158.402.2]export value (Table 8).
Table 8. Index Βij of the five "best" and five "worst" exports and their share in total Greek exports value *
1996-2000 2001-2006
Average Five "best Five "worst" Average Five "best Five "worst"
Total 2,48 46,4 0,02 2,69 48,80 0,04
(15,7%) (0,1%) (9,6%) (0,5%)
EU-15 2,32 43,8 0,00 2,73 45,80 0,00
(17,8%) (0,0%) (13,7%) (0,02%)
Se Europe 1,70 23,08 0,01 1,56 15,70 0,01
(12,4%) (0,01%) (10,8%) (0,01%)
MME 2,81 62,4 0,00 2,88 70,70 0,01
(5,6%) (0,4%) (6,4%) (0,04%)
USA 6,61 252,6 0,00 5,88 196,50 0,00
(17,6%) (0,0%) (8,3%) (0,0%) Rest of the world 3,70 118,4 0,00 3,90 100,90 0,00
(24,7%) (0,0%) (19,4%) (0,0%)
* Percentage share in total value of Greek exports towards each geographical area in parentheses.
5.2 The specialization pattern of Greek exports: static and dynamic analysis.
The preceding analysis is not sufficient to fully capture the specialization pattern and
the competitive advantage of a country’s exports. The following analysis of the total
distribution of the Bij index is necessary in order to:
•
obtain a complete picture of the specialization pattern of Greek exports;•
estimate the degree of specialization; and5.2.1 Specialization pattern of exports
The study of the specialization pattern of Greek exports iis based on an analysis of the
frequency distribution of the BLijindex. Specifically, the “Kernel”21 frequency distribution was
used for all products in the periods 1996-2006 and 2001-2006.
The results of this method are consistent with those obtained so far, namely that the
specialization pattern of Greek exports is asymmetric and concentrated in the negative range of
the BLij index (Figure 8). The distribution of the index for the EU-15 is the most asymmetric
and the distribution for SE Europe the less asymmetric one, while the distribution for the MME
is almost symmetric. This specialization pattern improved in the period 2001-2006, mainly due
to the improvement in the areas of SE Europe and the MME (Figure 8). Finally, it is similar to
that of Portugal, but different than that of Spain, which reflects a more symmetric distribution
(Figure 9).
21
Figure 8. Frequency (%) distribution of the degree of specialization of Greek exports (Kernel curve - % on vertical axis)
Figure 9. Frequency (%) distribution of the degree of specialization of exports of Spain and Portugal (Kernel curve % on vertical axis)
A. Total exports
0,0 0,2 0,4 0,6 0,8
-0,8 -0,6 -0,4 -0,2 0,0 0,2 0,4 0,6 0,8 1,0 0,0 0,2 0,4 0,6 0,8 2001-2006 1996-2000 -1,0 B. EU-15 0,0 0,2 0,4 0,6 0,8 1,0
-0,8 -0,6 -0,4 -0,2 0,0 0,2 0,4 0,6 0,8 1,0 0,0 0,2 0,4 0,6 0,8 1,0 1996-2000 2001-2006 -1,0
C. S.E Europe
0,0 0,2 0,4 0,6 0,8
-0,8 -0,6 -0,4 -0,2 0,0 0,2 0,4 0,6 0,8 1,0 0,0 0,2 0,4 0,6 0,8 1996-2000 2001-2006 -1,0 D. MME 0,0 0,2 0,4 0,6 0,8
-0,8 -0,6 -0,4 -0,2 0,0 0,2 0,4 0,6 0,8 1,0 0,0 0,2 0,4 0,6 0,8 1996-2000 2001-2006 -1,0
Source: Amador et al. (2007).
[image:29.595.80.533.532.767.2]