Munich Personal RePEc Archive
Firm age and performance
Loderer, Claudio and Waelchli, Urs
University of Bern, ECGI European Corporate Governance Institute
10 April 2010
Online at
https://mpra.ub.uni-muenchen.de/26450/
Firm age and performance
Claudio Loderer and Urs Waelchli*
April 30, 2010
As firms grow older, their profitability seems to decline. We first document this phenomenon and show that it is very robust. Then we offer two non-exclusive explanations of why firms may age. First, corporate aging could reflect a cementation of organizational rigidities over time. Consistent with that, costs rise, growth slows, assets become obsolete, and investment and R&D activities decline. Second, older age could advance the diffusion of rent-seeking behavior inside the firm. This hypothesis is supported by the poorer governance, larger boards, and higher CEO pay we observe in older firms. Overall, firms seem to face a real senescence problem.
Keywords: firm age, organizational rigidities, rent-seeking, firm life cycle, corporate governance, firm performance
JEL codes: G30, L20
* Loderer (corresponding author) is from the Institut für Finanzmanagement, University of Bern ([email protected]). Much of this research was conducted during his stay at the Stern School of Business, New York University. Waelchli is from the Institut für Finanzmanagement, University of Bern ([email protected]). We have benefited from Nancy Macmillan’s great editorial help. We wish to thank Demian Berchtold and Anita Bühler for research assistance. Comments and suggestions from Artur Baldauf,
Carsten Bienz, Øyvind Bohren, Michael Brennan, Francois Degeorge, Bernd Frick, Michael Gerfin, Yoram
page 2
1. Introduction
In biology, aging is a process associated with a general decline in the physical functioning of the
human body, such as the ability to remember, react, move, and hear. We want to know whether
firms also weaken and lose their ability to compete over time, and we want to know why that
happens. The first part of the paper documents a steady profitability decay as firms get older.
The second part then examines the possible economics of that phenomenon and offers two not
mutually exclusive rationales, namely organizational rigidities and rent-seeking behavior.
Whereas the quest for organizational immortality has attracted considerable attention in the
management, the organization, and the industrial organization literatures (Stinchcombe, 1965;
Dunne, Roberts, and Samuelson, 1989; Singh and Lumsden, 1990; Brüderl and Schüssler, 1990;
Barron, West, and Hannan, 1994; Hannan, 1998, Hannan, Pólos, and Carroll, 2003a, b),
economists have generally paid comparatively little attention to the issue of the actual
performance of older firms (Caves, 1998). This paper wants to contribute closing that gap.
Since firms are organizations that can be restructured as needs evolve, there is no a priori
reason why they should age. In fact, as they mature, firms should be able to learn. They can
learn by doing or by investing in research and development; they can hire human capital and
train their employees; and they can learn from other firms in the same and in other industries
(see, for example, Bahk and Gort, 1993, and the vast literature cited therein). Over time, firms
should also discover what they are good at (Jovanovic, 1982). Consistent with this prior belief,
various studies in the industrial organization literature report that life expectancy increases with
page 3
2002). Hopenhayn (1992) shows that, under plausible assumptions, older firms enjoy higher
profits and value.
As mentioned above, this study begins with an examination of the relation between age and
profitability. We study 10,930 listed firms with data on CRSP, COMPUSTAT, and
COMPUSTAT Industry Segment between 1978 and 2004 (82,845 firm-years). We show that
getting older is associated with lower profitability. Profit margins, return on assets, and Tobin’s
Q ratios fall. This pattern holds across different time periods, for different measures of age, for
different industry definitions, and for different firm samples. This regularity is robust to a
battery of alternative estimation techniques and specifications. Moreover, it is distinct from such
phenomena as sample selection, concave investment opportunity sets, financial frictions (Cooley
and Quadrini, 2001; Clementi, 2002), declining investor uncertainty (Pástor and Veronesi, 2003),
increasing diversification (Campa and Kedia, 2002; Villalonga, 2004), post-IPO regularities
(Jain and Kini, 2004; Fama and French, 2004), declining ownership concentration (Holderness,
Kroszner, and Sheehan, 1999; Helwege, Pirinsky, and Stulz, 2007; Holderness, 2009), older
management (Finkelstein and Hambrick, 1990; Faleye, 2007), and aging industry. Firm aging
does not seem to be driven by family firms either (Anderson and Reeb, 2003; Villalonga and
Amit, 2006).1
Why would firms age? In the second part of the paper, we propose two nonexclusive
explanations for that possible phenomenon, namely organizational rigidities (Hannan and
Freeman, 1984; Leonard-Barton, 1992) and rent-seeking behavior (Olson, 1982; Bertrand and
1
Firm age also appears as a control variable in various empirical finance studies. For example, it is a control
page 4
Mullainathan, 2003). Organizational rigidities can come about because success induces firms to
codify their approach through organization and processes. This regulation can become capillary
over time. This behavior seems increasingly to entangle firms in structural and process-related
rigidities that are difficult to discard (Leonard-Barton, 1992) and that could cause companies to
succumb to Schumpeter’s “perennial gale of creative destruction.” We refer to this hypothesis as
organizational rigidity hypothesis. It could also be that older firms are incapable of solving
collective action problems. As in the case of nations (Olson, 1982), firms might increasingly
become organizations of rent-seeking factions as they get older. Rent seeking can take the form
of the pursuit of a quieter life (Bertrand and Mullainathan, 2003).
Consistent with the existence of organizational rigidities, we find that older firms are less
efficient compared to their industry peers, as manifested in higher costs, slower growth, older
assets, and reduced R&D and investment activities. We also observe a progressive degeneration
of corporate governance quality, larger boards, and higher CEO compensation, which is
consistent with the inability to solve collective action problems.
Some studies have proposed a life-cycle theory of the firm. Biological arguments in
economics go back at least to Marshall’s “trees in the forest” analogy. A life-cycle argument, for
example, has been offered to explain dividend payments (Fama and French, 2001; DeAngelo,
DeAngelo, and Stulz, 2006) and financing decisions (Berger and Udell, 1990). In these papers,
however, life cycles are defined based on specific patterns in firm profitability, investment
opportunities, and size, not age per se. According to our results, age itself could define the
page 5
To the best of our knowledge, ours is one of the first large-scale studies to address the
corporate aging phenomenon, at least in terms of its performance aspects (Agarwal and Gort,
1996, 2002, examine survival), and the first such study to document that aging exasperates
organizational rigidities and fosters rent-seeking behavior. It is also the first study to show that,
when investigating profitability or growth, corporate age is not simply a proxy for other variables
or a generic control variable, but a genuine phenomenon separate, for example, from
management age and industry age. Corporate geriatrics problems are real.
The paper is organized as follows. Section 2 describes the approach to measuring the
correlation between firm age and profitability. Section 3 discusses the data. Section 4
documents a negative relation between firm age and profitability. Section 5 examines the
robustness of that relation. Section 6 interprets the results within the context of our two aging
hypotheses. Section 7 explores a number of alternative interpretations implied by the literature
or suggested by economic logic. Finally, Section 8 concludes.
2. Firm age and profitability: the investigative design
In studying the relation between firm age and profitability, we want to differentiate that possible
influence from a number of obvious spurious relations implied by previous articles. In Cooley
and Quadrini (2001), for example, financial constraints prevent firms from raising all the funds
necessary for the marginal product of capital to equal its opportunity cost. Consequently, as
capital increases over time, its marginal product declines, and so does the firm’s rate of growth.
Clementi (2002) proposes a model that combines the industrial organization literature on firm
page 6
dynamic optimization model similar to that in Cooley and Quadrini (2001). The model is able to
predict the post-IPO decline in operating return on assets documented in Jain and Kini (1994).
According to this strand of the literature, age could be related to profitability because of financial
frictions.
The finance literature has also looked at age-related profitability issues, although from
different angles than ours. Pástor and Veronesi (2003) propose a risk argument. According to
this view, investors’ uncertainty lessens as the firm grows older (see also related arguments in
James and Wier, 1990; Berger and Udell, 1990). Consistent with that, the variability of stock
returns is negatively related with incorporation age (Adams, Almeida, and Ferreira, 2005) and
with listing age (Cheng, 2008). Declining risk implies declining required rates of return. Hence,
profitability could appear to deteriorate with age when in fact the driving factor is declining
uncertainty.
Other finance papers have uncovered an inverse relation between age and ownership
concentration (Holderness, Kroszner, and Sheehan, 1999; Helwege, Pirinsky, and Stulz, 2007;
Holderness, 2009). In principle, if ownership were positively related to profitability, this
regularity could induce a spurious negative relation between age and profitability. A spurious
relation could also be induced by the age and tenure of the managers within the organization
(Finkelstein and Hambrick, 1990; Graham, Harvey, and Puri, 2008). Finally, a relation between
age and profitability is suggested by the diversification literature, too. Over time, the reasoning
goes, as their original industries mature, firms may be forced to enter new industries. But
unrelated, or conglomerate, diversification harms profitability (see, among others, Campa and
Kedia, 2002; Villalonga, 2004). Age could therefore correlate with diversification, and thereby
page 7
These considerations, taking into account additional control variables that have been
suggested in the literature, imply a relation between firm profitability and age of the following
form:
Profitability = f(age, financial frictions, management age, management tenure, ownership
structure, risk, focus, size, capital expenditures)
We will estimate this relation with regression analysis. We hypothesize a negative,
possibly nonlinear relation between age and profitability. The initial specification we choose is a
quadratic function. We will switch to alternative specifications in the empirical section.
The remaining variables should have coefficients with the following signs. Financial
frictions should impair profitability (Clementi, 2002; Cooley and Quadrini, 2001). The same is
true for management age and tenure. Moreover, firms with concentrated ownership should have
a better handle on agency problems with managers and therefore perform better. The coefficient
of risk depends on the profitability measure we use. As explained later, we work with gross
profit margins, returns on assets (ROA), and Tobin’s Q ratios. Margins and ROAs should
correlate positively with risk (high risk, high return). The risk coefficient of Tobin’s Q,
however, should be zero in a cross section, since Tobin’s Q is a risk-adjusted measure of
performance. In addition to that, more focused firms should be more profitable. Furthermore,
profitability should be negatively related to firm size (Cooley and Quadrini, 2001) Finally, the
sign of capital expenditures cannot be assessed a priori (see, however, McConnell and
Muscarella, 1985). Firms that invest a lot may capture profitable growth opportunities and be
able to stem obsolescence, but they may also throw good money after bad.
page 8
3. Data
3.1. Sample description
The sample consists of all listed firms with data on CRSP, COMPUSTAT, and COMPUSTAT
Industry Segment between 1978 and 2004. Following Berger and Ofek (1995), among others,
we exclude firm-years with total sales of less than USD 20 million, firm-years with missing
values for total assets, and firm-years for which the sum of segment sales deviates from total
sales by more than 1 percent. Unlike other studies, however, ours includes firms with business
segments in the financial sector (SIC 6000–6999). The final sample consists of 10,930 firms and
82,845 firm-years, including 1,669 financials (6,644 firm-years).
We start with 2,285 firms in 1978 and end with 2,923 firms in 2004. Turnover is
remarkably high: 8,654 firms enter and 7,896 firms leave between 1978 and 2004. Some of the
firms that drop from the exchange may list again years later, for example in a reverse LBO. In
our approach, we treat them as separate firms. According to Fama and French (2004), only 145
firms go public between 1973 and 2001 after having gone private. We come back to this
potential sample-selection problem in the empirical analysis.
3.2. Firm age
We define firms as the corporations observed in practice. Our measures of age, therefore, refer
to the age of these legal entities. One could object that legal entities do not necessarily
correspond to what an economist would regard as firms. We acknowledge that problem. Still,
page 9
Shumway (2001) claims that the economically most meaningful measure of firm age is the
number of years since listing. That event is a defining moment in a company’s life. Not
surprisingly, listing affects ownership and capital structure, multiplies growth opportunities,
increases media exposure, and demands different corporate governance structures (Loderer and
Waelchli, 2010). Most studies that look at firm age, including Shumway (2001), Pástor and
Veronesi (2003), Fama and French (2004), and Chun et al. (2008), measure age in the same way.
Firm age is therefore the number of years (plus one) elapsed since the year of the
company’s IPO.2 We refer to this variable as the firm’s listing age. We add one year to avoid
ages of zero. The information is from CRSP. Since CRSP goes back to 1925, the oldest a firm
can be at the beginning of our sample period in 1978 is 54 years, compared with 80 years at the
end of it, in 2004. For a random subsample of 5,000 firms, we also compute the number of years
(plus one) elapsed since the year of incorporation and denote this variable as the firm’s
incorporation age. The information is hand-collected from Mergent Webreports.
Measuring age is not always straightforward, especially in the presence of mergers. Take
the case of the AOL Time Warner deal in 2000. One could assign the resulting firm a listing age
that starts in 2000, in 1992 (the CRSP inclusion date for AOL), or in 1964 (the CRSP inclusion
date for Time Warner). In keeping with the literature, we go with the date suggested by CRSP,
namely the year 2000. We come back to this problem further down and show that it does not
seem to affect our results.
2
More precisely, we approximate a firm’s year of birth with the earliest of: (a) the year in which the firm appears on CRSP; (b) the year in which the firm is included in COMPUSTAT; and (c) the year for which we find a link between CRSP and COMPUSTAT (based on COMPUSTAT data item LINKDT). If, for example,
a firm enters CRSP or COMPUSTAT in 1996, its age is one year at the end of 1996 (1+1996-1996) and five
page 10
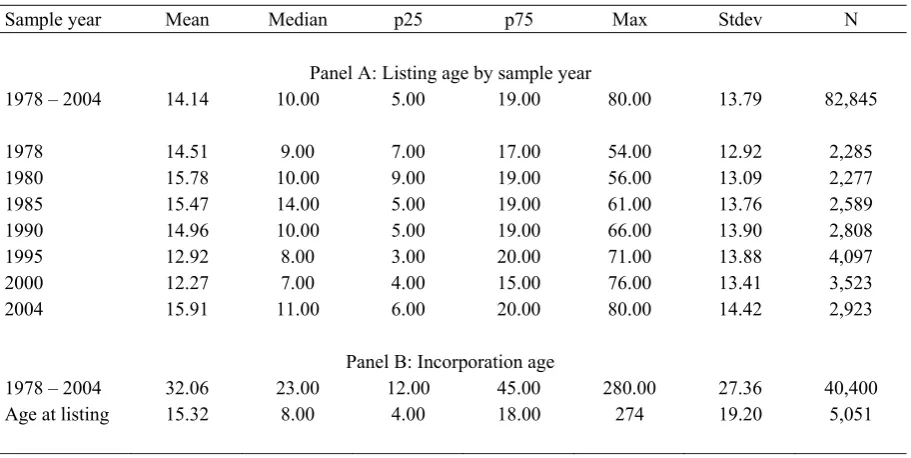
On average, listing age is 14 years; the median is 10 (Panel A of Table 1). The distribution
of firm age remains fairly stable over the sample period, except in the late 1990s, when the
median drops to 7, possibly as a result of the dot-com IPO wave. Panel B reports descriptive
statistics for incorporation age. The median firm is 23 years old and goes public at the age of 8.
3.3. Profitability measures and control variables
We measure profitability alternatively with gross margins, return on assets (ROA), and Tobin’s
Q. Whereas gross margins and ROA measure current profitability, Tobin’s Q reflects the
market’s expectations about future profitability. To account for industry-specific effects, the
three metrics are computed as arithmetic deviations from the median industry value (based on
two-digit SIC codes) in any given year. When interpreting the evidence, it is important to
remember this adjustment. Most firms are in one industry only. Hence, there is not much sense
constructing sales-weighted industry benchmarks. The results do not change when using the 48
industry grouping suggested by Fama and French (1997). To reduce the influence of outliers, we
follow Campbell, Hilscher, and Szilagyi (2008) and winsorize all variables at the 5th and 95th
percentile of their pooled distribution across all firm-years. This correction, however, is
immaterial.
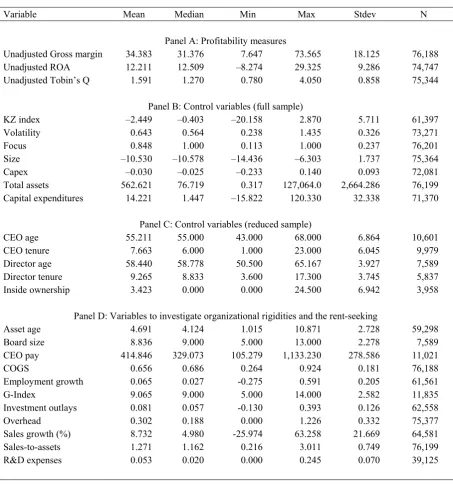
Table 2 reports descriptive statistics for all the variables in the analysis. Panel A is
dedicated to our three profitability measures.3 Panels B and C list the various control variables;
their definitions are in Table 12 at the end of the paper. Panel B, in particular, shows the
variables with data available for the full sample. Specifically, to assess financial constraints (KZ
3
The correlation between gross margins and ROA is 0.285; that between gross margins and Tobin’s Q is
page 11
index), we use an index similar to that of Kaplan and Zingales (1997). The results do not change
when we replace that index with alternative measures, such as financial leverage or a binary
variable that identifies dividend payers. Our proxy for risk is the annualized standard deviation
of the firm’s daily stock return (Volatility). A Herfindahl index based on the sales in the firm’s
different segments captures the degree of specialization (Focus). Firm size (Size) is measured
non-linearly, namely with the logged ratio of the firm’s market capitalization divided by that of
CRSP’s NYSE/AMEX/Nasdaq equal-weighted index (Campbell, Hilscher, and Szilagyi, 2008).
Lastly, the control variables include the firm’s capital expenditures net of depreciation (Capex),
standardized by the market value of its assets. For reading convenience, the descriptive statistics
refer to the unstandardized measures of firm size and capital expenditures.
These variables, together with year dummies, form our so-called standard regression
specification. Descriptive statistics about the age and tenure of CEOs and directors, as well as
data about ownership structure and corporate-governance quality are in Panel C. These variables
are available for only a limited subsample of firms, which is why we discuss them in a separate
panel of the table and do not include them in the standard regression. We examine their
relevance later in the analysis. Finally, Panel D shows descriptive statistics for variables used in
our subsequent discussion about organizational inertia and rent-seeking behavior; these variables
are also defined in Table 12.
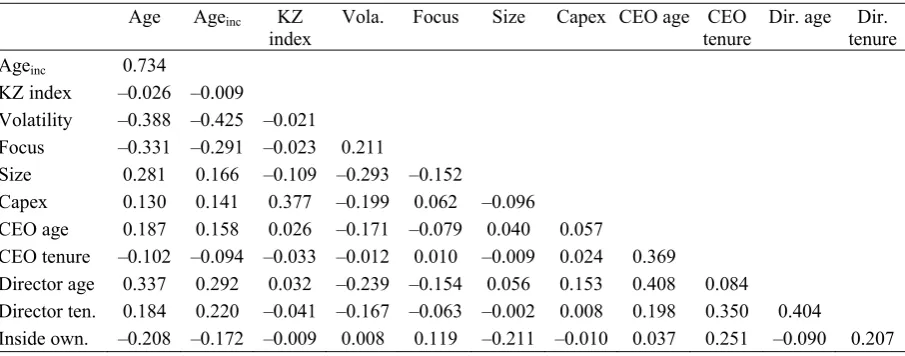
Table 3 computes pairwise correlation coefficients between the regression arguments.
Except for the correlation between listing and incorporation age, which equals 0.73, most
coefficients are fairly low. In no case is there any concern about collinearity (listing and
page 12
4. Firm age and profitability
To assess whether there is a relation between firm age and profitability, we estimate robust panel
regressions. This enables us to distinguish between cohort and true aging effects.
Cross-sectional OLS regressions are unable to make that distinction. This could explain why, in some
cases, OLS regressions find no relation between firm age and profitability (see, for example,
Villalonga and Amit, 2006).
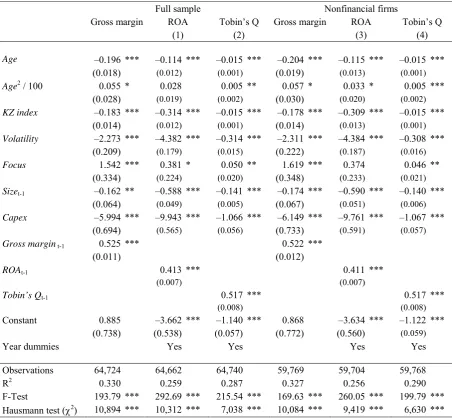
Table 4 shows the results for the standard regression. The Hausman specification test
reported at the bottom of the table prefers fixed to random effects. We therefore include
firm-fixed effects to account for firm heterogeneity, and add period-firm-fixed effects to capture the impact
of the overall state of the economy. We assume that the regression coefficients are the same
across industries and stationary over time. We come back to this assumption. Moreover, to
control for a possible omitted-variable problem, in addition to the firm-fixed effects we include
lagged profitability values in our regressions. If age also affects past profitability, however, this
correction makes it more difficult to find an age effect. As it turns out, with and without
correction, the results are qualitatively the same.
Regressions (1) to (3) in the table are estimated for the full sample; regressions (4) to (6)
exclude financial firms (SIC codes 6000–6999). The evidence suggests a significant inverse
relation between firm age and profitability, regardless of how we measure profitability. It should
be pointed out that, since we are controlling for firm size, this finding is unrelated to declining
returns to scale.
The linear age effect is statistically significant at the 1 percent level, irrespective of the
page 13
generally positive and significant. Profitability seems to have a convex relation with age. We
come back to this issue further down.
The numbers imply that profitability deteriorates from the very beginning. It is as if firms’
desire and motivation to succeed weaken very quickly. At first sight, this seems to reject the
existence of a life cycle of the firm. Our sample, however, includes only listed firms. To shed
light on a potential life cycle, we reestimate the regressions in Table 4 for the firms with negative
industry-adjusted profitability in the first year after listing. Presumably, these firms are still in
the early stages of their life cycle. The evidence supports this conjecture, especially when
measuring profitability with Tobin’s Q (not shown): the coefficient of Age is positive and
significant with confidence 0.95, whereas that of Age2 is negative and significant with
confidence 0.99. The turning point in this hump-shaped age-profitability relation is reached
around a listing age of 9. Firms in the early stages of the life cycle therefore seem to get better
with time, but eventually profitability falls. Relatively few firms, however, exhibit
below-industry profitability at the time of their IPO (see also Fama and French, 2004). We therefore do
not treat this subset of firms separately in the following investigation.
Coming back to Table 4, we find that the control variables have coefficients mostly in line
with the predictions. Financial constraints impair firm profitability (Lamont, Polk, and
Saá-Requejo, 2001). In contrast, strategic focus has a positive and significant effect on Tobin’s Q.
Unrelated diversification is therefore bad for business, consistent with the extant literature (see,
among others, Campa and Kedia, 2002; Villalonga, 2004). We also find that larger firms do
worse (see also Lang and Stulz, 2004) and so do firms with high stock volatility, which, in the
case of gross margins and ROA, is difficult to square with a risk argument. Higher capital
page 14
The two age covariates are highly collinear and the associated variance inflation factors by
far exceed the rule of thumb of 10, which could explain why the coefficient of Age2 is only
borderline significant. To get around this problem and find out more about the actual shape of
the age-profitability relation, we follow Morck, Shleifer, and Vishny (1988) and run piecewise
linear regressions that allow for changes in the age coefficient at age 5, 10, 20, and 30,
respectively. Age 5 defines the first quartile of the age distribution; 10 is the median age; 20 is
approximately the third quartile; about 10 percent of all observations are beyond age 30. We
therefore substitute Age and Age2 with the following variables:
Age.1to5 = Age if Age < 5, Age.6to10 = 0 if Age < 5;
= 5 if Age≥ 5; = (Age – 5) if 5 Age < 10,
= 5 if Age≥ 10;
Age.11to20 = 0 if Age < 10 Age.21to30 = 0 if Age < 20
= (Age–10) if 10 Age < 20; = (Age–20) if 20 Age < 30; = 10 if Age≥ 20; = 10 if Age≥ 30;
Age.over30 = 0 if Age < 30
= (Age–30) if Age≥ 20.
A firm age of 18 years, for example, would imply that Age.1to5 = 5; Age.6to10 = 5; Age.11to20
= 8; Age.21to30 = 0; and Age.over30 = 0.
The results are in Panel A of Table 5. For brevity, we report only the coefficients of the
five age covariates. Overall, the evidence confirms a negative relation between age and
profitability. Interestingly, there is no evidence of a U-shaped relation—performance does not
rebound at very old age. The relation, however, is convex, in the sense that the negative
marginal effect of age bottoms out over time. According to regressions (1) and (2), the
page 15
ten years and by roughly 0.15 (0.10) percentage points thereafter. Tobin’s Q (regression 3)
behaves similarly. The effect of age is not huge, but it is steady and it accumulates over time.
Note that we are controlling for past performance. If we exclude the lagged dependent variable,
the effect of age doubles (not shown). In that case, ROA (Tobin’s Q) drops by an annual 0.29
percentage points (0.08) during the first five years of life. Between ages 5 and 10, the annual
decline is still 0.21 percentage (0.04). Overall, during the first 20 years of life, the age effect eats
up a sizeable 3.3 percentage points in ROA and 0.6 in Tobin’s Q. The effect on gross margin is
similar. Our remaining investigation relies on piecewise linear measures of age.
5. Robustness tests
The results suggest a significant relation between firm age and profitability. What follows
probes the robustness of that relation. We ask whether the results change when we measure age
from the time of incorporation. We also examine the importance of a possible simultaneous
equations bias, the relevance of relistings and mergers in our definition of age, and how sensitive
the results are to the estimation technique. Moreover, we want to know whether the relation is
confined to specific time periods, and whether it is driven by the presence of many small firms in
the sample. Unless explicitly stated, our tables report only the coefficients of the age covariates
and their statistical significance.
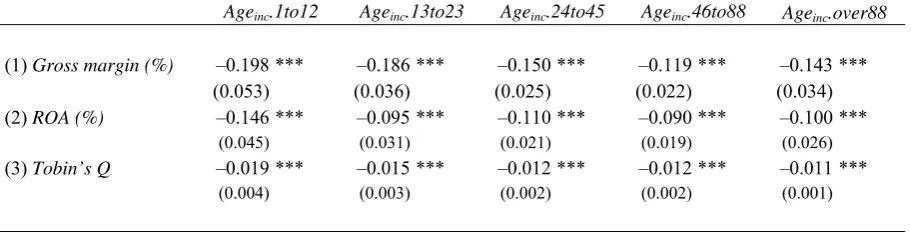
5.1. Incorporation age
The results are robust to age definition. In Panel B of Table 5, we reestimate the piecewise linear
page 16
percentiles as possible turning points as those used for listing age; hence, we allow the relation to
change at incorporation ages 12, 23, 45, and 88, respectively. The message of the evidence is
still that firm profitability weakens over time. Since the findings for listing age and
incorporation age are generally the same, what follows reports the results for only one age
definition. We choose listing age, because it is available for the full sample of firms.
5.2. Simultaneous equations bias
The results for incorporation age help us address the potential problem of simultaneous equations
bias. Whereas age could affect profitability, it could also be the other way around: profitability
could affect firm survival (Campbell, Hilscher, and Szilagyi, 2008; Jensen, 1986) and thereby
firm age. The problem is that this reverse effect cannot be sizable: profitability in year t of a
firm’s life has little effect on the probability of survival until that time, especially when we
measure age since the date of incorporation—the median incorporation age is 23. Hence,
simultaneous equations bias should not be of great concern.
5.3. Relistings and mergers
Another concern is relistings. As mentioned in the data section, we ignore the fact that some
firms relist after having gone private and classify them as newly listed companies. In principle,
since firms that relist are presumably doing well, our classification could make the average
profitability of older firms look worse than it really is, which could induce the negative age
page 17
important, as we just saw, the same results obtain when age is measured from the date of
incorporation. Older firms are not resurrected as young firms when they relist; they maintain
their incorporation age. Relisting, therefore, can hardly explain our results.
Mergers raise questions about the proper measurement of firm age, too. In some cases,
merged firms are treated by CRSP as new firms. To test whether this decision assigns good
performing firms to the cohort of young firms and makes them look better than they really are,
we repeat the analysis and drop all the firms that list in the year of their incorporation, since
these could be new firms that arise from a merger. The results, however, do not change (not
shown). Firm age and profitability remain negatively related.
5.4. Alternative specifications and estimation techniques
So far, we have used linear panel regressions with firm and time-fixed effects, and a lagged
dependent variable to estimate our standard regression. To see how crucial this estimation setup
is, we explore alternative specifications and estimation techniques.
In untabulated regressions, we control for financial leverage, dividend payments, and R&D
expenses. Leverage could reduce agency costs, lower taxes, or increase the costs of financial
distress (see, among many others, Harris and Raviv, 1991). Dividend payments could identify
more profitable firms (Fama and French, 2001) or financially unconstrained ones. And R&D
expenses are a proxy for growth opportunities (Mehran, 1995). The results do not change when
we include these variables. The same conclusion follows when measuring firm size with the
book value of assets, and when defining ROA as the ratio of NOPAT or income before
page 18
variables to allow for nonlinearities. Our conclusions stand—profitability seems to deteriorate
over time.
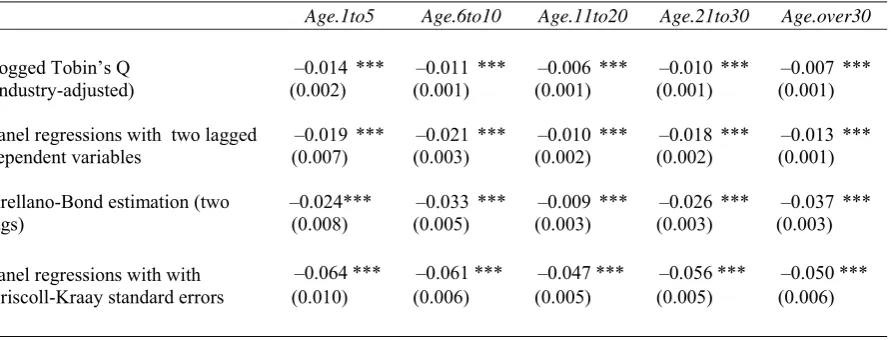
Table 6 explores additional specifications and alternative estimation procedures. First, we
use the logged value of profitability as the dependent variable to explore the importance of
skewness. Second, we allow for two lagged terms of the dependent variable. Third, we replicate
the analysis with the Arellano-Bond dynamic panel-data estimation approach, since the
unobserved individual panel-level effects could be correlated with the lagged dependent variable.
Finally, we estimate fixed-effect regressions with Driscoll and Kraay (1998) standard errors,
which are robust to very general forms of cross-sectional and temporal dependence.
Panel A in the table is dedicated to ROA, whereas Panel B deals with Tobin’s Q.
Regardless of performance measure and estimation technique, the data yield the same
conclusion, namely that corporate age is negatively related with profitability across the five age
intervals. All age coefficients are statistically significant with confidence 0.99.
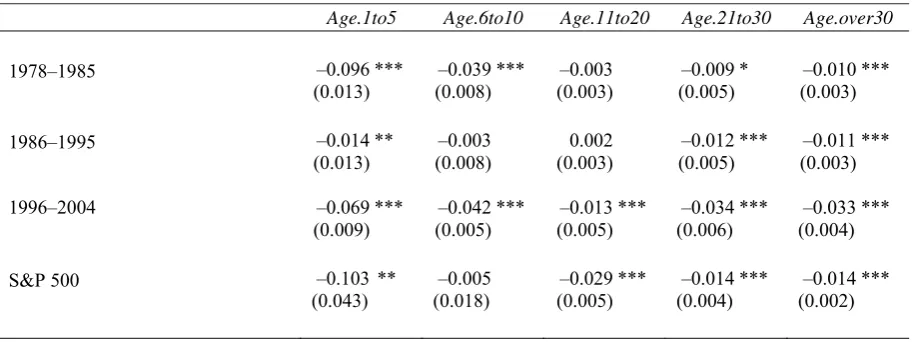
5.5. Different sample years and large firms
We also ask whether the results hold across different time periods. Table 7 shows the
coefficients of the age covariates if we replicate our standard regression for the years 1978–1985,
1986–1995, and 1996–2004, separately. In the case of ROA, the coefficients are mostly negative
and significant. The exception is the years 1986–1995, when the first five years of post-IPO life
are associated with higher ROA. The age coefficients in the Tobin’s Q regressions are almost
uniformly negative and significant, including in the years 1986–1995. Overall, the negative age
page 19
the correlation in question changes over time. Another possibility is that the sample’s
industry-composition varies in time, and that the correlation differs across industries.
The results could also be due to the presence of many small firms. To test this conjecture,
we repeat the estimation in Table 5 and limit the analysis to S&P 500 firms. However, age is
still negatively related with profitability, especially when we measure profitability with Tobin’s
Q. Note that this finding confirms that age effects are distinct from size effects.
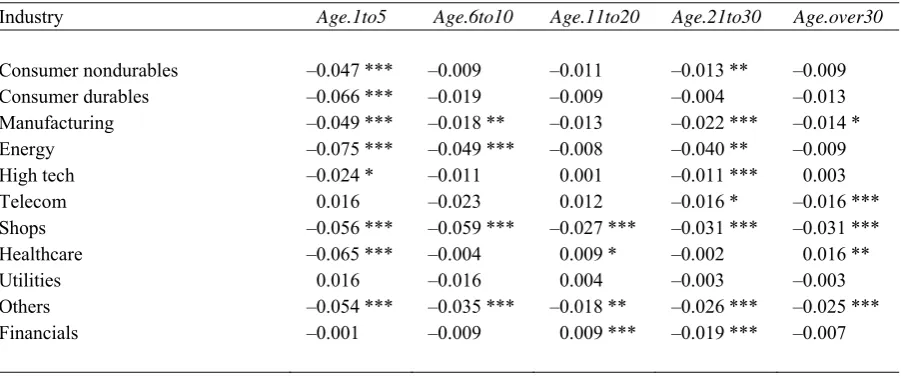
5.6. Industry-specific regressions
To find out more about the relation between age and performance at the industry level, we
replicate our standard regression with Driscoll and Kraay (1998) standard errors for individual
industries. Table 8 shows the results when sorting firms according to the ten industry
classification suggested by Fama and French (1997) (plus financials). Alternative industry
definitions yield similar results (not shown).
The results generally confirm the negative relation between age and profitability. With the
exception of utilities, the relation is negative and significant in each industry for at least one
measure of profitability. In the case of utilities, however, ROA increases over time. One
possible reason is that older firms have more clout with regulators.
A possible problem with the industry breakup of the sample is the number of observations.
To get around that problem, we reestimate our regression and measure all variables as deviations
page 20
particular year. The results show a highly significant relation between age and profitability
across all age intervals (not shown).
6. Interpretation: corporate aging
Overall, we find a significant and robust negative relation between firm age and profitability.
The question we want to pursue is what that relation means. We therefore inquire into the
possible economics of why age could harm performance, in spite of the possible learning effects
of older age. We offer two nonexclusive hypotheses of why that could happen, namely
organizational rigidities and rent seeking.4
6.1. Organizational rigidities
Age can have adverse effects on performance because of the organizational rigidities and inertia
it brings about (Carroll, 1983; Hannan and Freeman, 1984; Leonard-Barton, 1992; Barron, West,
and Hannan, 1994), a phenomenon that also impairs a firm’s ability to perceive valuable signals
(Kiesler and Sproull, 1982; Tripsas and Gavetti, 2000). The root of the problem could be the
tendency of firms to codify their success with organizational measures, rules of conduct, and best
practice. This behavior helps firms focus on their core competences and raise reliability and
accountability. Stressing the good to prevent the bad, however, can also make it hard to
recognize, accept, and implement change when doing so would be appropriate. Codification is a
slow process. The older the firm, the more capillary and suffocating the codification can be. If
4 There are other possible hypotheses we don’t consider. One of them is the proliferation of seniority rules and
page 21
so, age will reduce flexibility and discourage change.5 At the same time, whatever learning
benefits the firm captures in its established lines of business probably decline over time (Agarwal
and Gort,1996 and 2002). If so, older firms should tend to ossify and lose their competitive
edge.6
If organizational rigidities make it hard for firms to keep up with the competition, we
would expect a decrease in productive efficiency in older firms. If so, variable costs and
overhead expenses should increase with age. At the same time, market share should decline,
which means sales growth should lag behind that of the competition. Finally, if older firms are
truly unwilling to innovate, they should eventually engage in less research activities and invest
less. By implication, older firms should also tend to have antiquated machines, plants, and
equipment.
To find out, we estimate individual panel regressions of costs, sales growth, R&D, and
asset age on firm age. The control variables and the estimation technique are those used in Table
5. All dependent variables are measured as deviations from the median industry value in any
given year. To save space, we show only the coefficients of the age covariates and their
significance levels.
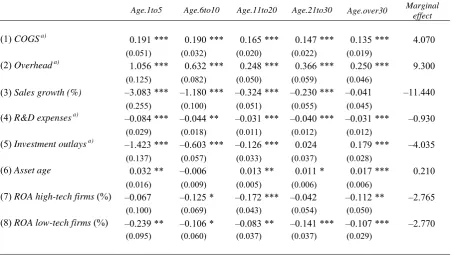
The results are shown in Table 9. The evidence is consistent with our predictions. Sales
growth slows as firms grow older. Moreover, cost of goods sold (COGS) and overhead expenses
go up. Finally, R&D and investment activities decline, and fixed assets become outdated. In the
5 There is a vast literature on organizational inertia. See, among others, Tripsas and Gavetti (2000) and the
literature cited therein.
6
Foster and Kaplan (2001) make a somewhat related argument based on the fear of making mistakes. They
contend that as corporations grow, they become weighted down by rules and procedures. Fear of
page 22
case of sales growth, the extant literature reports consistent results (see, for example, Evans,
1987; Caves, 1998; Chun et al., 2008).
The coefficients we compute are economically meaningful. For example, if we keep all
covariates at their median value and allow only age to vary, the numbers imply that a newly
listed firm’s sales growth exceeds that of the industry by 16.9 percentage points. After nine
years, growth falls below the industry median. The marginal effect of age is zero past age 30.
This latter result should be interpreted with care, since fewer than 10 percent of the firms live
longer than 30 years after their IPO. Hence, there are relatively few observations of
comparatively old firms, and the coefficient estimates we obtain are more easily affected by
outliers.
To assess the economic significance of the results, we can also compare each dependent
variable of interest at age 30 and age 5, keeping all the control variables at their median value.
The associated numbers are in the last column of Table 9. All differences are highly significant
and almost all of them are economically tangible. For example, old firms have a ratio of
cost-of-goods-sold to sales that is 4% higher than what we observe in young firms; given a sample
average of 65.6%, the difference would seem to be sizable. Similarly, the difference in overhead
as a ratio of firm value is a considerable 9.3% (the sample average ratio is 30.2%), that in sales
growth is 11.4% lower (the sample average ratio is 8.73%), and that in research and development
outlays as fraction of sales is 1.4% higher (compared to a sample average ratio of 5.3%). Also
the investment outlays are substantially lower in older firms; as a fraction of assets, they are
11.2% lower (the average fraction in the sample is 8.1%). Finally, firms tend to have older
page 23
We also examine whether aging is more pronounced in high-tech than in low-tech
industries and replicate Table 5 for these two industry groups separately (not shown). High-tech
firms might age faster because they are more exposed to competitive threats. To identify high-
and low-tech industries, we sort the 2-digit SIC industries according to their average
to-assets ratio across all sample years. Low-tech industries are those with relatively low
R&D-expenses, i.e., in the first tercile of that distribution. In contrast, we consider all industries in the
third tercile as high-tech. The last two rows of the table compare ROA across the two
subsamples. Aging is similar in the two groups. The same conclusion follows when examining
Tobin’s Q. Alternative definitions of high- and low-tech industries, including the classification
in Francis and Schipper (1999) and Fama and French (1997), yield the same conclusions.
High-tech firms might indeed be exposed to a higher risk of obsolescence, but they might also be
comparatively better at dealing with frequent technological changes.
6.2. Rent-seeking hypothesis
An alternative, nonexclusive, hypothesis draws on Olson (1982) and his theory of collective
action7 and can be summarized as follows. Collective action in society is difficult to come about
because it is costly. Moreover, the longer the time horizon, the more frequent the opportunities
for special interest groups, especially small ones, to come together. These organizations for
collective action often survive even if the good they once provided is no longer needed. Hence,
“stable societies with unchanged boundaries tend to accumulate more collusions and
organizations for collective action over time” (p. 41). The great majority of these special-interest
7
page 24
groups choose to redistribute income rather than to create it, as they bear the full cost of making
society more efficient, but get only a small fraction of the resulting gains.8 In comparison,
redistributive efforts are more beneficial even though they can make society as a whole worse
off—distributional coalitions do not bear the full costs of getting a larger slice of the social pie,
but they can claim the full benefit.
Olson’s logic can be extended to firms. Special-interest groups and coalitions are possible
in firms as well. Unless these groups are provided the proper incentives by effective corporate
governance, they are formally in the same situation as distributional coalitions in society are.
Organizing a collective good that benefits the whole firm is often less beneficial than
appropriating income and resources—including the pursuit of a quiet life (Bertrand and
Mullainathan, 2003). The older the firm, the greater are the chances that these coalitions have
formed. If distributional coalitions survive, rent-seeking behavior will be more widespread in
older firms.
Some of the testable propositions that follow from the rent-seeking hypothesis are the same
as those that follow from the organizational-rigidities hypothesis—the two hypotheses are not
mutually exclusive. For example, Bertrand and Mullainathan (2003) show that poorly governed
managers strive to avoid difficult restructuring and expansion decisions. Consequently, lower
R&D expenses and investment outlays in older firms are consistent with the rent-seeking
hypothesis as well, simply because they involve effort and risk. The hypothesis, however,
implies a number of additional testable propositions.
8
Grossman and Hart (1980) make a similar argument to explain minority shareholders’ reluctance to monitor
page 25
Specifically, if rent seeking is more pervasive in older firms, it must be because corporate
governance allows it. If we look at the governance index from Gompers, Ishii, and Metrick
(2003), we consequently expect the scores of older firms to be higher (high index values reflect
poorer governance). Moreover, we would expect larger boards in older firms, since the literature
suggests that larger boards reflect poorer governance (Yermack, 1996; Eisenberg, 1998). Larger
boards could either favor rent seeking or be one of the ways quasi-rents are dissipated.
Furthermore, if corporate governance is weaker in older firms, then managers should take
advantage of it. We therefore investigate whether CEO pay is higher in older firms. Finally, we
test whether the managers of older firms slow the growth in the labor force, possibly to make the
existing jobs safer. Bertrand and Mullainathan (2003) suggest that managers care more about
workers to buy peace with them.
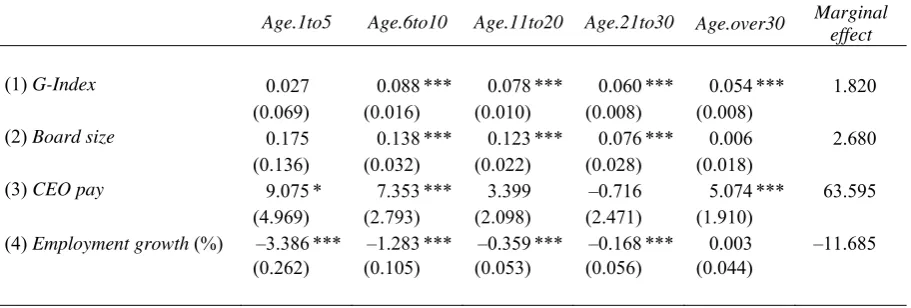
Table 10 examines these predictions. As before, all dependent variables are measured as
deviations from their industry median. For example, G-Index equals the actual Gompers, Ishii,
and Metrick (2003) index value for the firm minus the median index value in the company’s
two-digit SIC industry. To avoid clutter, the table lists only the coefficients of the age covariates and
their significance levels.
The evidence is consistent with the rent-seeking hypothesis. The corporate governance
index worsens significantly with age, and board size increases,9 in agreement with an
environment conducive to agency problems in older firms. Field and Karpoff’s (2002) results
that large seasoned corporations deploy defenses at a higher rate than IPO firms would seem to
be congruent.
9
The literature has investigated the relation between age and board size in IPO firms with mixed results
page 26
The evidence also confirms the existence of apparent agency problems: all other things
being equal, total CEO compensation in real 1978 dollars goes up with age. The annual increase
is limited, but it accumulates to a sizable number. For example, the first five years after the IPO
add $9,000 to the CEO pay every year, and the next five add another $7,000. Ignoring time
value of money, this means that the CEO of a firm at the end of its tenth year of listing makes
$80,000 in real terms more than his peers in the industry. This result is robust to the inclusion of
CEO age and tenure as additional controls in the regression (not shown). Hence, even though
performance slows, CEOs end up making more money as firms grow older. The age effect in
CEO compensation becomes even stronger when we control for profitability (not shown). In that
case, compared to the CEO of a newly listed firm, the CEO of a ten-year old company earns
approximately $120,000 more. Given that the median CEO pay in the sample is $328,000 in
1978 dollars, this age effect seems quite substantial.
We also find that employment grows more slowly in older firms. Combined with the
evidence of lower R&D and investment efforts we just saw, this could reflect the quieter life that
the managers of older firms might strive for—or their inability to keep pace with the
competition. We should stress that we are controlling for firm size. Hence, the result is not the
reflection of diminishing economies of scale.
As before, we can gauge the economic importance of the results by comparing 30-year old
firms with 5-year old ones. The last column in Table 10 performs that comparison. Governance
quality has about two index points more in older firms. Since the median index value in the
sample is 9 and the minimum is 5, the difference would seem to be economically substantial.
With almost three additional directors, board size is also larger in older firms—according to
page 27
findings are conditional on firm size. Similarly, CEO pay is almost 64 thousand real 1978
dollars higher and employment growth 11.7 percent lower.
On the whole, the evidence supports the existence of a corporate aging phenomenon along
the economic logic we suggested. We should stress that, under both hypotheses, there is a causal
relation between firm age and poorer performance. Under the organizational-rigidities
hypothesis, it is time itself that enables a capillary codification of processes and ideas, leads to
ossification, and progressively weakens the ability of the firm to respond to competitive threats.
Similarly, under the rent-seeking hypothesis, it is time that enables the coalescing of an
increasing number of interest groups and factions within the firm.
7. Alternative hypotheses
There are several alternative hypotheses that could explain our findings. What follows
examines a number that were suggested to us. We therefore inquire whether our findings are
driven by firms in the early years after their IPO, investor uncertainty, ownership structure,
industry age, age of management, and sample selection. We focus our discussion on
profitability.
7.1. Is the age effect a reincarnation of post-IPO regularities?
Jain and Kini (1994) and Fama and French (2004) report that operating profitability deteriorates
after the IPO. Conceivably, firms list when they think they are at the peak of performance (see,
page 28
should not be surprising that profitability deteriorates after the IPO. It’s unclear, however, how
optimal timing can explain a negative piecewise relation between age and profitability as many
as 20 years after the IPO. Moreover, the same results obtain when we measure age from the date
of incorporation rather than that of listing. We are not claiming that there is no IPO timing. All
we are saying is that there is more than simply IPO timing to the data, and that the evidence is
consistent with a phenomenon of corporate aging. In fact, the IPO effect could be an aging
effect.
7.2. Is the age effect a manifestation of declining uncertainty?
Pástor and Veronesi (2003) argue that uncertainty about a firm’s average future profitability
should decline over time as investors learn more about the firm. Consistent with the model, and
using firm age as a proxy for learning, the paper finds that younger firms have higher M/B ratios.
At least two observations, however, cast doubts on a pure uncertainty interpretation of the age
effect we observe. First, the age effect is not limited to a valuation multiple but extends, as we
have seen, to other profitability measures (ROA and margins), sales growth, cost structures, and
investment outlays, among others. Resolution of investor uncertainty cannot explain these
findings. Second, the age effect in our Tobin’s Q regressions does not disappear even though we
control for stock-return volatility in our standard regression. This suggests that there is more to
page 29
7.3. Is the age effect a manifestation of declining ownership concentration?
The empirical literature finds a negative relation between ownership concentration and firm age.
At the same time, ownership could correlate positively with profitability. Conceivably,
increasing age could simply be a proxy for declining ownership concentration.
To find out whether this is so, we use blockholder data from Dlugosz et al. (2006) for the
years 1996 to 2001. There are matching data for 1,180 firms (3,992 firm-years). Consistent with
previous studies, we find that ownership concentration is lower in older firms (Panel A of Table
11). We then replicate the analysis in Table 5, extending the standard regression specification
with the cumulative fraction of shares controlled by the firm’s officers and directors (Inside
ownership) and its squared value. The coefficients of the age covariates remain generally
negative (regression 1 of Table 11B). The same conclusion follows when we control for the stake
of the largest shareholder, the blockholders as a group, and the outside shareholders (not shown).
Overall, therefore, it is difficult to claim that firm age is a surrogate for ownership concentration.
At the same time, these results suggest that the decline in the quality of corporate governance we
have observed above is a phenomenon that cannot be explained by declining ownership
concentration alone.
We repeat the analysis by excluding closely held firms, namely those where Inside
ownership is larger than 20 or, alternatively, 30 percent. This procedure should filter out a large
proportion of family firms. The results are unaffected, which suggests that the age-profitability
relation is not tied to a loosening of family control over time, either (not shown). Consistent
with this argument, Anderson and Reeb (2003) find that the log of firm age (measured since
page 30
In this context, we should mention the monitoring model by Clementi, Cooley, and Di
Giannatale (2009). The model predicts a decline in the value of entrepreneurial firms after they
are started. Yet the model does not seem to apply to listed firms and their performance after
listing.
7.4. Industry age
One could argue that older firms are more likely to operate in relatively old and unattractive
industries. Therefore, the relation between firm age and performance could simply reflect a
negative link between industry age and performance. Yet our performance measures are
industry-adjusted, so industry age cannot explain our results.
7.5. Is the age effect a manifestation of older people in the organization?
Faleye (2007) observes a negative relation between director age and Tobin’s Q. If older firms
are managed by older people, firm age could be a proxy for the age of managers and directors.
To find out whether it is the age of the organization or that of its people that impairs profitability,
we collect age and tenure data for the sample firms’ CEOs and directors. The information is
from RiskMetrics and ExecuComp, respectively. We find matching data for 1,830 CEOs (11,447
firm-years) in 1992–2004 and for 1,896 boards (8,176 firm-years) in 1996–2004.
Panel A of Table 11 shows that the CEOs and the directors of older firms are indeed older
themselves, although only marginally so; moreover, they have been with the company a bit
page 31
firms, he is 53. Similarly, directors of older firms are 59, on average, whereas in younger firms
they are 56. We stress that these differences are fairly small. Not surprisingly, when we include
these variables in our standard regression from Table 5, the results do not change. The analysis
covers a subsample of 806 firms (2,134 firm-years) during the years 1998 to 2001. There is a
negative relation between director tenure and performance, but we still find an overall negative
relation between firm age and Tobin’s Q (regressions 2, 3, and 4 of Table 11B). The same
conclusions follow when measuring performance with ROA (not shown). The results remain the
same also when adding the squared value of the CEO’s and the directors’ age, as well as the
squared value of their tenure (not shown).
In a related test, we wanted to know whether young CEOs are able to turn things around in
older firms. Hence, we repeated the standard regression in Table 5 and focused on firms where
the CEO’s tenure is shorter than 4 years. The results do not change. Young CEOs alone are
apparently unable to solve the corporate aging problem.
7.6. Is the age effect an expression of sample selection?
Survival bias could also explain our results.10 Let us illustrate this interpretation with an
analogy. Firms can be thought of as antelopes. In our story, the M&A market plays the role of
lions that feed on antelopes. We can assume that young antelopes taste better than old ones.
Suppose now the agility of antelopes is a random variable independent of age. If so, the young
antelopes that survive will tend to be more agile than the old survivors, simply because the weak
among them, especially the young ones, will be caught and eaten by the lions. Natural selection
10
page 32
will therefore induce a negative relation between agility and the age of the antelopes. The same
happens in the M&A market, since poor performers are less likely to survive and since young
firms seem to be more attractive takeover targets (Loderer, Neusser, and Waelchli, 2009). This
more radical weeding out of poor performers in the cohort of young firms could therefore induce
the negative relation between profitability and firm age we observe, even if unconditional firm
profitability is unrelated to firm age.
To discriminate between this lion hypothesis (a sample-selection hypothesis) and our claim
that it is age itself that reduces profitability, we replicate our regressions for the firms in the
sample with superior profitability (i.e., above the industry median in any given year). Since lions
supposedly feed on the weaker antelopes, they should have no or a significantly weaker effect on
the observed mean agility of the faster antelopes. By analogy, natural selection in the market for
corporate control should have no direct effect on the observed mean profitability of the better
firms. As it turns out, our results are unchanged: there is still a strong negative relation between
(incorporation and listing) age and performance. Even the better among the older firms fail to
keep up with the competition (Panel C of Table 11).
8. Conclusions
In life, almost everything gets old and obsolete. This paper asks whether firms suffer the same
fate and become inefficient as time goes by. A priori, it’s unclear what one should expect. If
anything, aging should decrease costs because of various learning effects within the firm and
learning spillovers from other firms in the same or in other industries. We start by looking for a
page 33
relation, which is quite robust with respect to different estimation techniques, regression
specifications, and the way we measure firm age. In the second part of the investigation, we look
into the economics of aging and offer two nonexclusive hypotheses why firms could age, namely
organizational rigidities and rent seeking.
The evidence is consistent with both rationales. COGS and overhead expenses go up,
growth slows down, and R&D expenses and capital expenditures fall behind the industry
median, which is consistent with the existence of organizational rigidities. Also, as predicted by
the rent-seeking hypothesis, corporate governance worsens, boards grow, and CEO pay goes up.
These results cannot be explained with alternative interpretations of the data. In particular,
corporate aging is distinct from factors such as concave investment opportunity sets, uncertainty,
ownership structure, age of officers and directors, and industry age.
Taken together, these findings are consistent with the existence of a real corporate aging
problem. As far as we know, this is the first large-scale study to address the issue of corporate
aging in its various performance-related dimensions, and the first such study to relate that
phenomenon to organizational rigidities and rent seeking. Corporate aging raises many
fascinating questions we have to leave for future research. One avenue of further inquiry is a
better understanding of why corporate governance is apparently unable to deal with this problem.
A second question is what happens to obsolete firms and their resources: do they waste away or
does the market for corporate control dispose of them (Jensen, 2000)? Finally, a third area of
page 34
References
Adams, R. B., H. Almeida, and D. Ferreira. 2005. Powerful CEOs and their impact on corporate performance. Review of Financial Studies 18:1403-1432.
Agarwal, R., and M. Gort. 1996. The evolution of markets and entry, exit and survival of firms.
Review of Economics and Statistics 78:489-498.
Agarwal, R., and M. Gort. 2002. Firm product life cycles and firm survival. American Economic Review 92:184-190.
Anderson, R. C., and D. M. Reeb. 2003. Founding-family ownership and firm performance: Evidence from the S&P 500. Journal of Finance 58:1301-1328.
Baker, G. P., and R. E. Kennedy. 2002. Survivorship and the economic grim reaper. Journal of Law, Economics, and Organization 18:324-361.
Barron, D. N., E. West, and M. T. Hannan. 1994. A time to grow and a time to die: Growth and mortality of credit unions in New York City, 1914-1990. The American Journal of Sociology
100:381-421.
Berger, A. N., and G. F. Udell. 1990. Relationship lending and lines of credit in small firm finance. Journal of Business 68:351-381.
Berger, P., and E. Ofek. 1995. Diversification's effect on firm value. Journal of Financial Economics 37:39-65.
Bertrand, M., and S. Mullainathan. 2003. Enjoying the quiet life? Corporate governance and managerial preferences. Journal of Political Economy 111:1043-1075.
Bhak, B.-H., and M. Gort. 1993. Decomposing learning by doing in new plants. Journal of Political Economy 101:561-583.
Bhattacharjee, A., C. Higson, S. Holly, and P. Kattuman. 2009. Macroeconomic instability and business exit: Determinants of failures and acquisitions of UK firms. Economica 76:108-131.
Boone, A. L., L. C. Field, J. M. Karpoff, and C. G. Raheja. 2007. The determinants of corporate board size and composition: An empirical analysis. Journal of Financial Economics 85:66-101.
Brüderl, J., and R. Schüssler. 1990. Organizational mortality: The liabilities of newness and adolescence. Administrative Science Quarterly 35:530-547.
Campa, J. M., and S. Kedia. 2002. Explaining the diversification discount. Journal of Finance
57:1731-1762.
Campbell, J. Y., J. Hilscher, and J. Szilagyi. 2008. In search of distress risk. Journal of Finance
page 35
Carroll, G. R. 1983. A stochastic model of organizational mortality: Review and reanalysis.
Social Science Research 12:303-329.
Caves, R. E. 1998. Industrial organization and new findings on the turnover and mobility of firms. Journal of Economic Literature 36:1947-1982.
Chemmanur, T., S. He, and D. Nandy. 2008. The going public decision and the product market.
Review of Financial Studies:forthcoming.
Cheng, S. 2008. Board size and the variability of corporate performance. Journal of Financial Economics 87:157-176.
Chun, H., J.-W. Kim, R. Morck, and B. Yeung. 2008. Creative destruction and firm-specific performance heterogeneity. Journal of Financial Economics 89:109-135.
Clementi, G. L. 2002. IPOs and the growth of firms. Working paper, Carnegie Mellon University.
Clementi, G. L., T. F. Cooley, and S. B. Di Giannatale. 2009. A theory of firm decline. Working paper, New York University and CIDE.
Coles, J. L., N. D. Daniel, and L. Naveen. 2008. Boards: Does one size fit all? Journal of Financial Economics 87:329-356.
Cooley, T. F., and V. Quadrini. 2001. Financial markets and firm dynamics. American Economic Review 91:1286-1310.
DeAngelo, H., L. DeAngelo, and R. M. Stulz. 2006. Dividend policy and the earned/contributed capital mix: A test of the life-cycle theory? Journal of Financial Economics 81:227-254.
Dlugosz, J., R. Fahlenbach, P. Gompers, and A. Metrick. 2006. Large blocks of stock: Prevalence, size, and measurement. Journal of Corporate Finance 12:594-618.
Driscoll, J., and A. Kraay. 1998. Consistent covariance matrix estimation with spatially dependent data. The Review of Economics and Statistics 80:549-560.
Dunne, T., M. Roberts, and L. Samuelson. 1989. Firm entry and postentry performance in the U.S. chemical industries. Journal of Law and Economics 32:233-271.
Eisenberg, T., S. Sundgren, and M. T. Wells. 1998. Larger board size and decreasing firm value in small firms. Journal of Financial Economics 48:35-54.
Evans, D. S. 1987. The relationship between firm growth, size, and age: Estimates for 100 manufacturing industries. Journal of Industrial Economics 35:567-581.
page 36
Fama, E. F., and K. R. French. 1997. Industry costs of equity. Journal of Financial Economics
43:153-193.
Fama, E. F., and K. R. French. 2001. Disappearing dividends: Changing firm characteristics or lower propensity to pay? Journal of Financial Economics 60:3-43.
Fama, E. F., and K. R. French. 2004. New lists: Fundamentals and survival rates. Journal of Financial Economics 73:229-269.
Field, L. C., and J. M. Karpoff. 2002. Takeover defenses of IPO firms. Journal of Finance
57:1857-1889.
Finkelstein, S., and D. C. Hambrick. 1990. Top-management-team tenure and organizational outcomes: The moderating role of managerial discretion. Administrative Science Quarterly
35:484-503.
Foster, R., and S. Kaplan. 2001. Creative Destruction: Why Companies That Are Built to Last Underperform the Market – and How to Successfully Transform Them. New York: Random House.
Francis, J., and K. Schipper. 1999. Have financial statements lost their relevance? Journal of Accounting Research 37:319-352.
Gompers, P., J. Ishii, and A. Metrick. 2003. Corporate governance and equity prices. The Quarterly Journal of Economics 118:107-155.
Graham, J. R., C. R. Harvey, and M. Puri. 2008. Managerial attitudes and corporate actions. Working paper, Duke University and NBER.
Grossman, S. J., and O. D. Hart. 1980. Takeover bids, the free-rider problem, and the theory of the corporation. The Bell Journal of Economics 11:42-64.
Hannan, M. T. 1998. Rethinking age dependence in organizational mortality: Logical formalizations. The American Journal of Sociology 104:126-164.
Hannan, M. T., G. R. Carroll, and L. Pólos. 2003a. A formal theory of resource partitioning. Working paper, Stanford University.
Hannan, M. T., G. R. Carroll, and L. Pólos. 2003b. The organizational niche. Sociological Theory 21:309-340.
Hannan, M. T., and J. Freeman. 1984. Structural inertia and organizational change. American Sociological Review 49:149-164.
Harris, D., and A. Raviv. 1991. The theory of capital structure. Journal of Finance 46:297-355.
page 37
Holderness, C. G. 2009. The myth of diffuse ownership in the United States. Review of Financial Studies 22:1377-1408.
Holderness, C. G., R. S. Kroszner, and D. P. Sheehan. 1999. Were the good old days that good? Changes in managerial stock ownership since the great depression. Journal of Finance 54:435-469.
Hopenhayn, H. A. 1992. Entry, exit and firm dynamics in long run equilibrium. Econometrica
60:1127-1150.
Jain, B. A., and O. Kini. 1994. The post-issue operating performance of IPO firms. Journal of Finance 49:1699-1726.
James, C. M., and P. Wier. 1990. Borrowing relationships, intermediation, and the cost of issuing public securities. Journal of Financial Economics 28:149-171.
Jensen, M. C. 1986. Agency costs of free cash flow, corporate finance, and takeovers. The American Economic Review 76:323-329.
Jensen, M. C. 2000. A Theory of the Firm: Governance, Residual Claims, and Organizational Forms. Cambridge, MA: Harvard University Press.
Jovanovic, B. 1982. Selection and the evolution of industry. Econometrica 50:649-670.
Kaplan, S. N., and L. Zingales. 1997. Do financing constraints explain why investment is correlated with cash flow? Quarterly Journal of Economics 112:168-216.
Kiesler, S., and L. Sproull. 1982. Managerial response to changing environments: perspectives on problem sensing from social cognition. Administrative Science Quarterly 27:548-570.
Lamont, O., C. Polk, and J. Saá-Requejo. 2001. Financial constraints and stock returns. Review of Financial Studies 14:529-554.
Lang, L. H. P., and R. M. Stulz. 1994. Tobin's q, corporate diversification, and firm performance.
Journal of Political Economy 102:1248-1280.
Leonard-Barton, D. 1992. Core capabilities and core rigidities: A paradox in managing new product development. Strategic Management Journal 13:111-125.
Link, J. S., J. M. Netter, and T. Yang. 2008. The determinants of board structure. Journal of Financial Economics 87:308-328.
Loderer, C., K. Neusser, and U. Waelchli. 2009. Firm age and survival. Working paper, University of Bern, Switzerland.