Liver fibrosis recognition using multi-compression
elastography technique
Ashraf Ali Wahba, Nagat Mansour Mohammed Khalifa, Ahmed Farag Seddik, Mohammed Ibrahim El-Adawy
Faculty of Engineering, Biomedical Engineering Department, Helwan University, Helwan, Cairo, Egypt Email: [email protected], [email protected], [email protected],
Received 6 September 2013; revised 8 October 2013; accepted 19 October 2013
Copyright © 2013 Ashraf Ali Wahba et al. This is an open access article distributed under the Creative Commons Attribution License, which permits unrestricted use, distribution, and reproduction in any medium, provided the original work is properly cited.
ABSTRACT
Liver fibrosis recognition is an important issue in dia- gnostic imaging. The accurate estimation of liver fi- brosis stages is important to establish prognosis and to guide appropriate treatment decisions. Liver biop- sy has been for many years the reference procedure to assess histological definition for liver diseases. But biopsy measurement is an invasive method besides it takes large time. So, fast and improved methods are needed. Using elastography technology, a correlation technique can be used to calculate the displacement of liver tissue after it has suffered a compression force. This displacement is related to tissue stiffness, and liver fibrosis can be classified into stages according to that displacement. The value of compression force af- fects the displacement of tissue and so affects the re- sults of the liver fibrosis diagnosing. By using finite ele- ment method, liver fibrosis can be recognized directly within a short time. The proposed work succeeded in recognizing liver fibrosis by a percent reached in av- erage to 86.67% on a simulation environment.
Keywords:Liver Fibrosis; Liver Cirrhosis; Liver
Inflammation; Hook’s Law; Correlation; Elastography and Liver Fibrosis Recognition
1. INTRODUCTION
This paper introduces an algorithm for recognizing liver fibrosis stage. Liver fibrosis is the imbalance of the syn- thesis and decomposition of the collagens and extra cel- lular matrix (ECM) caused by liver cell inflammation and necrosis [1,2]. This imbalance causes proliferation of con- nective tissue in the liver. In the normal liver, every gram of liver tissue contains about 5.5 to 6.5 mg of collagen, while in cirrhotic liver it can be higher than 20 mg [1].
When the connective tissue start to proliferate in the portal area, this process is called fibrosis, which is the liver’s repairing reaction to liver cell injuries and inflam- mation. Cirrhosis is the end result of liver fibrosis. In the cirrhotic liver, the fibrous septa and regenerative nodule occur and the structure of the normal liver deteriorates. When fibrosis progresses to the cirrhotic stage, it can cause portal vein hypertension and many other complica- tions. The progression of fibrosis in cirrhotic liver can push compensated liver functions to become de-compen- sated. When cirrhosis advances to the decompensated stage, portal vein hypertension, liver atrophy, ascites, he- patic encephalopathy, and other serious dysfunctions can lead to liver failure [1,3]. In order to evaluate the stage of fibrosis, liver biopsy is the main method which can be used today. According to biopsy measurements, liver in- flammation can be diagnosed in grades as A0 to A3 where; Ao; none, A1; mild, A2; moderate, and A3 is the severe in-
flammation. Also, the stages of fibrosis F0 to F4 are as fol-
lows: F0, no fibrosis; F1, portal fibrosis without septa; F2,
portal fibrosis with few septa; F3, numerous septa with-
out cirrhosis; and F4, cirrhosis. Some previous works
measure liver stiffness related to each stage of liver fi- brosis and liver inflammation from liver biopsy. For liver inflammation stages in hepatitis C virus (HCV) mono-in- fected patients A0, A1, A2, and A3, the mean values of li-
ver stiffness in Kilo Pascal (KPa) are 4.8, 6.4, 9.4, and 12.6 respectively. Also, for liver fibrosis stages F0-F1, F2, F3, and F4, the mean values of liver stiffness in (KPa) are
tion between deformed and un-deformed liver images, a displacement of tissue motion can be calculated. Then, the stiffness of liver tissue can be classified according to this displacement which will vary from a stage to another in liver fibrosis. Based on that the time needed for deter- mining, the patient liver fibrosis stage will be decreased.
2. MATERIALS AND METHOD
The proposed work is to determine the human liver fi- brosis (F0,1, F2, F3, or F4) using multi-compression force
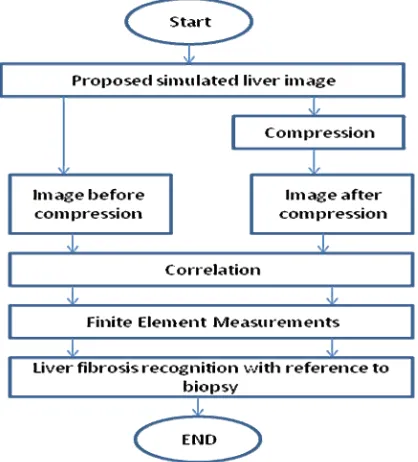
elastography technique. The proposed recognition algo- rithm is shown in Figure 1. This algorithm composes of
the following five basic steps: 1) Initialization step.
2) Simulation of liver fibrosis images. 3) Applying of compression forces. 4) Image correlation.
5) Liver fibrosis recognition.
2.1. Initialization Step
[image:2.595.69.278.489.720.2]The ultrasound of liver was discussed in various works [7-9]. Many previous works concentrated on studying li- ver fibrosis through biopsy measurements which is the main reference measurements in liver fibrosis diagnosing [10-14], and other works focused on ultrasound imaging of liver fibrosis [15,16]. Phantoms can be used to mim- icking the soft tissue and other parts in human body, to be tested using ultrasound imaging. These phantoms used to assess the accuracy of using ultrasound imaging in tu- mor diagnosing [17-19]. In our proposed work we use an elastography technique which based on a multi-com- pression force. It is assumed that liver fibrosis stiffness
Figure 1. Block diagram of Liver fibrosis recognition.
values were calculated before from biopsy measurements, and these values will be used as references when staging liver fibrosis from elastography images. Liver fibrosis stages F0,1, F2, F3, and F4 are assumed also to have stiff-
ness values of E1, E2, E3, and E4 respectively. As stages F0 and F1 are near to each other, then E1 can represent
their stiffness value.
2.2. Simulation of Liver Fibrosis Images
Finite element method (FEM) using ABAQUS software is the source of simulated liver fibrosis images [20-22]. Finite element model of liver fibrosis is represented as shown in Figure 2. A reference material such as a silicon
rubber with stiffness of Er= 5 (KPa) is assumed to be
near that of soft tissue stiffness value to get impedance matching and good power performance. This reference material is put between the modeled soft tissue and the compression force surface to be used as a main reference layer for stiffness measurements. In ABAQUS software, the stiffness of the simulated materials are chosen, where, the stiffness of a reference material is assumed to be 5 (KPa), soft tissue material is assumed to be 5.5 (KPa), and liver fibrosis materials are assumed to be (in KPa) 6.6, 7.4, 11, and 17.2 for F0,1, F2, F3, and F4 respectively
[1].
2.3. Applying of Compression Forces
A suitable compression force is applied on the model, then, a deformation will be measured. The images before and after compression, will be taken to be correlated as described in the next section.
2.4. Image Correlation
Digital image processing is a main tool to describe image details and image features [23,24]. To differentiate be- tween compressed and un-compressed images, a digital image correlation technique may be used as an important section in digital image processing [25-27].
The steps of using the two dimension (2D) digital im- age correlation in this proposed work are as follows:
Figure 2. Representation of finite element model of liver fibro- sis (Ex), where Ex is one of the stiffness values of E1, E2, E3, or
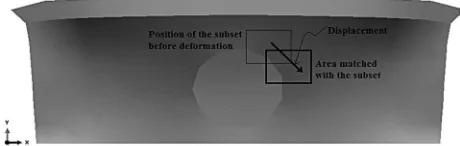
[image:2.595.308.539.602.698.2] Input to the correlation function [28,29] the deformed (compressed) and un-deformed (un-compressed) im- ages for correlation, and assign the first image (un- deformed or un-compressed) as a reference image for correlation as shown in Figure 3. This figure contains
three parts, one of them is the reference part, the sec- ond part is a soft tissue that represents the normal liver, and the third part is the liver fibroses.
The correlation function is used to match a subset from the reference image to another in the second de- formed image as shown in Figure 3 and can be writ-
ten as follows in Equation (1) [28,29]
, , ,* *
,
*, *
R x y x y
F x y G x y (1) Where F(x, y) and G(x*, y*) represent the gray levels
within the subset of the un-deformed and deformed images respectively. R is the magnitude of intensity
value difference. Also, (x, y) and (x*, y*) are the co-
ordinates of a point on the subset before and after de- formation respectively. The symbol of the summation represents the sum of the values within the subset. The coordinate (x*, y*) after deformation relates to
the coordinate (x, y) before deformation, therefore,
displacement components are obtained by searching the best set of the coordinates after deformation (x*, y*) which minimize R(x, y, x*, y*).
Make a grid on the reference image for the part needed to be correlated. The grid will contain a number of (N) rasters (Mn), where n varies from 0 to N − 1, and each
raster (Mn) represents number of pixels. Assuming
that the motion is in one direction only (x), then, the
position of rasters will be in x direction only and de-
noted by grid_x.
Run the correlation function to the previous grid. The function will give the new position of the grid rasters on the compressed image in x direction, which is de-noted by validx.
The displacement for each grid point ∆Lx in x direc-
tion (the direction of the applied force) can be calcu- lated as follows in Equation (2):
_
x
L grid x validx
(2)
2.5. Liver Fibrosis Recognition
[image:3.595.56.286.647.720.2]Liver fibrosis stage can be determined according to the
Figure 3. Image correlation function.
displacement ∆Lx calculated in Equation (2). Hooke’s
law specifies that the force affecting material is directly proportional to the displacement occurred on each part of this material as follows in Equation (3) [30].
F K X (3)
Where: F is the applied force; K is a constant depends
on the elasticity or the stiffness of the material, and X is
the displacement. If the force F is fixed at a constant
value, then the displacement will depend only on the elasticity of the material which changes from material to another. The relation between the displacement ∆Lx and
the stiffness E is as follows in Equation (4):
x x
Stress F A F L E
Strain L L A L
(4)
Where:
A is the cross section area of the material under stress, L is the initial length, and ∆L is the displacement.
If L, A, and F are assumed to be constants, then from
Equation (4) we can see that the stiffness E is inversely
proportional to the displacement ∆Lx as follows in Equa-
tion (5);
1
x
E L
(5)
To eleminate the need for a proportionality constant we can write the stiffness of two materials as follows in Equation (6);
2 1
2 1
x x
L E
E L
(6)
The proposed work uses different forces for compres- sion, and with each force the displacement ∆Lxn of each
raster Mn will be calculated through the correlation func-
tion. This displacement of each raster will be used to in- dicate the liver fibrosis.
∆Lxnis assumed to be the displacement of the checked
raster. ∆Lxr is the displacement of the reference raster
that has been located in the reference material which has a stiffness value of Er = 5 (KPa) as shown in Figure 2.
Also, E1, E2, E3, and E4 are assumed to be the stiffness
values to liver fibrosis stages of F0,1, F2, F3, and F4 re-
spectively as stated above in Section 2.2. According to the proposed work, the checked rasters can be classified to refer to one of the liver fibrosis stages as follows:
Rasters that refer to fibrosis FJ should achieve Equa-
tion (7) as follows:
1
J xr J
r xn
E L E
E L E
r (7)
Where J = 1, 2, or 3.
(EJ) is stiffness values of liver fibrosis.
(Er) is the stiffness of the reference material. known.
3) Apply a compression force in the direction from the reference material to the soft tissue to the fibrosis area. As results of the force, each raster will move certain dis- placement in the direction of the applied force depending on the material stiffness that contains this raster.
(∆Lxr) is the displacement of a raster in the reference
material resulted from applying a compression force in x
direction.
(∆Lxn) is the displacement of a raster in the checked
area resulted from applying a compression force in x
direction. The above Equation (7) is suitable for fibrosis
F0,1, F2, and F3, but for rasters that refer to fibrosis F4, it
should achieve Equation (8) as follows:
4) Use the correlation technique to recognize each ras- ter’s new position after the force is applied.
5) From this new position of each raster, the displace- ment of this raster will be calculated.
4 xr
r x
L E
E L
calculated in step 5 which depending on the magnitude 6) Applying Equations (7) and (8) on the displacement
of the applied force, the type of the material can be iden- tified which may be one of the following materials;
n
(8)
The correct rasters and then the correct liver fibrosis stage will be recognized, and the success of our algo- rithm is represented by a ratio called correct recognition ratio (CRR), which specifies the number of liver fibrosis image rasters that can be recognized correctly. Multiple compression forces can be assumed and the liver fibrosis will be recognized for each compression force magnitude, and an average correct recognition ratio can be calculat- ed.
a) Reference material. b) Soft tissue. c) Fibrosis F1.
d) Fibrosis F2.
e) Fibrosis F3.
f) Fibrosis F4.
7) According to the classification of each raster mate- rial we fill in Table 1, where from this table we can cal-
culate the correct recognition ratio CRR for those 100 checked rasters affected by that specific force.
3. RESULTS
To calculate the correctness of classification between
different fibrosis stages we will follow these steps: 10 different values of the applied force, and in each case 8) Changing the force and go to step 3) and repeat for calculate CRR.
1) In the FEM domain we will consider set up of three areas, known as a reference material, soft tissue, and a known fibrosis area as shown in Figure 2.
9) Calculate the overall CRR on the 10 different forc- es.
2) Consider 100 rasters distributed in each of the three areas where the position of each raster in these areas is
10) Table 2 shows the average of the 10 tables where
[image:4.595.118.478.485.585.2]each one represents certain force.
Table 1. CRR for liver fibrosis assuming 100 rasters in each area.
Recognized area Fibrosis
Actual area Reference Soft tissue F1 F2 F3 F4
CRR (%)
Reference 90 5 4 1 - - 90
Soft tissue 3 95 2 - - - 95
F1 - 3 80 10 7 - 80
F2 - - 4 90 6 - 90
F3 - - - 12 85 3 85
Fibrosis
F4 - - - 7 8 85 85
[image:4.595.118.481.623.736.2]Average correct recognition 85
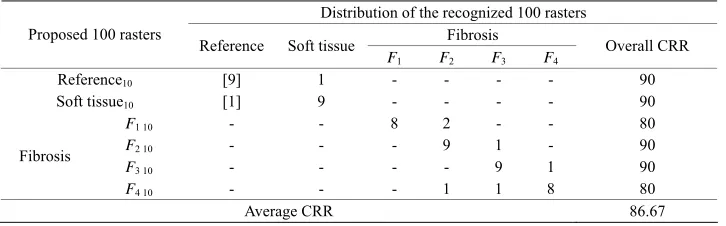
Table 2. Overall CRR for each liver fibrosis as a result of applying 10 different values of the com- pression force.
Distribution of the recognized 100 rasters Fibrosis
Proposed 100 rasters
Reference Soft tissue
F1 F2 F3 F4
Overall CRR
Reference10 [9] 1 - - - - 90
Soft tissue10 [1] 9 - - - - 90
F1 10 - - 8 2 - - 80
F2 10 - - - 9 1 - 90
F3 10 - - - - 9 1 90
Fibrosis
F4 10 - - - 1 1 8 80
4. CONCLUSION
The liver fibrosis can be recognized in the elastography imaging by using liver fibrosis biopsy measurements as a reference. The biopsy measurements give the average stiffness values of liver fibrosis. The equation of elastic- ity specifies that tissues with high stiffness values will move a short distance when it is exposed to a certain compression force, and vice versa. The proposed recog- nition algorithm of liver fibrosis stages takes a short time to recognize the liver fibrosis stage. This algorithm can recognize the liver fibrosis stages F0,1, F2, F3, F4, by an
overall CRR of about 86.67%. This method of course will be faster than biopsy measurements, besides it is considered as a non-intervening operation. This proposed work can be improved by using real elastography images for liver fibrosis, then, the correct recognition ratio CRR is expected to be increased. It is worth to mention that the tolerance in each of the reference values of liver fi- brosis stiffness is being ignored in this proposed work to avoid complicated calculations, and that resulted in de- creasing of CRR. This shortcoming can be eliminated in the future work.
REFERENCES
[1] Eugenia, V., Pablo, B., et al. (2009) Over estimation of liver fibrosis staging using transient elastography in pa- tients with chronic hepatitis C and significant liver in- flammation. International Medical Press, 1359-6535. [2] Silver, D., Karnik, G. and Osinusi, A. (2013) Effect of HIV
on liver fibrosis among HCV-infected African Americans. http://cid.oxfordjournals.org/
[3] Mercedes, de T. and Thierry, P. (2003) Risk factors for li- ver fibrosis progression in patients with chronic hepatitis C. Annals of Hepatology, 2, 5-11.
[4] Eric, J.C., Jan, N., et al. (1996) Young’s modulus meas- urements of soft tissues with application to elasticity im- aging. IEEE Transducers on Ultrasonics, Ferroelectrics, and Frequency Control, 43.
[5] Wen, C., Jeng, Y.-M., et al. (2001) Young’s modulus of human liver and correlation with pathological findings. Department of Electrical Engineering, National Taiwan University, IEEE, Ultrasonics Symposium, 1233. [6] Mauro, M.S., Juan, F.C., et al, (2007) Comparing opti-
mization algorithms for young’s modulus reconstruction in ultrasound elastography. Mechanical Department Ka- tholieke Universiteit, Leuven, IEEE Ultrasonics Sympo- sium.
[7] Christoph, F.D., Carla, S. and Maciej, J. (2011) Ultra- sound of the liver. European Course Book by University of Bologna, Department of Diagnostic Imaging, 2nd Me- dical Faculty of Warsaw Medical University.
[8] Ben, A., Claire, R.L. and Sameer, K. (2009) Imaging of li- ver cancer. World Journal of Gastroenterology, The WJG Press and Baishideng, 1007-9327.
[9] Harald, L. and Elisabetta, B. (2011) Manual of diagnostic ultrasound. 2nd Edition, World Health Organization. [10] Yves, B., Marie, B., Vincent, Di M., Frederic, C., Felipe,
A., Anne, C., Michel, V., Francois, B., Pierre, O., Chris- tine, K. and Thierry, P. (1999) Liver fibrosis progression in human immunodeficiency virus and hepatitis C virus coinfected patients. The Multivirc Group Hepatology, 30. [11] Mircea, G. (2006) Noninvasive biochemical markers of
liver fibrosis. Journal of Gastrointestin Liver, 15, 149- 159.
[12] Ayman, K. and Samir, S. (2011) Data mining visualiza- tion to support biochemical markers for liver fibrosis in patients with chronic hepatitis C virus. International Jour- nal of Artificial Intelligence and Expert Systems (IJAE), 2.
[13] Abdelfattah, M.A., Sanaa, O.A. and Ahmed, A.A. (2013) Diagnostic value of fibronectin discriminant score for pre- dicting liver fibrosis stages in chronic hepatitis C virus patients. Annals of Hepatology, 12, 44-53.
[14] Xavier, F., Sergi, A. and Josep, M.L. (2002) Identifica- tion of chronic hepatitis c patients without hepatic fibro- sis by a simple predictive model. American Association for the Study of Liver Diseases. Hepatology, 36.
[15] Yu, I., Hiroshi, E., Tadashi, Y. and Hiroyuki, H. (2009) A method of liver fibrosis estimation based on combination of Rayleigh distributions. Proceedings of Symposium on Ultrasonic Electronics, 30, pp. 343-344.
[16] Monica, L., Sergiu, N. and Cristian, V. (2007) Estimating the fibrosis stage in the human liver tissue using image pro- cessing methods on ultrasonographic images. Proceed- ings of the 3rd International Conference—EMMIT. [17] Doris, N. and Jayant, A.T. and Copyright, V.C. (2011)
Noninvasive assessment of liver fibrosis. The American Association for the Study of Liver Diseases, Hepatology. [18] Cannon, S., Browne, L. and Fagan, J. (2010) Assessment
of the accuracy of an ultrasound elastography liver scan- ning system using a PVA-cryogel phantom with optimal acoustic and mechanical properties. Physics in Medicine and Biology, 55, 5965-5983.
http://dx.doi.org/10.1088/0031-9155/55/19/022
[19] Sandrin, L., Oudry, J. and Bastard, C. (2011) Non-inva- sive assessment of liver fibrosis by vibration-controlled transient elastography (Fibroscan®).
www.intechopen.com
[20] (2012) ABAQUS installation and licensing guide. http://www.3ds.com/products/simulia/overview/
[21] Division of Engineering Brown University (2012) ABAQUS tutorial. EN175: Advanced mechanics of solids.
http://www.brown.edu/Departments/Engineering/Courses /En175/
[22] Product of Dassault Systèmes Simulia Corp. (2011) Aba- qus 6.11 Analysis User’s Manual Volume V, Prescribed Conditions, Constraints & Interactions. Dassault Sys- tèmes.
rachchi.
[24] Thomas, M.D. (2011) Fundamentals of biomedical image processing. Biomedical Engineering, Springer-Verlag, Ber- lin/Heidelberg.
http://dx.doi.org/10.1007/978-3-642-15816-2_1
[25] Zhang, D.S. and Dwayne, D.A. (2004) Applications of digital image correlation to biological tissues. Journal of Biomedical Optics, 9, 691-699.
http://dx.doi.org/10.1117/1.1753270
[26] Su, C. and Anand, L. (2003) A new digital image correla- tion algorithm for whole field displacement measurement. Department of Mechanical Engineering Massachusetts Institute of Technology Cambridge.
[27] Tong, W. (2005) An evaluation of digital image correla- tion criteria for strain mapping applications. Yale Univer- sity, Department of Mechanical Engineering, New Haven, Blackwell Publishing Ltd., Strain, 167-175.
[28] Christoph, E., Robert, T. and Daniel, G. (2012) Digital image correlation and tracking with matlab.
http://www.mathworks.com/matlabcentral/fileexchange/1 2413-digital-image-correlation-and-tracking
[29] Satoru, Y. and Go, M. (2007) Digital image correlation. Experimental mechanics, encyclopedia of life support sys- tems (EOLSS).