http://dx.doi.org/10.4236/apm.2013.39094
Numerical Simulation of Fluid-Structure Interaction
Method on Dynamic Movement of Leukocyte
in Flow Chamber
Wenjiao Li
School of Mechanical Engineering, Tianjin University, Tianjin, China Email: [email protected]
Received October 13,2013; revised November 15, 2013; accepted November 25, 2013
Copyright © 2013 Wenjiao Li. This is an open access article distributed under the Creative Commons Attribution License, which permits unrestricted use, distribution, and reproduction in any medium, provided the original work is properly cited.
ABSTRACT
Biomechanical properties of cells play a very important role in regulating cells function. Experimental studies found that when Leukocytes move near the vessel wall, the phenomena such as rolling, jumping and adhesion will appear. Based on the non-linear fluid-structure interaction theory, leukocyte’s tiny jumping mechanism and rolling phenomenon were studied. The results were: 1) The choice of time step of leukocyte had a great influence on the movement of leu-kocyte. Instead of landing on the bottom of flow chamber, leukocyte jumped to a certain height and then moved peri-odically toward the bottom of the flow chamber again. Leukocyte had the biggest deformation when jumping; 2) Adhe-sion and rolling along the bottom of the flow chamber appeared in the process of moving forward, the scrolling speed was greater than that of pure rolling. Leukocytes’ movement in blood vessels was closely related with body physiologi-cal and pathologiphysiologi-cal characteristics. The study of dynamic movement of leukocyte provided theoretiphysiologi-cal basis for cliniphysiologi-cal medicine.
Keywords: Fluid-Structure Interaction; Leukocyte; Jumping; Rolling
1. Introduction
Leukocyte, also named as immune cells, is spherical. It deforms easily and charged with a lot of responsibilities. Besides swallowing foreign body, it has immunity to disease resistance. In recent years, Leukocyte’s move- ment under shear flow is popular. More and more school- ars focus on the transmission mechanism.
Early studies have achieved many useful results in the field of cell movement and deformation. Goldsmith et al. [1] discovered that near the vessel wall leukocyte’s adhe- sion and jumping phenomena will appear. In 2000, T. Yamaguchi et al. [2] simulated the movement of cells using three-dimensional computational fluid dynamics. The cell model can be adopted by the random rotation, deformation, the migration and proliferation. The cell configuration changes fluid calculation based on infini- tesimal. K. C. Chang et al. [3] pointed out that there are three kinds of cell adhesion: firm adhesive, transient ad-hesive (rolling) and no adad-hesive. They also found that the unstressed dissociation rate and the bond interaction length are the most important molecular properties to
merical simulation of fluid-structure interaction method.
2. Materials and Methods
2.1. Equations
The fluid-structure interaction analysis is based on the governing equations of hydrodynamics, governing equa- tions of solid mechanics and the coupling equation.
The governing equation for the fluid domain is Mass conservation equation and momentum conservation equation, which were listed as following
0 f fv t (1)
f
fvv f f
t f e (2)
2f p v I
(3)
where t is time, ff is the body force vector, f is the
density of fluid, v is the fluid velocity vector, f is the
shear stress tensor, p is the fluid pressure, μ is the dy- namic viscosity, e is velocity stress tensor
1 2
T
e v v
(4)The governing equation for the solid domain is derived from Newton’s second law
s sd s
fs (5) where s is solid density, s is the Cauchy stress tensor, fs is the body force vector, ds is a solid do-
main local acceleration vector.
The variable such as stress , displacement d, heat flow q, temperature T of fluid-structure interaction inter- face should satisfy the following four equations
f f s
f s f s f s n n d d q q T T s (6)
2.2. Calculation Model
In the real situation, the rectangular cell culture chamber was length 200 μm, width 100 μm, height 50 μm and the cell diameter was 6 μm. In order to improve the calcula- tion accuracy, 1000 times increased rectangular cell cul- ture chamber was adopted based on the similarity prince- ple. Then the calculating chamber was length 200 mm, width 100 mm, height 50 mm and the cell diameter was 6 mm. The left was set for fluid inlet, right for outlet. The symmetric boundary conditions were taken in the width direction. In the flow chamber, the distance of leukocyte
from the bottom and the inlet was 8.3 mm and 50 mm (Figure 1). In the homogeneous incompressible fluid flow, the acceleration of gravity in the physical model was 9.8 m/s2. The modulus of elasticity and Poisson’s
ratio of the leukocyte were 10,000 Pa and 0.3. Other pa- rameters estimation in the models was listed in Table 1.
2.3. Method
The dynamic movement of leukocyte was studied through numerical simulation of fluid-structure interact- tion method with FLUENT and ANSYS. The implicit solution model was used and the flow field was based on pressure. Speed inlet flow boundary conditions for the inlet and the free export for the outlet. The Reynolds number was 1.9 so that the flow was laminar. The refer- ence pressure was set to standard atmospheric pressure. The calculation adopted SIMPLEC algorithm and sec- ond-order upwind scheme. FLUENT calculated the steady state first. Movement and deformation unsteady calculations followed the steady-state calculations.
Data transferred between FLUENT and ANSYS though the UDF (User Defined Function) procedures on fluid-solid nonlinear coupled interface. At each time step, force and moment of leukocyte in the fluid was calcu- lated first. According to the force and moment calculated in FLUENT, the movement was analyzed by UDF mo- tion analysis program. Then analyzed the deformation based on its force by ANSYS. Leukocyte’s deformation will return to FLUENT and continue the movement cal- culation, so repeated iterations.
In order to verify the accuracy of the model and method, the blood was changed to air. The ball fell free with an initial velocity of 6.67e−3m/s in x-direction. Since the force on y-direction was too small compared with other directions, we ignored the result of y direction
flow chamber
[image:2.595.310.535.524.594.2]inlet leukocyte outlet
Figure 1. Schematic diagram of a flow chamber with a single leukocyte.
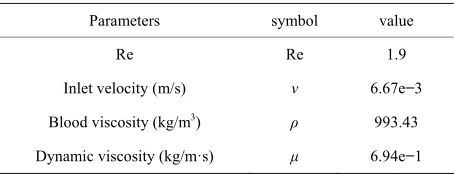
Table 1. Parameters estimation in the models.
Parameters symbol value
Re Re 1.9
Inlet velocity (m/s) ν 6.67e−3
Blood viscosity (kg/m3) ρ 993.43
[image:2.595.310.537.648.735.2]and considered displacement and velocity in x-direction and z-direction. The maximum error between calculated values and theoretical values occurred in displacement, which was 1.22% and within the acceptable range. Therefore, the model and method can be used.
3. Results
3.1. Movement of Leukocyte
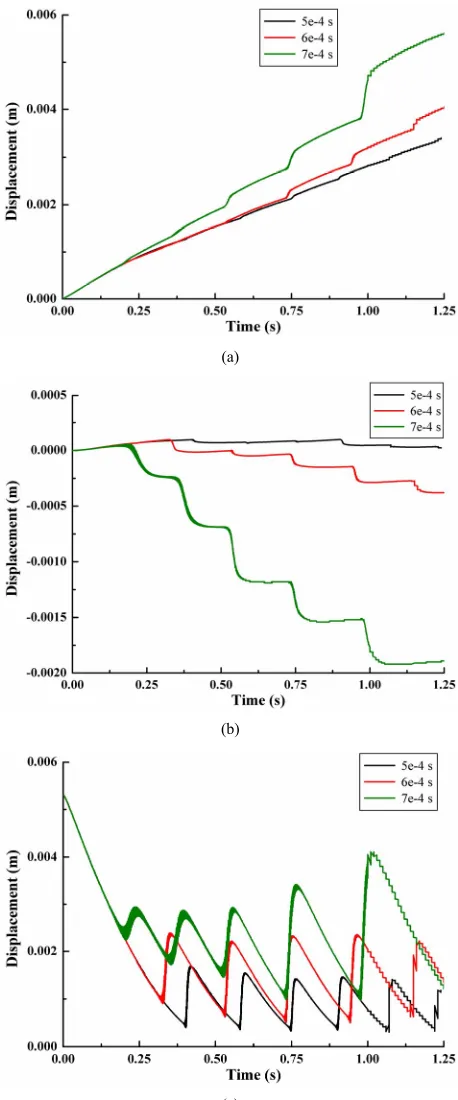
Time step 5e−4s, 6e−4s and 7e−4s conditions were adopted for calculation. In Figure 2, we can clearly saw the leukocyte bounce trajectory. Figure 2(a) was the increase of x-direction movement. It showed that leuko- cyte was always moves forward in the direction of blood flow. The x-displacement had a sudden change at every jumping time. After 1.25 second of movement, the leu- kocyte moved a distance of 3.39e−3m (5e–4 s), 4.02e−
3m (6e−4s) and 5.60e−3 m (7e−4s), with the maximum difference of 2.21e−3m, 1.1% of the total chamber length. The greater the time step, the farther the leukocyte moved in x direction.
Leukocyte moved forward in y-direction at first, fol- lowed with moving to the negative y-direction after its first jump. The y-displacement was one order of magni- tude less than the other two directions. The results of three kinds of time step calculation were quite different. After 1.25 second of movement, the leukocyte moved a distance of 2.05e−5m (5e−4s), −3.91e−4m (6e−4s) and
−1.88e−3 m (7e−4s). The result of time step 7e−4s was almost ten times more than time step 5e−4s and 6e−4s.
Different time steps had little effect in the process of dropping, but the leukocyte bounce time and height dif- fers. Leukocyte dropped from the initial position to the bottom of flow chamber under the influence of gravity where the distance from the initial position to the blood vessel wall is 5.3e−3m. Z-direction movement was more regular than x-direction and y-direction. Leukocyte bounced at position 4.36e−4m instead of landing on the blood vessel wall, with jumping height of 1.69e−3m (5e−
4s). After that, leukocyte began to decline to the near vascular wall and then bounce again periodically. The results of other time step were similarity. In 1.25 second of movement, leukocyte bounced six times for time step 5e−4s, five times for time step 6e−4s and te−4s. The time and distance from bottom while leukocyte jumping were shown in Table 2. The average value and variance of leukocyte bounce cycle was shown in Table 3. Clearly, the Jumping cycle time of time step 6e−4s was the big- gest and most stable. However, the height in jumping of time step 7e−4s was becoming bigger and bigger with the increase in number of hitting. Table 4 showed the leu-kocyte jump height in each cycle.
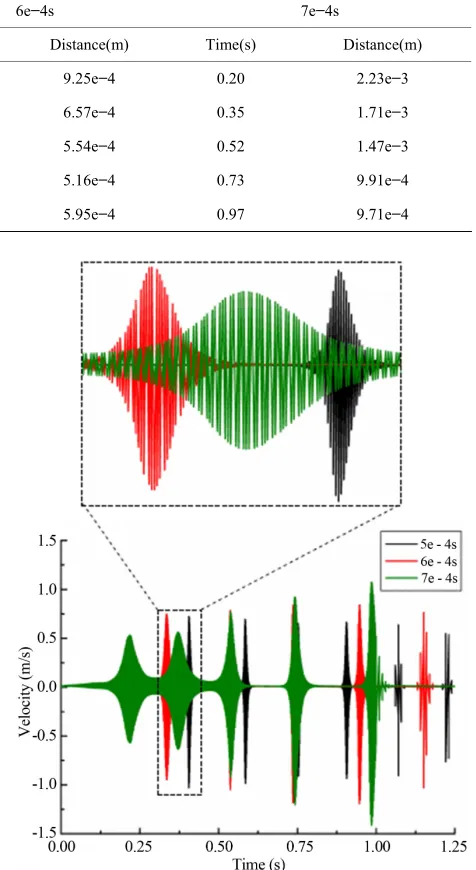
Figure 3 showed z-velocity of a single leukocyte due to gravity in the flow chamber. The velocity graph dem-
(a)
(b)
[image:3.595.308.537.83.633.2](c)
Figure 2. Displacement of a single leukocyte due to gravity in flow chamber. (a) Displacement in x-direction; (b) Dis- placement in y-direction; (c) Displacement in z-direction.
Table 2. Time and distance from bottom while leukocyte jumping.
5e−4s 6e−4s 7e−4s
Number of
jumping Time (s) Distance(m) Time(s) Distance(m) Time(s) Distance(m)
1 0.40 4.36e−4 0.33 9.25e−4 0.20 2.23e−3
2 0.58 3.93e−4 0.53 6.57e−4 0.35 1.71e−3
3 0.75 3.49e−4 0.73 5.54e−4 0.52 1.47e−3
4 0.90 3.67e−4 0.94 5.16e−4 0.73 9.91e−4
5 1.06 3.24e−4 1.14 5.95e−4 0.97 9.71e−4
Table 3. Average value and variance of leukocyte bounce cycle.
Time step(s) 5e−4 6e−4 7e−4
average value(s) 0.165 0.203 0.193
[image:4.595.57.286.247.431.2]variance(s) 0.013 0.005 0.040
Table 4. Leukocyte jump height.
Number of jumping 5e−4s (m) 6e−4s (m) 7e−4s (m)
1 1.22e−3 2.37e−3 7.14e−4
2 1.11e−3 1.51e−3 1.11e−3
3 1.01e−3 1.74e−3 1.42e−3
4 1.06e−3 1.81e−3 2.37e−3
5 1.03e−3 1.51e−3 3.06e−3
the minimum velocity in z-direction were shown in Ta- ble 5. The time when velocity reached maximum was corresponding with the jumping time.
Graphical display of local enlargement was shown in
Figure 3. Oscillate occurred in different times since dif- ference beating time. The fastest growth and reduce rate was the velocity of time step 5e−4s, followed by time step 6e−4s and the last one was time step 7e−4s. The forces acting on the leukocyte were changed corre-
spondingly. Figure 3. Z-velocity of a single leukocyte due to gravity in flow chamber.
3.2. Rolling of Leukocyte
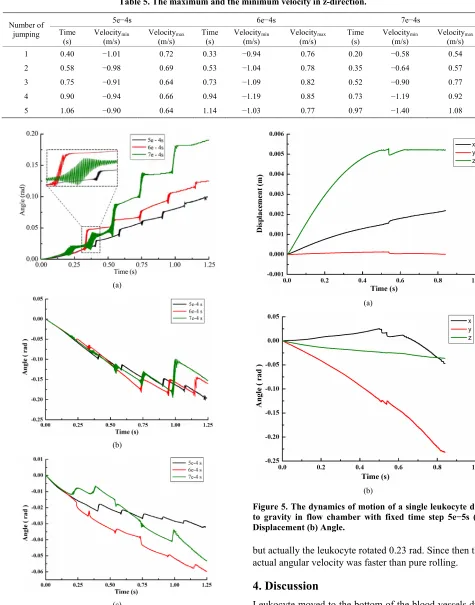
3.3. Adhesion of Leukocyte Figure 4 showed the rotation angle of a single leukocyte
due to gravity in flow chamber. It was in accordance with the displacement in every jump cycle. With the increa- sing of time step, leukocyte angle in x direction was becoming larger and always in the positive direction. After 1.25 second, leukocyte rotated 0.099rad (5e−4s), 0.126rad (6e−4s) and 0.191rad (7e−4s). It was the first oscillation for time step 5e-4s in the graphical display of local enlargement. Oscillation time was short, only 0.02 second, while the angle of time step 6e−4s complete oscillations in 0.03 second. In contrast, changes of time step 7e−4s changed more slowly and smoothly.
The dynamics of motion of a single leukocyte due to gravity in flow chamber with fixed time step 5e−5s was shown in Figure 5. The initial position of leukocyte movement was seen as zero point in all three directions. Leukocyte jumped at 0.537 second with a distance of 4.7e−5m from the bottom of flow chamber. However, leukocyte dropped to the vessel wall once again and re- mained stable in the z direction with a distance of 6.7e−
Table 5. The maximum and the minimum velocity in z-direction.
5e−4s 6e−4s 7e−4s
Number of
jumping Time
(s) Velocity(m/s) min Velocity(m/s) max Time(s) Velocity(m/s) min Velocity(m/s) max Time (s) Velocity(m/s) min Velocity(m/s) max
1 0.40 −1.01 0.72 0.33 −0.94 0.76 0.20 −0.58 0.54
2 0.58 −0.98 0.69 0.53 −1.04 0.78 0.35 −0.64 0.57
3 0.75 −0.91 0.64 0.73 −1.09 0.82 0.52 −0.90 0.77
4 0.90 −0.94 0.66 0.94 −1.19 0.85 0.73 −1.19 0.92
5 1.06 −0.90 0.64 1.14 −1.03 0.77 0.97 −1.40 1.08
(a)
(b)
[image:5.595.305.539.116.581.2](c)
Figure 4. Rotation angle of a single leukocyte due to gravity in flow chamber. (a) Angle in x-direction; (b) Angle in y- direction; (c) Angle in z-direction.
(a)
(b)
Figure 5. The dynamics of motion of a single leukocyte due to gravity in flow chamber with fixed time step 5e−5s (a) Displacement (b) Angle.
but actually the leukocyte rotated 0.23 rad. Since then the actual angular velocity was faster than pure rolling.
4. Discussion
[image:5.595.66.279.126.697.2]to a certain height, it descends to the bottom and jumps again. The velocity showing oscillatory changes when leukocyte jumping and the forces acting on the leukocyte were also changed correspondingly. The choice of time step of leukocyte had a great influence on the movement of leukocyte. Adhesion in the vicinity of the vessel wall was another significant phenomenon. Since the shear flow was in flow chamber, velocity of leukocyte was greater than the pure rolling.
5. Acknowledgements
Project Supported by Tianjin Research Program of Ap- plication Foundation and Advanced Technology 11JCYB JC09700.
REFERENCES
[1] M. Long, L. Harry, Goldsmith, D. F. J. Tees and C. Zhu, “Probabilistic Modeling of Shear-Induced Formation and Breakage of Doublets Cross-Linked by Receptor-Ligand Bonds,” Biophysical Journal, Vol. 76, No. 2, 1999, pp. 1112-1128.
http://dx.doi.org/10.1016/S0006-3495(99)77276-0 [2] T. Yamaguchi, Y. Yamamoto and H. Liu, “Computa-
tional Mechanical Model Studies on the Spontaneous Emergent Morphogenesis of the Cultured Endothelial Cells,” Journal of Biomechanics, Vol. 33, No. 1, 2000, pp. 115-126.
http://dx.doi.org/10.1016/S0021-9290(99)00159-1
[3] K. C. Chang, D. F. Tees and D. A. Hammer, “The State Diagram for Cell Adhesion under Flow: Leukocyte Roll-ing and Firm Adhesion,” Proceedings of the National Academy of Sciences, Vol. 97, No. 21, 2000, pp. 11262- 11267. http://dx.doi.org/10.1073/pnas.200240897
[4] M. J. Slattery and C. Dong, “Neutrophils Influence Melanoma Adhesion and Migration under Flow Condi- tions,” International Journal of Cancer, Vol. 106, No. 5, 2003, pp. 713-722.
http://dx.doi.org/10.1002/ijc.11297
[5] N. A. N’Dri, W. Shyy and R. Tran-Son-Tay, “Computa- tional Modeling of Cell Adhesion and Movement Using a Continuum-Kinetics Approach,” Biophysics Journal, Vol. 84, No. 4, 2003, pp. 2273-2286.
[6] S. Liang, M. J. Slattery, D. Wagner, S. I. Simon and C. Dong, “Hydrodynamic Shear Rate Regulates Melanoma- Leukocyte Aggregation, Melanoma Adhesion to the En- dothelium, and Subsequent Extravasation,” Annals of Biomedical Engineering, Vol. 36, No. 4, 2008, pp. 661- 671. http://dx.doi.org/10.1007/s10439-008-9445-8 [7] A. Squeira, A. M. Artoli, A. S. Silva-Herdade and C.
Saldanha, “Leukocytes Dynamics in Microcirculation under Shear-thinning Blood Flow,” Computers and Ma- thematics with Applications, Vol. 58, No. 5, 2009, pp. 1035-1044.
http://dx.doi.org/10.1016/j.camwa.2009.02.003