Volume 63 Number 6267 DOI: 10.22444/IBVS.6267
Konkoly Observatory Budapest
8 May 2019
HU ISSN 0374 – 0676
NEW LIGHT ON R ARAE
BLANE, D.; BLACKFORD, M.G.; BUDDING, E.; REED, P.A.
Variable Star Section, Royal Astronomical Society of New Zealand, New Zealand
Abstract
In mid-2018, efforts were renewed to check on the highly active mass-transfer process shown by the classical Algol system R Arae. We present new light curves and times of light minimum from this project.We also extend R Arae’s period O–C diagram to include the new results. The new data are consistent with the strong mass transfer scenario of Reed (2011). Recent and ongoing studies of this interesting system are referred to.
1
Introduction
In the early 1980s investigators using satellite observational techniques were drawing attention to the relatively bright southern binary system R Arae, which superficially resembles a ‘classical’ Algol, but with mass transfer on a more enhanced scale than typical, and with additional photometric peculiarities that may be related to relatively dense and uneven accretion structures (Kondo et al., 1985; Nield et al., 1986; Reed, 2011). Kondo et al. (1985), perhaps with the symmetric, smoothly rounded light curve of Gaposchkin (1953) in mind, compared the system to the well-known massive and strongly interactive binary β Lyrae, despite the 3-times greater period of the latter.
The period steadily increased from about 4.42495 d in the year of its discovery by Roberts (1894) to the 4.425132 d given by Nield (1986; for HJD 2446585.161) and continues to do so according to Reed (2011), who obtained a mean rate of increase of 5.15×10⁻⁹ d d−1 over 116 y. Reed deduced, from this period extension, that the
Roche-Lobe filling component in the binary was shedding matter to its companion at a rate of about 3.06×10⁻⁷ M⊙y
−1
.
Reliable parametrization of R Arae has been compromised by the significant (∼10%)
Figure 1. BVRI light curves andB−V colour curve of R Arae in mid-2018. The epoch and period
2
New data
Light curves of R Arae were produced in Jun 2018 (DB) and Jul-Aug 2018 (MGB) as contributions to the Southern Binaries Programme of the VSS, stimulated by a new data request (PAR). For the June data, images were obtained with a 150 mm f5 refractor and a Canon 1300D DSLR camera mounted on a GEM goto mounting. Aperture photometry was facilitated using the IRIS software package. The camera’sGmagnitudes were linearly transformed to the Johnson V band using MS-Excel. Differential extinction was not applied. Each adopted measurement was the average obtained from 10 separate field images.
The Jul 7–Aug 19 data were gathered over 19 nights using an 80 mm f6 refractor and SBIG STT 3200ME CCD camera with Astrodon filters. These observations were extinc-tion corrected and linearly transformed to standard Johnson-CousinsBVRCIC system. In Fig. 1 we present these latter data (upper panel: blue points B, green V, redRC, orange
IC). The lower green points show the check star, HD149519, shifted to an average value of 7.6 for easy display. Its actual measured average V value was 8.547 mag. The (binned)
B −V colour curve is shown in the lower panel. The 19 separate runs consist of typi-cally∼50 points. The light-curves show the same kind of previously reported behaviour,
[image:3.595.155.438.404.705.2]with some features having a degree of persistence, for example the rise and decline into the primary eclipse, while other transient occurrences have a stochastic quality (Forbes, 1988).
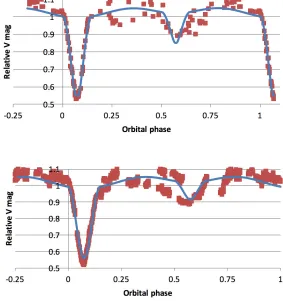
Figure 2. TheV light curves of 2018 Jun (DB, upper panel) and Jul-Aug (MB, lower panel), fitted
In the B−V colour curve (lower panel) we have binned each of the 18 sets of data into single average points, together with their s.d. dispersions. It is clear that the vagaries of colour are significantly greater than the standard deviation within the groups. The system is redder at mid-occultation, however – by about 0.06 mag. There is a suggestion of some blueing around the transit, but that is not uniform. The average B −V in the out-of-eclipse regions is 0.081 mag. These irregularities mean that parameters associated with fitting the light curves with standard models are not well-defined. Even so, a classical Algol model will approximately fit, as shown in Fig. 2, though other possibilities cannot be ruled out from photometric evidence alone. The significant secondary minimum and relatively low depth of the primary might be associated with a detached pair; though, when the light from the close companion (included in aperture photometry) is taken into account, the depth of the primary eclipse implies a secondary size comparable to its surrounding Roche lobe (Nield, 1987).
[image:4.595.113.490.388.689.2]Baki¸s et al. (2016), posited a model of cyclic phenomena in their account, though the question of why certain Algols show variable light curves (Piotrowski et al., 1974) and not all was more squarely addressed in the review of Reed (2012), who noted that certain period and mass-ratio combinations are propitious in allowing the development of relatively large and unsteady accretion structures. This model is in keeping with the relatively large rate of period increase demonstrated by Reed (2011) and confirmed in the latest (2018) times of minima illustrated in Fig. 3.
Figure 3. O–C variation as predicted by Reed (2011) and confirmed by our latest times of minima.
d at cycle 2650 from Nield’s epoch.
It is of interest to note that relevant precise photometric data from NASA’s Transit-ing Exoplanet Survey Satellite (TESS) should become available fromSector 12, that is expected to run between May 21 and June 19 this year. The foregoing BVRCIC infor-mation, not available from TESS, should then have a useful complementary role. Other complementary data on R Arae is available from KELT (Collins et al., 2018), together with spectroscopic data planned from MINERVA (Wittenmyer et al., 2018) or contained in the University of Canterbury Mt John Observatory HERCULES archive. This present report will thus hopefully contribute to ongoing observational work on this intriguing active close binary system.
Acknowledgements We appreciate the helpful suggestions of Dr L. Moln´ar, editor of the IBVS, regarding this contribution, and keenly appreciate the support that the IBVS has given to this kind of research over the years.
References:
Banks, T., 1990, IBVS, 3455
Baki¸s, H., Baki¸s, V., Eker, Z., Demircan, O., 2016, MNRAS, 458, 508 DOI
Budding, E., 1989, Space Science Reviews, 50, 205 DOI
Collins, K. A., Collins, K. I., Pepper, J., et al., 2018,ApJ, 156, 234 DOI
Forbes, M., Budding, E., Priestley, J., 1988,IBVS, 3278 Gaposchkin, S., 1953,Annals of Harvard Coll. Obs.,113, 67
Kondo, Y., McCluskey, G.E. Jr., Parsons, S. B., 1985, ApJ, 295, 580 DOI
Nield, K. M., Priestley, J., Budding, E., 1986, IBVS, 2491
Piotrowski, S. L., Ruci´nksi, S. M., Semeniuk, I., 1974,AcA, 24, 389
Reed, P. A., 2011, IBVS, 5975
Reed, P. A., 2012, IAUS, 282, 325 DOI
Roberts, A. W., 1894,AJ,14, 113 DOI