IJPSR (2018), Volume 9, Issue 2 (Research Article)
Received on 08 May, 2017; received in revised form, 24 August, 2017; accepted, 17 September, 2017; published 01 February, 2018
DEVELOPMENT AND VALIDATION OF STABILITY INDICATING UV SPECTRO-PHOTOMETRIC METHOD FOR THE ESTIMATION OF BENZYDAMINE HYDROCHLORIDE IN BULK AND IN PHARMACEUTICAL DOSAGE FORM: A NOVEL ANALYTICAL TECHNIQUE FOR CONDUCTING IN-VITRO QUALITY CONTROL TESTS
Deepak Sharma*1, Rajindra Singh 2 and Rajeev Garg 3
I. K. Gujral Punjab Technical University 1, Kapurthala - 144603, Punjab India.
Department of Pharmaceutics 2, Rayat Bahra Institute of Pharmacy, Hoshiarpur - 146104, Punjab, India. Department of Pharmaceutics 3, ASBASJSM College of Pharmacy, Bela, Ropar - 140111, Punjab, India.
ABSTRACT: The objective of the present study is to develop and validate a novel
stability indicating UV spectrophotometric method for estimation of Benzydamine Hydrochloride (BNZ) in pharmaceutical dosage form as not a single UV spectrophotometric method has been reported for the estimation of Benzydamine Hydrochloride, which makes the present work novel. In the present research work, UV spectrophotometric determination was carried out at an absorption maximum of 305.6 nm in pH 6.8 phosphate buffer. The purposed method was validated statistically for linearity, accuracy, precision, repeatability, ruggedness, sensitivity as per International Conference on Harmonization guidelines. The drug substance was exposed to acid hydrolysis, alkaline hydrolysis, oxidative degradation, photolytic degradation, and thermal degradation and the stressed samples were analyzed by the proposed method to demonstrate the specificity of the method. The application of developed method was established by performing the assay of pharmaceutical formulation. The proposed method obeyed beer lambert’s law in the concentration range of 5 - 50 µg ml-1 with correlation coefficient (r2) of 0.999. Percentage relative standard deviation associated with all the validation parameters were ≤ 2%. There were no significant changes in absorbance after performing the forced degradation studies and the % age drug recovery was found to be 98.53% and 98.53% for film and gel respectively. The proposed method was found to be novel, simple, rapid, precise, selective, reproducible economical and stability indicating can be successfully applied to the determination of Benzydamine Hydrochloride in bulk and in pharmaceutical dosage form.
INTRODUCTION: Benzydamine Hydrochloride (BNZ) is a tertiary amine indazole derivative having IUPAC Name i.e. 3- (1-benzylindazol-3-yloxy) propyldimethylamine hydrochloride. It is available as Benzydamine cream, Benzydamine Gel, Benzydamine Mouthwash, Benzydamine or omucosal spray.
QUICK RESPONSE CODE
DOI:
10.13040/IJPSR.0975-8232.9(2).678-86
Article can be accessed online on:
www.ijpsr.com
DOI link: http://dx.doi.org/10.13040/IJPSR.0975-8232.9(2).678-86
It is an official drug in British Pharmacopoeia 1. It is a unique non-steroidal anti-inflammatory drug (NSAID) with local anaesthetic and analgesic properties. It provides beneficial effects after both topical and systemic administration.
By acting locally it inhibits the release as well as the response of inflammatory mediators i.e. mainly thromboxanes 2. The action of Benzydamine is believed to be mediated by the prostaglandin system. The drug may affect formation of thromboxanes and alter the rate of prostaglandin produced, inhibiting platelet aggregation and stabilizing cell membranes.
Keywords:
Absorption maxima (λmax), Benzydamine Hydrochloride, Correlation coefficient (r2), UV
Spectrophotometric method, Validation
Correspondence to Author: Deepak Sharma
Ph.D, Research Scholar, I. K. Gujral Punjab Technical University, Kapurthala - 144603, Punjab India.
The primary site of metabolism is the liver; derivatives and free Benzydamine are excreted by the kidney and in the bile 3. The Empirical Formula of Benzydamine Hydrochloride is C19H23N3O.HCl.
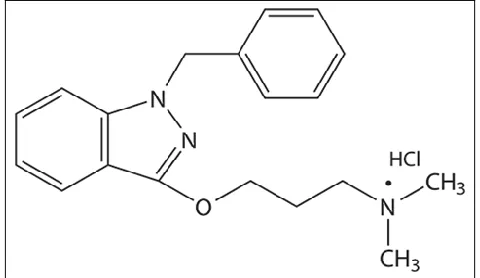
[image:2.612.53.293.175.314.2]Physically it is a white crystalline powder with a molecular weight of 345.9. It is very soluble in water; freely soluble in ethanol (96%); practically insoluble in ether 4. The structure is given in Fig. 1.
FIG. 1: CHEMICAL STRUCTURE OF BENZYDAMINE HYDROCHLORIDE
Literature survey revealed that very few analytical methods have been reported on Benzydamine Hydrochloride. Benson HAE et al., described a RP-HPLC method for determination of Benzydamine
Hydrochloride in topical pharmaceutical preparation 5
. Wang J et al., studied the photo-degradation of Benzydamine in pharmaceutical formulations by HPLC with diode array detection 2. Carlucci G et al., performed the HPLC for the determination of l-Benzyl- lH- indazol- 3- ol in Benzydamine in pharmaceutical formulations 6.
Li et al., developed an ion-selective piezoelectric sensor method for the determination of Benzydamine in serum and urine 7. De Jesus et al.,
reported an amperometric biosensor method for Benzydamine determination in pharmaceuticals 8. Carlucci G et al., described a RP-HPLC method for the determination of Benzydamine Hydrochloride and its impurities in oral collutory 9. However, not a single UV - Spectrophotometric method has been reported for the estimation of Benzydamine Hydrochloride, which makes the present work novel.
Among the various methods available for the
determination of drugs, spectrophotometry continues
to be very popular, because of their simplicity, specificity and low cost. The UV spectro-photometric method has the various advantages
over RP-HPLC method i.e. the UV
spectrophotometric method is cost effective as well as less time consuming method than RP-HPLC method. The present study describes a novel, rapid, simple, precise, selective, reproducible, economical and stability indicating UV spectrophotometric method for the determination of Benzydamine Hydrochloride in bulk and pharmaceutical formulations.
MATERIALS AND METHODS:
Apparatus: A double beam UV Spectro-photometer (Systronics), model UV-2201 (India) with a spectral bandwidth of 1nm, wavelength accuracy of ± 0.5 nm and a pair of 1 cm quartz cells were used to measure absorbance of the resulting solutions.
Chemicals and Reagents: The Benzydamine Hydrochloride was obtained as a gift sample from Harika Drugs Pvt. Ltd., Telangana, India. Other chemicals used were HPMC K100M (Colorcon Asia Pvt. Ltd. Goa), potassium dihydrogen phosphate, sodium hydroxide etc. All other chemicals or reagents used were of analytical grade. Double distilled water was used throughout the experiment.
Selection and Preparation of Common Solvent: The phosphate buffer (pH 6.8) was selected as common solvent. The selection of common solvent was based on the good solubility of BNZ in this solvent. Place 125 ml of 0.2 M Potassium dihydrogen phosphate in a 500 ml volumetric flask, add the 56 ml of 0.2 M sodium hydroxide and then add water to volume to prepare phosphate buffer of pH 6.8.
(a) Preparation of 0.2 M Potassium Dihydrogen Phosphate Solution: 27.218 g of potassium dihydrogen phosphate was dissolved in double distilled water and was diluted double distilled with water to 1000 ml.
(b)Preparation of 0.2 M Sodium Hydroxide: 8 g of NaOH was dissolved in double distilled water and was diluted with double distilled water up to 1000 ml 10.
flask and dissolved in phosphate buffer of pH 6.8. Then the solution was diluted up to the mark with phosphate buffer (pH 6.8) to obtain the solution having strength of 1000 µg ml-1 (Standard Stock Solution). 10 ml of this solution was taken into a 100 ml volumetric flask was diluted up to 100 ml to get the solution of 100 µg ml-1 concentration (working Solution) 11.
Determination of Absorption Maxima (λmax):
The absorbance of the working solution was scanned in the range of 200 - 400 nm on UV spectrophotometer 11.
Validation of the Proposed Method: The method was validated in terms of linearity, accuracy, precision, repeatability, robustness, ruggedness, sensitivity and forced degradation study.
Linearity: Different aliquots of BNZ in the range 0.5-5 ml of working solution(100 µg ml-1) were transferred into series of 10 ml volumetric flasks, and the volume was made up to the mark with double distilled water to get concentrations 5, 10, 15, 20, 25, 30, 35, 40, 45 and 50 µg ml-1, respectively. The solutions were scanned on a spectrophotometer in the UV range 200 - 400 nm. The spectrum was recorded at 305.6 nm. The calibration plot was constructed as concentration
vs. absorbance 11.
Accuracy (Percentage Recovery): Accuracy is the percentage of analyte recovered by assay from known added amount. Solutions were prepared in triplicate at levels of 50%, 100% and 150% of 20 µg ml-1 test concentration of the sample solution using working Standard solution as per the test method and taken absorbance of each solution in triplicate 13.
Precision: Precision is the degree of repeatability of an analytical method under the normal operation conditions. The precision was determined with standard quality control samples prepared in triplicate at different concentration levels covering the entire linearity range. The precision of assay was determined by repeatability (intra-day), intermediate precision (inter-day) and reported as % RSD for a statistically significant number of replicate measurements. The intermediate precision was studied by comparing the assay on three
different days and the results were documented as standard deviation and % RSD 14.
Repeatability: Repeatability of the method was determined by analyzing six samples of same concentrations of drug (20 µg ml-1). From the resulting absorbance the standard deviation and relative standard deviation were calculated 15.
Robustness: The robustness of an analytical method is the measure of its capacity to remain unaffected by small, but deliberate variations in method parameters and provides an indication of its reliability during normal usage. Robustness was tested by varying detection wavelength (±2 nm) of optimized conditions from the standard detection wavelength (305.6 nm) 16.
Ruggedness: Ruggedness of the method was determined by analysing repeatedly for six times the standard solution having 30 µg ml-1 of BNZ by two different analysts using the same experimental and environmental conditions 17.
Sensitivity: Sensitivity of an instrument can analysed by determining the two parameters as follow:
Limit of Detection (LOD) Limit of Quantification (LOQ)
The limit of detection (LOD) is the lowest amount of analyte in a sample that can be detected, but not
necessarily quantified, under the stated experimental
conditions. The Limit of Quantification (LOQ) is lowest amount of analyte in a sample which can be quantitatively determined. LOD and LOQ were calculated by using standard deviation (δ) and slope value (s) obtained from calibration curve.
Equations:
LOD = 3.3 δ s LOQ = 10 δ
s
Forced Degradation Study (Stress Conditions): A 2 ml of the standard stock solution (1000 µgml-1) of BNZ was taken as four replicates in four different volumetric flasks of 100 ml and mixed with 10ml of following (1 - 3) solutions. Then, all the flasks were set aside for 1 hour at room temperature. Solution was diluted up to mark with double distilled water.
0.1N HCl for acid hydrolysis. 0.1N NaOH for alkaline hydrolysis. 5% H2O2 for oxidative degradation.
For photolytic degradation, a solution of drug (20 µg ml-1) was exposed to UV radiation of wavelength 254 nm and of 1.4 flux intensity for 24 hours in a UV chamber.
For thermal degradation solid pure drug was kept in an oven at 100 °C for 24 hours. After cooling to room temperature 20 µg ml-1 solution was prepared.
Absorbance of all the solutions from acid hydrolysis, alkaline hydrolysis, oxidative degradation, photolytic degradation, and thermal degradation were measured at 305.6 nm against respective solvent as blank in each case 19.
Preparation of Mucoadhesive film and gel formulation: HPMC K100M was used for the preparation of Mucoadhesive film (1 cm2 × 1 cm2) and gel formulation. For the preparation of mucoadhesive film solvent casting method is used in which the polymer (1% w/v) first dissolved in distilled water followed by addition of plasticizer polyethylene glycol (50% w/v of polymer) on a magnetic stirrer. After that the calculated amount of drug was added in such a way that each film contains 3 mg of drug and stirred the solution for 6 hours.
Allowed the solution to stand overnight for 24 hours for removal of all bubbles in the solution. Then the resulting solution was poured into the petridish and allowed to dry at room temperature for 24 hours 20. For gel formulation, 1% w/w of HPMC K 100M was taken into 100 ml beaker and was allowed to wetting for 24 Hrs. After that the volume was made up to 100 ml using double distilled water. The polymer was dissolved completely using magnetic stirrer. Then BNZ and methyl paraben were added (0.15% w/w of both) in the above solution and was mixed well 21.
Assay of BNZ in Mucoadhesive Film and Gel Formulation: To determine the drug content uniformity three films containing (3 mg of drug) were taken in separate 100 ml volumetric flask. 100 ml of pH 6.8 phosphate buffer was added and continuously stirred for 24 hrs. The solutions were filtered and analyzed at 305.6 nm by UV Spectrophotometer. The average of drug contents of three films was taken as final reading 22. 100 mg of prepared gel (equivalent to 1.5 mg of BNZ) was weighed accurately and it was dissolved in 100 ml of phosphate buffer of pH 6.8. The conical flask containing gel was shaken for 2 hrs on mechanical shaker in order to get complete solubility of BNZ. The resulting solution is filtered through whatmann filter paper, the BNZ content was analyzed spectrophotometrically at 305.6 nm using an UV spectrophotometer (Systronics, India). The measurement was carried out in triplicate and the average BNZ content in the topical gel was calculated 23.
RESULTS AND DISCUSSION:
Determination of Absorption Maxima (λ max):
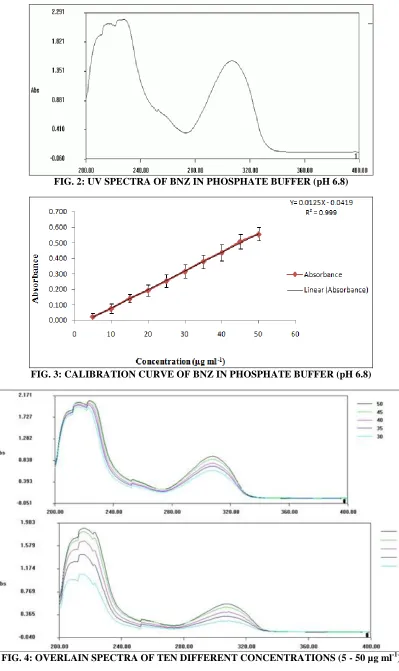
The standard stock solution (100 µg ml-1) of Benzydamine Hydrochloride showed absorbance maximum (λ max) at 305.6 nm (Fig. 2), and this wavelength is selected for constructing the calibration
plot as well as for further analysis of drug.
Linearity: The drug was found to be linear in the concentration range of 5 - 50 µg ml-1 (Fig. 3). The Correlation co-efficient (r2) value was found to be 0.999. From the calibration curve as well as from overlap spectra (Fig. 4) of different concentration of BNZ shows that the drug obeys Beer’s law limit within 5 - 50 µg ml-1 concentration range.
0.371 as given in Table 2. The measured % RSD values were found to be within the acceptance limit
of ≤ 2% indicated good precision of the developed method.
FIG. 2: UV SPECTRA OF BNZ IN PHOSPHATE BUFFER (pH 6.8)
[image:5.612.105.504.88.759.2]FIG. 3: CALIBRATION CURVE OF BNZ IN PHOSPHATE BUFFER (pH 6.8)
TABLE 1: RESULTS OF ACCURACY STUDIES OF BNZ Recovery
Level
Initial Conc. (µg ml-1)
Conc. of standard drug added (µg ml-1) (*n = 3)
Amount recovered (µg ml-1) (*n = 3)
% age Recovery (*n = 3)
% RSD
50% 10 5 15.013 100.08 0.619
100% 10 10 19.983 99.91 0.200
150% 10 15 24.700 98.80 0.263
Mean 99.59 0.360
*Each value is the average of three determinations; RSD: Relative Standard deviation.
TABLE 2: INTRA-DAY PRECISION AND INTER-DAY PRECISION DATA FOR BNZ
Intra-day Precision Inter-day Precision
Conc. taken (µg ml-1)
Mean Conc. found (µg ml-1) ± SD (*n = 3)
% RSD
Conc. taken (µg ml-1)
Mean Conc. found (µg ml-1) ± SD (*n = 3)
% RSD
10 10.449 ± 0.046 0.440 10 9.806 ± 0.058 0.591
15 13.984 ± 0.047 0.336 15 13.777 ± 0.037 0.268
20 18.715 ± 0.086 0.459 20 18.385 ± 0.047 0.255
Mean 0.411 0.371
*Each value is the average of three determinations; SD: Standard deviation; RSD: Relative Standard deviation
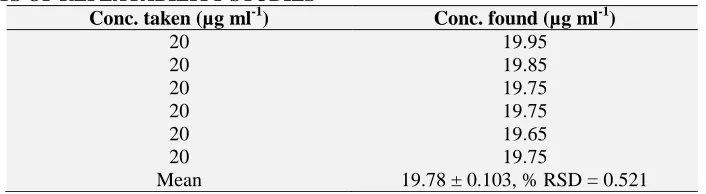
Repeatability: The repeatability of the instrument was validated by taking the absorbance of six samples of the same concentration (20 µg ml-1). The mean concentration found was 19.78 µg ml-1.
[image:6.612.130.483.348.445.2]The SD and the % RSD were in the given limits (≤ 2%) indicates that the proposed method is repeatable as shown in Table 3.
TABLE 3: RESULTS OF REPEATABILITY STUDIES
Conc. taken (µg ml-1) Conc. found (µg ml-1)
20 19.95
20 19.85
20 19.75
20 19.75
20 19.65
20 19.75
Mean 19.78 ± 0.103, % RSD = 0.521
SD: Standard deviation; RSD: Relative Standard deviation.
Robustness: Robustness studies assumed that the small variations in any of the variables did not significantly affect the results as given in Table 4.
[image:6.612.46.570.529.635.2]This provided an indication for their liability of the proposed method during routine analysis.
TABLE 4: RESULTS OF ROBUSTNESS STUDIES
At 303.6 nm At 307.6 nm
Conc. ( µg ml-1)
Conc. found ( µg ml-1)
Statistical analysis
Conc. ( µg ml-1)
Conc. found ( µg ml-1)
Statistical analysis
30 30.24 30 32.22
30 31.53 Mean = 31.30 30 32.12 Mean = 32.42
30 31.43 30 32.42
30 31.43 SD = 0.540 30 32.42 SD = 0.228
30 31.53 30 32.72
30 31.63 % RSD = 1.72 30 32.62 % RSD = 0.703
SD: Standard deviation; RSD: Relative Standard deviation.
Ruggedness: The results did not show any major statistical difference between operators suggesting
that method developed was rugged as given in Table 5.
TABLE 5: RESULTS OF RUGGEDNESS STUDIES
Analyst 1 Analyst 2
Conc. ( µg ml-1)
Conc. found ( µg ml-1)
Statistical analysis
Conc. ( µg ml-1)
Conc. found ( µg ml-1)
Statistical analysis
30 33.31 Mean = 33.72 30 32.12 Mean = 32.72
30 33.81 30 32.72
30 34.00 SD = 0.400 30 32.82 SD = 0.116
30 33.51 30 32.82
30 33.81 % RSD = 1.23 30 32.72 % RSD = 0.350
SD: Standard deviation; RSD: Relative Standard deviation.
Sensitivity: LOD and LOQ of the drug were calculated as per ICH guideline. LOD and LOQ values for BNZ were found to be 1.00 µg ml-1 and 3.04 µg ml-1 respectively.
Forced Degradation Study: From the result given in Table 6, it was found that there were no significant changes in absorbances after performing
[image:7.612.54.564.254.341.2]acid hydrolysis, alkaline hydrolysis, photolytic degradation, and thermal degradation. But there is significant change in absorbance value after performing oxidative hydrolysis confirming that drug is susceptible to oxidative hydrolysis having % age degradation of 87.90 %.
TABLE 6: RESULTS FOR STABILITY OF DRUG UNDER FORCED DEGRADATION STUDY Parameter
studied
Concentration taken (µg ml-1)
Concentration found (µg ml-1)
% age Degradation
% age Recovery
Acid Hydrolysis 20 18.51 7. 45 92.55
Alkaline Hydrolysis 20 18.73 6. 35 93.65
Oxidative Degradation 20 2.42 87.90 12.10
Thermal Degradation 20 19.82 0.9 99.10
UV Degradation 20 19.89 0.55 99.45
*Each value is the average of three determinations.
Assay of BNZ in gel formulation: The validated UV spectrophotometric method was applied to the direct estimation of BNZ HCl in mucoadhesive film and gel formulation using calibration curve
method. From the absorbance value, the drug content was calculated. The results were found as shown in Table 7.
TABLE 7: RESULTS OF THE ASSAY OF PHARMACEUTICAL FORMULATION
Formulation Amount Taken
Equivalent to (µg ml-1)
UV Spectrophotometric Method Amount Recovered
(µg ml-1) ± S. D.*
% Drug Recovered
% RSD
Mucoadhesive Films (3 mg of Drug ) 30 29.65 ± 0.018 98.83 0.061
Mucoadhesive Gel (0.15% w/w) 15 14.78 ± 0.015 98.53 0.101
*Each value is the mean of three values; SD: Standard deviation; RSD: Relative Standard deviation.
All the validation parameters are summarized in Table 8, showed that proposed UV spectro-photometric method was found to be novel, rapid,
simple, precise, selective, reproducible and economical.
TABLE 8: SUMMARY OF ALL THE VALIDATION PARAMETERS
Validation Parameters Result
Absorption maxima (λ max) 305.6 nm
Linearity Range 5 – 50 µg ml-1
Standard Regression Equation Y = 0.0125X - 0.0419
Slope (m) 0.0125
Intercept 0.0419
Correlation Co-efficient (r2) 0.999
% Recovery (n = 3) 99.59 %
% RSD for Intra-day (n = 3) Precision 0.411
% RSD for Inter-day (n = 3) Precision 0.371
Repeatability (% RSD) 0.521
Robustness (% RSD) At 303.6 nm 1.72
At 307.6 nm 0.70
Analyst 2 0.35
LOD 1.00 µg ml-1
LOQ 3.04 µg ml-1
% Drug Recovered (Assay) Film 98.83 %
Gel 98.53 %
CONCLUSION: The developed UV spectro-photometric method was found to be novel, rapid, simple, precise, selective, reproducible and economical. The results reveal that the proposed UV spectrophotometric method can be successfully applied for the routine quality control analysis of Benzydamine Hydrochloride in bulk and in pharmaceutical dosage form and cost of analysis is
less and do not require sophisticated instrumentation
as compared to reported methods.
ACKNOWLEDGEMENT: The authors are
grateful to I. K. Gujral Punjab Technical University,
Kapurthala, Rayat Bahra Instittue of Pharmacy, Hoshiarpur and ASBASJSM College of Pharmacy, Bela, Ropar, Punjab for the providing us the facilities for carrying out this research work. The authors would also thankful to Harika Drugs Pvt. Ltd., Hyderabad for providing the gift sample of Benzydamine Hydrochloride and Colorcon Asia Pvt. Ltd., Goa for providing the gift sample of HPMC K100M polymer.
CONFLICT OF INTEREST: The authors declare
that there is no conflict of interests regarding the publication of this paper.
REFERENCES:
1. British Pharmacopoeia 2009, Vol. I, Monographs: Medicinal and Pharmaceutical Substances, Benzydamine Hydrochloride.
2. Wang J and Moore DE: A study of the photodegradation of benzydamine in pharmaceutical formulations using HPLC with diode array detection. J Pharm Biomed Anal 1992; 10: 535-540.
3. Epstein JB and Stevenson-Moore P: Benzydamine hydrochloride in prevention and management of pain in oral mucositis associated with radiation therapy.Oral Surg Oral Med Oral Pathol 1986; 62: 145-148.
4. El-Didamony AM: Spectrophotometric determination of benzydamine HCl, levamisole HCl and mebeverine HCl through ion-pair complex formation with methyl orange. Spectrochimica Acta Part A: Mol Biomol Spect. 2008; 69: 770-775.
5. Benson HAE and Mcelnay JC: High-Performance Liquid Chromatography assay for the measurement of Benzydamine Hydrochloride in topical pharmaceutical preparations. J Chromatogr 1987; 394:395-399.
6. Carlucci G and Mazzeo P: High-performance liquid chromatographic determination of 1-benzyl-1H
-indazol-3-ol in benzydamine in pharmaceutical formulations. J Pharm Biomed Anal 1996; 14: 655-657.
7. Li W, Su X, Zhang H, Nie L and Yao S: Determination of benzydamine hydrochloride in serum and urine by using a benzydamine ion-selective piezoelectric sensor. Anal Sci 1998; 14:955-960.
8. De Jesus D S, Couto CM, Araujo AN and Montenegro MC: Amperometric biosensor based on monoamine oxidase (MAO) immobilized in sol-gel film for benzydamine determination in pharmaceuticals. J Pharm Biomed Anal 2003; 33: 983-990.
9. Carlucci G, Iuliani P and Federico LD: Simultaneous determination of benzydamine hydrochloride and five impurities in an oral collutory as a pharmaceutical formulation by High - Performance Liquid Chromato-graphy. J Chromatogr Sci. 2010; 48: 854-859.
10. Government of India. The Indian Pharmacopoeia: New Delhi, India: Controller of Publication; Volume 1, Buffer Solutions 2007; 240- 242.
11. Kumar BK, Thiruvengada Rajan VS and Begum NT: Analytical method development and validation of lidocaine in ointment formulation by UV spectro-photometric method. Int J Pharm Pharm Sci 2012;4: 610-614.
12. JainP S, ChaudhariAJ, Patel SA, PatelZN and Patel DT: Development and validation of the UV spectrophotometric method for determination of terbinafine hydrochloride in bulk and in formulation. Pharm Methods 2012; 2: 198-202. 13. Sethuraman S, Radhakrishnan K and Solomon TA:
Analytical method development and validation of caffeine in tablet dosage form by using UV spectroscopy: Int J Novel Trends Pharm Sci 2013; 3: 82-86.
14. Balasaheb BG, Balasaheb AK, Subhash TR, Jijabapu K and Sudhakar PS: Development and validation of UV spectrophotometric method for estimation of dolutegravir sodium in tablet dosage form. Malays J Anal Sci 2015; 19: 1156-1163.
15. Desai P, Mori K and Patel M: Development and validation of UV-visible spectrophotometric method for simultaneous estimation of momentasone furoate, hydroquinone and tretinoin from their pharmaceutical dosage form. Int J Pharm Sci Rev Res 2013; 21: 296-300.
16. Cazedey ECL and Salgado HRN: Development and validation of UV spectrophotometric method for orbifloxacin assay and dissolution studies. Braz J Pharm Sci 2014; 50: 457-465.
17. Patil SJ, Doijad RC and Dhumal PP: Development of UV-spectrophotometric method for the determination of imatinib mesylate in bulk and formulation. Asian J Pharm Clin Res 2013; 6: 54-57.
18. Sharma D, Singh G, Kumar D and Singh M: Development and validation of spectroscopic method for simultaneous estimation of Salbutamol sulphate, ambroxol hydrochloride and cetirizine hydrochloride in pharmaceutical tablet formulation: A novel technique for
in-vitro dissolution studies.Int J Pharm Pharm Sci. 2014; 6: 446-452.
sodium in pharmaceuticals Int Sch Res Notices 2014. doi: 10.1155/2014/278173
20. Bahri-Najaf R, Tavakoli N, Senemar M and Peikanpour M: Preparation and pharmaceutical evaluation of glibenclamide slow release mucoadhesive buccal film. Res Pharm Sci 2014; 9: 213-223.
21. Karavana SY, Güneri P and Ertan G: Benzydamine Hydrochloride buccal bioadhesive gels designed for oral ulcers: Preparation, rheological, textural, mucoadhesive
and release properties. Pharm Dev Technol 2009; 14: 623-631.
22. Semalty A, Semalty M and Nautiyal U: Formulation and Evaluation of Mucoadhesive Buccal Films of Enalapril Maleate. Ind J Pharm Sci. 2010, 72: 571-575.
23. Swetha CH, Velmurugun S, Raju PN and Reddy GN: Formulation and evaluation of clarithromycin topical gel. Int J Drug Dev Res 2013; 5: 194-202.
All © 2013 are reserved by International Journal of Pharmaceutical Sciences and Research. This Journal licensed under a Creative Commons Attribution-NonCommercial-ShareAlike 3.0 Unported License.
This article can be downloaded to ANDROID OS based mobile. Scan QR Code using Code/Bar Scanner from your mobile. (Scanners are available on Google Playstore)
How to cite this article: