Effect of Load Models on Battery-Switching Station
Allocation in Distribution Network
J.J. Jamian1, M.W. Mustafa1, Z. Muda1, H. Mokhlis2, M.M. Aman2 1
Faculty of Electrical Engineering, Universiti Teknologi Malaysia, 81310 UTM Johor Bahru, Malaysia 2
Faculty of Engineering, University of Malaya, 50603 Kuala Lumpur, Malaysia
Abstract—Battery-Switching Station (BSS) is one of the most important components in the growth of electrical vehicle (EV) market. In the distribution network point of view, these BSS units are a new type of load in the distribution system for charging the EV. The charging process consume real power, thus the nature of BSS load is purely resistive. Without proper allocation of BSS units, it might cause the power losses in the distribution system increase dramatically. In the present study, BSS units are located optimally utilizing Artificial Bee Colony (ABC) algorithm. The 33-bus distribution system with three distributed generators (DG) units using different load types is used as a test system. The result shows that the optimal location of BSS units does not affect the load types but has an impact to the power losses and voltage profile value.
Keywords- Battery Switching Station; Distributed Generation; Load Model, Optimization Method
I. INTRODUCTION
Environmental issues have become one of the most important concerns for the environmental researchers. Different technologies are implementing to reduce the greenhouse gases. In the power energy sectors, most of the countries are moving towards clean energy resources from conventional power supply to fulfill the needed demand [1-3]. Following the same trend, the giant vehicle companies such as Ford, BMW, Toyota, Honda and Hyundai have produced their own hybrid electric vehicles (EVs) designed to reduce the vehicle emissions and thus improving the air quality. In addition, the use of EV will also help in controlling of fuel price [4-5].
The current issues with the development of EV are charging time and the optimum placement of charging station in the distribution system. There are 3 categories of charging stations (CS) that have been categories by the Society of Automotive Engineers (SAE) J1772 which are CS level 1, level 2 and level 3 [6-7]. The level 1 and level 2 CS used the Alternating Current (AC) to charge the battery throughout the inverter with the voltage level for in AC are in range of 120 and 208 or 240 VAC respectively. Both CS categories required a longer charging time to charge fully the battery which is from the few tens of minutes to hours. However, the level 1 and level 2 do not give a large impact on the distribution system performance due to the low reactive power consumption by the inverter [8]. On the other hand, the level 3 CS used the high voltage and Fast-rate Direct Current
Charging (FDCC) approached to charge the EV in the distribution network. The charging time for this CS type is shorter than CS types 1 and 2. However, the FDCC will cause the undesirable voltage drop in the system, increase the short circuit level and have some impact to the existing protection system [9].
The concept of BSS can be used to handle the long charging time that occurred in CS types 1 and 2 and reduce the impact of charging process to the existing power system performance as CS type 3 does. For the BSS units, the users of EV need to stop and change the battery with the other battery that has been fully charged. The owner of BSS will charge the battery himself using the CS level 2 in order to reduce the impacts of charging process in distribution network and sell it to the next customer. Thus the problems of charging time and the impacts to the power system can be reduced.
However, the interconnection of BSS units with the distribution network might cause the power losses to increase dramatically and further result in voltage collapse if the stability of the system affected. Thus in the present study, the used of optimization methods, Artificial Bee Colony (ABC) is implemented to find the optimal location of BSS units in the distribution network. Furthermore, performance of ABC is also tested on different load model.
II. PROBLEM DESCRIPTION A. Battery Switching Station
The proper allocation of BSS units in the distribution network is important in order to reduce the possible impact of increase power losses in the system. Unlike the normal charging station units where the power consumption by the charging point is uncertainty, which is based on the user usage states (charging or not-charging), however the power consumption by the BSS units can be presented as a constant value. This is due to the charging process that will be made continuous by BSS owners to charge all the available batteries present in their stations.
(SoC) [11], the BSS units are presented as a constant current load in the analysis given by Eqn. (1).
( )
i rated iBSS BSS V
P − = (1)
where
PBSS-i active power consumption by BSS units at bus i
BSSrated The rated BSS power consumption (77kW)
Vi voltage magnitude at bus i
Figure 1. The Battery Swithing Station Illustration
Furthermore, the maximum number of BSS units that can be connected in any bus in the network should be not more than 2 units. Since each BSS consists of 10 charging slots, 2 units of BSS is assumed to have enough capacity to support the demand of EV at that particular area. Besides that, it is not practical to allocate too many BSS units in the same location/bus. Therefore, during the optimization analysis, the number of BSS units will also be included as a system constraints.
B. Load Model
In the proposed study, five different load models are used to investigate the impacts of load model to the BSS allocation. Therefore, rather than use only the constant value for active power and reactive power in the conventional analysis, other loads model that are dependent on voltage and frequency of the system are also being used to investigate the BSS allocation results. The characteristic of the load model are presented by using the exponential method as shown in Eqs. (2) and (3).
( )
α V PPLi= Lio (2)
( )
β V QQLi= Lio (3) where
α active power component
β reactive power component
PLio rated active power value
QLio rated active power value
Table 1 shows the α and β values for five load model that used in this study [12].
TABLE I. TYPICAL LOAD TYPE AND EXPONENTIAL VALUES
Case Load Type α β
1 Constant Load 0.00 0.00
2 Residential Load 0.92 4.04
3 Comersial Load 1.51 3.40
4 Industrial Load 0.18 6.00
5 Mixed Load Consist of all type loads in the system
III. IMPLEMENTATION OF ABC ALGORITHM FOR BSSCASES The original Artificial Bee Colony (ABC) introduced by Karaboga [13] is an optimization method that replicating the behavior of the bees in searching food location. The ABC consists of 3 groups of bees, which presented by employed bees, onlooker bees and scout bees. Each group of bees represents different phases and different functions in the process to obtain the best food source. Figure 2 shows the overall process of ABC in solving the optimization problems.
From the flow chart, the initial scout bees were generated randomly to each area in search for possible solution. After the possible solutions were found, this information will be passed down to the employed bees. The employed bees will start to look for the other possible solutions (neighboring food source) that near to the solution area that given by initial bees using (4). The results between the initial solution and the employed bees will be compared and the greedy selection is applied based on the fitness evaluation function in (5).
(
kj)
old ij old
ij new
ij x range x x
x = + * − (4)
i i
s PowerLosse Fitness
Evaluate
− −
+ =
1 1
(5) Next, the onlooker bees will find the next solution based on fitness information that is obtained by employed bees. If the possible solution by onlooker bees was depleted (reach to the maximum limit), the onlooker bees will now became the scout bees again and dispatched to search for new possible solution area randomly. The whole process mentioned above will be repeated until the predetermine value is reached. For this study, the “all the bees types” represent the BSS units location and the “possible solutions” signify the power losses value in the distribution system. Since 6 units of BSS will be allocated in the network, the dimension (number of variable) of the analysis is set to “6” as well. The number of Bees in each population is 40 and maximum iteration is 200.
IV. RESULTS AND DISCUSSIONS
The 33 bus distribution network is used to test the performance of the ABC in finding the optimal allocation of BSS units, shown in Fig. 3.
Figure 3. 33-bus distribution network with 3 DG units
From Figure 3, three DG units which operated in PV mode are located at the system at buses 6, 16 and 25 with the initial capacity for each of them are 2.4878MW, 0.3556MW and 0.7291MW respectively. The locations and initial sizes of DG units are obtained using mathematical approaches, used in [14]. However, the DG units are not in the best optimal size. Thus, the optimal location of BSS units could improve the power losses value in the system.
The initial power losses without any BSS units in the system are 51.4814kW, 49.2189kW, 49.9772kW, 47.6811kW and 49.8396kW for constant load, residential load, commercial load, industrial load and mixed load respectively.
Without the proper allocation of BSS units in the distribution network, the power losses in the network might increase dramatically. Figure 4 shows an example of power losses value after six units of BSS units being located randomly in the constant power lower load case (Case 1). From the results, the power losses value after the BSS allocation is unpredictable and higher than initial condition. It is proved that connection of BSS units will give an impact to the power system performance.
48 50 52 54 56 58 60 62
1 2 3 4 5 6
P
o
w
er
L
o
ss
es
(k
W
)
Number of BSS units placement
Sample 1 Sample 2 Sample 3 Sample 4 Sample 5
Figure 4. The power losses in network due to uncoordinated BSS allocation
Table II shows the optimal location of BSS units in the 33 bus distribution system using the ABC algorithm.
TABLE II. THE OPTIMAL BSS ALLOACATION IN DIFFERENT LOAD MODELS
Case Load Type BSS Location Power Losses 1 Constant Load 6, 6, 7, 7, 26, 26 38.1401 2 Residential Load 6, 6, 7, 7, 26, 26 34.7834 3 Comersial Load 6, 6, 7, 7, 26, 26 34.9657 4 Industrial Load 6, 6, 7, 7, 26, 26 33.9575 5 Mixed Load 6, 6, 7, 7, 26, 26 35.0011
From the results, the optimal location of BSS units is similar for all cases regardless the load types in the system. By allocating the two BSS units at buses 6, 7 and 26 respectively, the power losses in the network can be reduced, compared to the initial power losses as shown in Fig. 5.
51.481
49.219 49.977
47.681 49.840
38.140
34.783 34.966 33.957 35.001
0 10 20 30 40 50 60
Constant Load
Residential load
Comercial load
Industrial load
Mix load
Initial Power Losses New Power Losses
Figure 5. The comparison of initial and new power losses in the system after optimal BSS allocation
2 3 4 5 6 7 8 9 10 11 21 13 14 15 16 17 18
1
9 20 21 22
2
6 27 28 29 30 31 32 33
2
3 24 25
Su
b
st
at
io
n
13
2/
12
.6
6
kV
D
G DG
D
Among all load types analyses, the industrial loads gave the smallest power losses value after the BSS allocation which is 33.9575kW while the constant load analysis gave the highest value which is 38.1401kW. However, by comparing the percentage of power losses reduction as shown in Fig. 6, the commercial load analysis gave the highest power losses improvement followed by mix load, residential load, industrial load and constant power load analyses. Therefore, the load types gave different percentages of power losses improvement in the distribution network after the optimal allocation of BSS units.
25.915 %
29.329 %
30.037 % 28.782 %
29.773 %
Constant Load
Residential load
Comercial load
Industrial load
[image:4.612.79.280.177.332.2]Mix load
Figure 6. The power losses improvement after BSS allocations
The optimal allocation of BSS units does not only affect the power losses value, but it also changed the voltage profile of the distribution network. However, since there is 3 DG units that operating in PV mode, the different on voltage profile between these two cases (before and after BSS allocations) is too small. Figure 7 shows the comparison of voltage profile for the mix load analysis. By allocating the BSS units, the voltage values at some buses have decayed compared to initial condition. However, the voltage changes are too small (at 4th decimal places) and can be ignored.
0.955 0.960 0.965 0.970 0.975 0.980 0.985 0.990 0.995 1.000
1 3 5 7 9 11 13 15 17 19 21 23 25 27 29 31 33
V
o
lt
a
g
e
(
p
.u
)
Bus Number
Before BSS Allocation After BSS allocation
0.9985 0.9988 0.9990 0.9993 0.9995 0.9998 1.0000
Figure 7. The comparison of voltage profile for mix-load cases
The similar results have also been shown for the other loads type analyses where the impacts of BSS allocation do not affect too much on voltage profile. Table III shows the minimum voltage that appeared in the system before and after BSS allocation as well as the percentage of minimum voltage changes. The constant power load model gave the lowest voltage minimum value compared to others load model either before or after the BSS allocation and gave the highest percentage of voltage changes after the BSS allocation which is nearly to 0.021 percent.
TABLE III. THE OPTIMAL BSS ALLOACATION IN DIFFERENT LOAD MODELS
Case Load Type
Vmin Before
BSS allocation
Vmin After
BSS allocation
Voltage Drop (%)
1 Constant Load 0.968700 0.968498 0.020853 2 Residential Load 0.970569 0.970381 0.019370 3 Comersial Load 0.970621 0.970433 0.019369 4 Industrial Load 0.970845 0.970658 0.019262 5 Mixed Load 0.970621 0.970525 0.009891
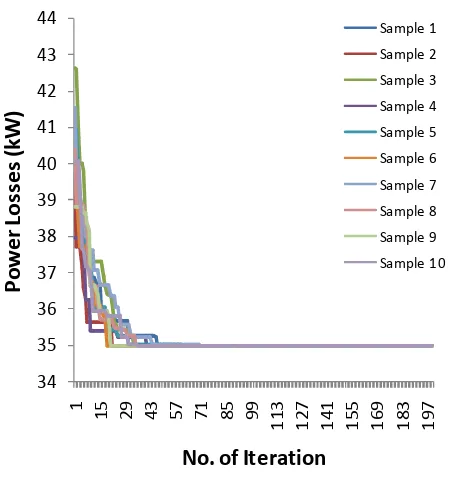
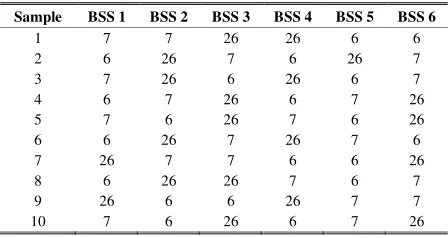
In term of ABC performance, the algorithm gave the similar results for BSS allocation in ten samples of analysis for each loads type. Figure 8 and Table IV show the example of BSS allocation and convergence curve results that are obtained for the mix-load case.
34 35 36 37 38 39 40 41 42 43 44
1 15 29 43 57 71 85 99
1
1
3
1
2
7
1
4
1
1
5
5
1
6
9
1
8
3
1
9
7
P
o
w
e
r
Lo
ss
e
s
(
k
W
)
No. of Iteration
Sample 1
Sample 2
Sample 3
Sample 4
Sample 5
Sample 6
Sample 7
Sample 8
Sample 9
[image:4.612.315.550.180.261.2]Sample 10
Figure 8. The convergence curve to obtain minimum power losses for mixed-load case
[image:4.612.326.551.324.565.2] [image:4.612.66.292.475.640.2]TABLE IV. THE OPTIMAL BSS ALLOACATION RESULTS FOR 10 SAMPLES ON MIX LOAD ANALYSIS
Sample BSS 1 BSS 2 BSS 3 BSS 4 BSS 5 BSS 6
1 7 7 26 26 6 6
2 6 26 7 6 26 7
3 7 26 6 26 6 7
4 6 7 26 6 7 26
5 7 6 26 7 6 26
6 6 26 7 26 7 6
7 26 7 7 6 6 26
8 6 26 26 7 6 7
9 26 6 6 26 7 7
10 7 6 26 6 7 26
From the whole discussion in this analysis, ABC algorithm can determine the optimal location for BSS units in the system even with different load type analysis and it gave power losses improvement to the non-optimized DG units in the distribution system.
V. CONCLUSION
The Battery-Switching Station (BSS) units can be used as an alternative method to reduce the charging time delayed that required by the electric vehicle (EV) and reduced the impact to the power system performance by using the Charging Slot level 2. By assuming that the process of charging is only being done until 80 percent of State of Charge (SoC), the BSS units can be modeled as constant-current load in the analysis.
Without the proper coordination of BSS units, it will cause the power losses in the system increasing. Therefore, the results have shown that the ABC algorithm capable of giving the optimal location of BSS units in the network and reduced the power losses value. Regardless the load model in the system, the ABC is still capable of giving the optimal location for BSS units. The results show that the optimal locations of BSS units are similar which is two units at buses 6, 7 and 26. Although the locations are the same, the impacts to the minimum power losses value, voltage profile and their improvement are different.
Therefore, with the knowledge of the impacts of BSS units allocation, load types and coordination method, the distribution planner can include the BSS units in the distribution network without affecting (minimizing) the impacts of BSS connection to the system performance.
ACKNOWLEDGMENT
The researchers would like to express their appreciation to the Universiti Teknologi Malaysia (UTM), Ministry of Higher Education (MOHE) and Malaysian Government for funding this research (Vot. No. 01H44).
REFERENCES
[1] S. M. Moghaddas-Tafreshi and E. Mashhour, “Distributed generation modeling for power flow studies and a three-phase unbalanced power flow solution for radial distribution systems considering distributed generation,” Electric Power Systems Research, vol. 79, pp. 680-686, 2009.
[2] T. Niknam, et al., “A modified honey bee mating optimization algorithm for multiobjective placement of renewable energy resources,” Applied Energy, vol. 88, pp. 4817-4830, 2011.
[3] L. Hee-Jin, et al., “Study on Wind-Turbine Generator System Sizing Considering Voltage Regulation and Overcurrent Relay Coordination,” Power Systems, IEEE Transactions on, vol. 26, pp. 1283-1293, 2011. [4] V. Marano, et al., “Vehicle electrification: Implications on generation
and distribution network,” in 2011 International Conference on Electrical Machines and Systems (ICEMS), pp. 1-6, 2011.
[5] F. Pieltain, et al., "Assessment of the Impact of Plug-in Electric Vehicles on Distribution Networks," Power Systems, IEEE Transactions on, vol. 26, pp. 206-213, 2011.
[6] J. D. Graham, “Plug-in Electric Vehicles:A Practical Plan for Progress,” School of Public and Environmental Affairs at Indiana University, Bloomington, Indiana, February 2011.
[7] S. Wencong, et al., “A Survey on the Electrification of Transportation in a Smart Grid Environment,” IEEE Transactions on Industrial Informatics, vol. 8, pp. 1-10, 2012.
[8] C. Bai, et al., “Analyzing the impact of electric vehicles on distribution networks,” 2012 IEEE PES in Innovative Smart Grid Technologies (ISGT), pp. 1-8, 2012.
[9] Y. Chen, et al., “Integration of electric vehicle charging system into distribution network,” 2011 IEEE 8th International Conference on Power Electronics and ECCE Asia (ICPE & ECCE), pp. 593-598, 2011. [10] N. R. E. L. (NREL), "Plug-In Electric Vehicle Handbook " April 2012.
[11] [11] M. Etezadi-Amoli, et al., "Rapid-Charge Electric-Vehicle Stations," IEEE Transactions on Power Delivery, vol. 25, pp. 1883-1887, 2010.
[12] E D. Singh, D. Singh, K. S. Verma, “Multiobjective Optimization for DG Planning With Load Models,” IEEE Trans. Power Syst., vol. 24, no. 1, pp. 427-436, Feb. 2009.
[13] Karaboga, N., A New Design Method on Artificial Bee Colony Algorithm for Digital IIR Filters, Journal of the Franklin Institute 346, pp. 328-348, 2009.