International Journal of Emerging Technology and Advanced Engineering
Website: www.ijetae.com (ISSN 2250-2459,ISO 9001:2008 Certified Journal, Volume 4, Issue 9, September 2014)
629
Map Reduce Text Clustering Using Vector Space Model
R. C. Saritha
1, Dr. M. Usha Rani
21Research Scholar, 2Professor, Department of Computer Applications, Sri Padmavathi Mahila Visvavidyalayam, Tirupati
Abstract— Information retrieval is the area of finding particular web pages via a query to an internet search engine. Even though well sophisticated algorithms and data structures are used in traditional computer techniques to create indexes for efficiently organize and retrieve information systems, currently data mining techniques like clustering are used to enhance the efficiency of retrieval process. Most of the data on the internet is in the form of unstructured, text clustering becomes mandatory step for search engines to group the similar text documents for faster information retrieval. In order to store elastic resources of unstructured data, Hadoop is coined to store and compute data in parallel and distributed environment. The well known traditional approach to cluster text documents is vector space model implemented by k-means algorithm. This paper presents map reduce approach for clustering the documents using vector space model. The experimental study shows that this approach is efficient with the increase of text corpus along with number of nodes in the cluster.
Keywords—Vector space model, map reduce, text clustering, map reduce k-means, Hadoop
I. INTRODUCTION
Currently, big data and map reduce are buzz words in the cutting edge technologies. Most of the data on the internet is in the form of unstructured, which need to be analysed to find the non-trivial and hidden information. Usually, web crawler or web bots progressively captures the web text information, which is growing enormously every day and need sufficient resources for storage and computation. In order to support elastic resources to store big data, Hadoop is coined to store and compute data in parallel and distributed environment. Hadoop is a parallel and distributed environment to store large data sets in order of gigabytes and petabytes, and the web search engines can do better information retrieval process to categorize the web textual information. Mathematical models like Boolean model, probabilistic model , vector space model are proposed to use in information retrieval systems. Vector space model (VSM) [1] is most popular and widely used model.
II. BACKGROUND
A. Vector space model:
In VSM[3], A term document matrix t X d is created, where t is the terms(words) of the documents and d represents documents and find the frequency of the terms in each and every document.
This term frequency cannot able to find its importance in the whole corpus rather cannot compare with other documents. Term frequency -Inverse document frequency (TF-IDF) overcomes the limitations of term frequency and calculated term weighting to find how important a word is to a document in a collection or corpus.
The weight vector for document d is
,
Where
|{ | } - (1)
is the term frequency of term t in document d (a local
parameter)
|{ | } is inverse document frequency (a global
parameter)
is the total number of documents in the document set
|{ | } is the number of documents containing the term t
B. K-means clustering:
Cluster is a set of objects in which each object is similar to the prototype. For continuous data, the average mean of all points within the cluster called centroid is the prototype and for categorical data, the most representative point in the cluster medoid is often as prototype. The centroid never corresponds to any point in the cluster where as medoid by definition it is a actual data point. For some other types of data the central point is considered as prototype.
K-means is a oldest and widely used centroid prototype based partitional clustering technique that attempts to find a user specified number of clusters( K). The k-means algorithm starts by choosing k initial centroids, where is the user defined parameter. Each data point is assigned to the nearest centroid and closest centroid. The collection of data points assigned to a centroid is a initial clusters. Based on points assigned into cluster, the centroid of each cluster is updated and repeated continuously until no data point changes clusters.
The basic K-means Algorithm is as follows:
Step 1 : Select K points as initial centroids
International Journal of Emerging Technology and Advanced Engineering
Website: www.ijetae.com (ISSN 2250-2459,ISO 9001:2008 Certified Journal, Volume 4, Issue 9, September 2014)
630
Step 3: Form K clusters by assigning each point to its closest centroid
Step 4: Recompute the centroid of each cluster
Step 5: Until centroids do not change.
The key step of Basic K-means algorithm is selection of proper initial centroids. Initial clusters are formed by random initialization of centroids.
C. Centroids and Objective function :
We need a proximity measure to assign each point to the closest centroid. Euclidean and Manhattan distances are often used for Euclidean space and Cosine similarity and Jacquard measures[2] are employed for documents. Since K-means algorithm recompute the centroid of each cluster , in every iteration, similarity of each point to the centroid is calculated repeatedly. The goal of the clustering is expressed as an objective function that depends on the proximities of the points to one another or to the centroids of the cluster. For example, the objective function is defined as to minimize the squared distance of each point to its closest centroid. For Euclidean space , Steps 3 and 4 of K-means algorithm attempts directly to minimize sum of squared error(SSE) which is defined as follows:
SSE =∑ ∑
K-means algorithm is also used to cluster documents which is represented as document-term matrix as explained in (1). The objective function of the clustering is to maximize the similarity of the documents in a cluster to the cluster centroid. This quantity is also known as cohesion of the cluster.
Total Cohesion = ∑ ∑
Cosine similarity quantified as the cosine of the angle between the vectors , this is called cosine similarity. Let two documents be ⃗ and ⃗ , their cosine similarity is
Cosine( ⃗ , ⃗ ) = ⃗ ⃗
| ⃗ | ⃗
Where ⃗⃗ and ⃗ are m-dimensional vectors over term set T = {t1, t2, t3 ..., tm}. Each dimension
represents a term with its weight in the document, which is non-negative.
The conditions for stopping criterion of recalculating centroids will be one of the following:
1. Completing the given fixed number of iterations 2. Centroids do not change between iterations 3. Terminate the loop when SSE or total cohesion
falls below the predefined threshold.
D. Map reduce Programming:
Hadoop[8] is a platform that provides both distributed data storage and computational capabilities with reliability and scalability among clusters of nodes. Hadoop is a distributed master-slave architecture that consists of Hadoop Distributed file system (HDFS)[6] for storage and Map reduce[7] for computational capabilities that scales with the addition of hosts to a hadoop cluster. With MapReduce and Hadoop, computation is executed at the location of the data rather than moving data to the compute location. Map reduce splits the application into many small fragments of work, each of which may be executed or re-executed on any node in the cluster.
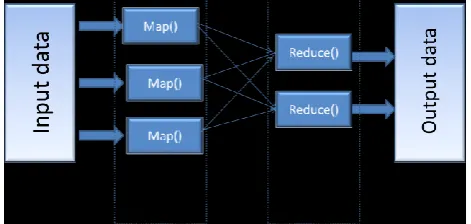
Conceptually, a Mapreduce job takes a set of input key-value pairs and produces a set of output key-value pairs by passing the data through map and reduces functions. The key-value pairs generated is equal to the number of input splits and passed as arguments to the map functions. key-value pair is the basic data structure in Map reduce. The programmer defines a mapper and a reducer with the following signatures:
map: (k1,v1)→[(k2,v2)] reduce: (k2,[v2])→[(k3,v3)]
[image:2.595.315.551.633.745.2]Where (k1,v1) are input key value pairs to map function and (k2,v2) are the ouput key value pairs of map function. These intermediate set of (k2,v2) key-value pairs that the reduce tasks uses as input. The reducer is applied to all values associated with the same intermediate key to generate output key-value pairs. Between the map and the reduce tasks, a shuffle step sorts all map output values with the same key into a single reduce input (key, value-list) pair, where the „value‟ is a list of all values sharing the same key. Thus, the input to a reduce task is actually a set of (key, value-list) pairs and outcome will be the merge of value list. Implicit between the map and reduce phases is a distributed “group by” operation on intermediate keys. The map and reduce tasks performed at different data nodes concurrently in the cluster and output is stored in HDFS. The computation by map reduce tasks is shown in detail by the Figure 1.
International Journal of Emerging Technology and Advanced Engineering
Website: www.ijetae.com (ISSN 2250-2459,ISO 9001:2008 Certified Journal, Volume 4, Issue 9, September 2014)
631
III. MAP REDUCE K-MEANS CLUSTERING APPROACH
The map reduce k-means clustering approach for processing big text corpus [4] can be done by the following steps:
1.Create sequence file from directory of text documents
2.Tokenize and generate TF-IDF vector for each document from sequence file
3.Apply map reduce K means algorithm to form k clusters
A. Create sequence file from Directory of Text Documents
Map reduce programming is coined to process huge data sets in parallel and distributed environment. Suppose, the input data selected is a well known Reuters-21578 document set, the text files in the directory are small in size. Since HDFS and Mapreduce are optimized for large files , convert the small text files into larger file i.e, SequenceFile format. SequenceFile is a hadoop class, which allows us to write document data in terms of binary <key, value> pairs, where key is a Text with unique document id and value is Text content within the document in UTF-8 format. SequenceFile packs the small files and process whole file as a record. Since the SequenceFile is in binary format, we could not able to read the content directly but faster for read /write operations.
B. Creating TF-IDF vectors from sequence file:
The sequence file from the previous step is fed as input to create vectors. The TF-IDF vectors is calculated in Map reduce by the following steps:
Step 1 : Tokenization : The input fed to map function is in format of <key, value> pairs , where key is the document name and value as document content. The outcome of reduce function is also <key, value> pair where key is document name and value are tokens (words) present in that document.
Ex: Key: /acq1.txt: Value: [macandrews, forbes, holdings, bids, revlon, mcandrews, forbes, holdings, inc, said, offer, dlrs, per, share, all, revlon, group]
Step2 : Dictionary file: This step assign unique number to each token in all documents. The input format for the
map function is <document name, wordlist> and the output of reduce function is <Word, uniqueid>. Ex:: Key: accounts: Value: 152.
Step 3: Frequency count: The number of times the word appears globally in all documents is calculated in this step. The input to this map function is <docname, words> and output format is <word id , 1>.
The values of output of the map function is accumulated and find the sum in reduce function. The output format of reduce function is <word id, count>. Ex: Key: 50: Value: 2
Step 4 : Calculate term frequency : The map reduce function in this step takes input as <docname, wordlist > and counts the number of times each word or term ti
occurs in that document dj. The outcome of this step is in
the format of <docname, {ti : count}>.
Ex: In the below example, acq1.txt is document name and the values are in the format of list of (wordid :count) Key:/acq1.txt: Value: {3258:1.0, 3257:1.0, 157:2.0, ....}
Step 5 : Calculate tf-idf value : The output of step 4 is taken as input to map function of this step and calculates the weight vector as tf X tf-idf value of each term ti
in each document dj as specified in equation(1). The
output format of the result is <docname, {t1 :tf-idf1, t2
:tf-idf2, ...ti:tf-idfi}>.For example: The output format of this
step is as follows:
Key:acq1.txt: Value: { 3258:0.12728, 3257:0.12728 , 462:0.08060 ...}
C. Map reduce k-means algorithm
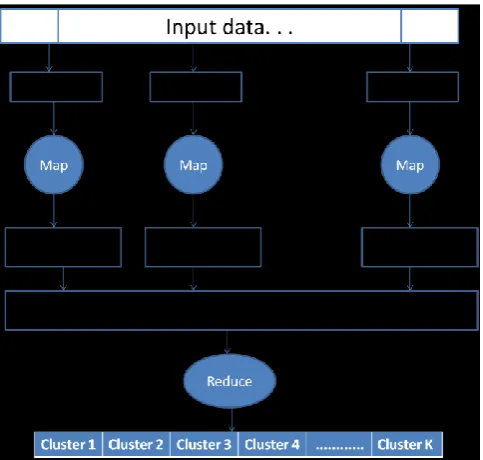
[image:3.595.317.559.497.727.2]The implementation of map reduce k-means [4] accepts two input files. One input file contains the documents with each term and its tf-idf values, and the second is k initial centroids file. The set of k initial centroids are selected randomly. In every iteration, the map reduce framework splits the input data into M splits and then processed in parallel as shown in Figure 2.
International Journal of Emerging Technology and Advanced Engineering
Website: www.ijetae.com (ISSN 2250-2459,ISO 9001:2008 Certified Journal, Volume 4, Issue 9, September 2014)
632
The map function read the document in the format of <docname, {t1 :tf-idf1, t2:tf-idf2, ...ti:tf-idfi}> along with
randomly selected set of k initial centroids. The mp function determines the document set which are closer to the centroids by calculating cosine similarity measure and emits records containing all documents data with k-centroids in the format as <k-center, {docname, {t1
:tf-idf1, t2:tf-idf2, ...ti:tf-idfi}>. The reducer function receives
the output of map function k-centroids along with closest documents bound to it. and calculates new k-centroid. The mapper and reducer algorithm of k-means is explained as below:
Algorithm for Mapper
Input: A set of objects X = {x1, x2,…..,xn}, A Set of initial Centroids C = {c1, c2, ,ck}
Output: A output list which contains pairs of (Ci, xj)
where 1 ≤ i ≤ n and 1 ≤j ≤ k Procedure
M1←{x1, x2,………,xm}
current_centroids←C
distance (p, q) =√∑ (where pi (or qi)
is the coordinate of p (or q) in dimension i) for all xi
ϵ
M1 such that 1≤i≤m dobestCentroid←null minDist←∞
for all c
ϵ
current_centroids do dist← distance (xi, c)if (bestCentroid = null || dist<minDist) then
minDist←dist bestCentroid ← c end if
end for
emit (bestCentroid, xi) i+=1
end for return Outputlist
Algorithm for Reducer
Input: (Key, Value), where key = bestCentroid and Value = Objects assigned to the lpgr';1\]x centroid by the mapper
Output: (Key, Value), where key = oldCentroid and value = newBestCentroid which is the new centroid value calculated for that bestCentroid
Procedure
outputlist←outputlist from mappers
𝝑 ← { }
newCentroidList ← null for all β outputlist do centroid ←β.key object ←β.value [centroid] ← object end for
for all centroid
ϵ
𝝑 donewCentroid, sumofObjects, sumofObjects← null
for all object
ϵ
𝝑 [centroid] do sumofObjects += object numofObjects += 1 end fornewCentroid ← (sumofObjects + numofObjects)
emit (centroid, newCentroid) end for
end
The outcome of the k-means map reduce algorithm is the cluster points along with bounded documents as <key,value> pairs, where key is the cluster id and value contains in the form of vector: weight. The weight indicates the probability of vector be a point in that cluster. For Example: Key: 92: Value: 1.0: [32:0.127, 79:0.114, 97:0.114, 157:0.148, ...].
IV. EXPERIMENTAL RESULTS
This section presents the results obtained by executing map reduce k means clustering algorithm on cluster of machines. The experimentation with Reuters dataset is explained in detailed in below sections.
A. Environment setup:
The experimentation is conducted in single node and multi node cluster. The single node is configured with I7processor, 4 GB memory, 64GB hard disk along with JDK 1.6.0 and hadoop 1.2.0 version. Multi node cluster is setup with 3 nodes, in which each node is configured with I7 2 core processors, 2 GB memory and 20 GB hard disk. Multi node cluster is also installed with JDK 1.6.0 and hadoop version 1.2.0, in which one is master and other two are slave nodes. The Operating system used is CentOS 6.4.
B. Dataset description
International Journal of Emerging Technology and Advanced Engineering
Website: www.ijetae.com (ISSN 2250-2459,ISO 9001:2008 Certified Journal, Volume 4, Issue 9, September 2014)
633
C. Data pre-processing :
Reuters-21578 data is available as tar file. First untar the dataset and extract the Reuters data which is in .sgm format and convert them into .txt files. Create a sequence file from Reuters text documents. Sequence file is passed as input to find tf-idf value of each term in every text document. The tf-idf file is fed as input to map reduce kmeans algorithm for form k number of clusters.
D. Results :
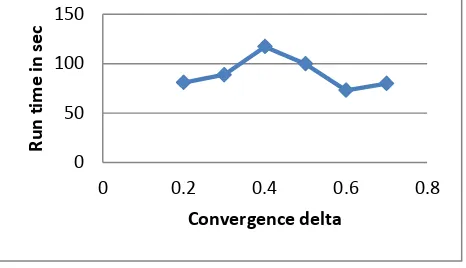
In a single node cluster, the map reduce k-means algorithm is executed with Reuters dataset with selected number of text files of 125 from 10 different topics (cpi, bop, cocoa, coffee, crude, earn, trade, acq, money-fx, oilseed). The map reduce kmeans algorithm is executed with different convergence delta values, which is a stopping criterion of recalculating centroids. The given number of clusters formed using map reduce method with cosine similarity measure, maximum iterations as 10, number of clusters as 20. The graph plotted between convergence delta and runtime execution is shown in Figure.
Figure 3: The execution time of map reduce K-means versus assigned convergence delta
The algorithm tested in both single and multi node cluster with Reuter database and the performance of the map reduce algorithm increases efficiently by increasing the number of input files and increasing number of nodes in the cluster. The runtime execution interms of seconds with growing number of input text corpus is tabulated in below table 1.
TABLEI
PERFORMANCE EVALUATION OF MAP REDUCE K-MEANS ALGORITHM Text
corpus (%)
Single node Run Time execution in
sec
Multi node Runtime execution in
sec
[image:5.595.314.554.125.292.2]10 1099.69 302.35 20 2000 560.45 30 2999.65 845.56 40 3990.75 1130.75 50 4985.35 1405.67
Figure 4: The comparision of Mapreduce k-means execution time with Text courpus in both single node and multi node cluster From the above plotted graph in Figure 4, it is observed that the execution speed of the algorithm improves with more input text files and more number of nodes in the cluster.
V. CONCLUSIONS AND FUTURE WORK
Information retrieval techniques are widely popular in most of the search engines to efficiently organize and retrive information systems. Most of the data in internet is in the format of unstrucutred and semistructured. Currently clutering techniques are used to organize and group the similar data objects to retrieve search reults faster. Traditional way of clustering text documents is Vector space model , in which tf-idf is used for k-means algorithm with supportive similarity measure. As the data is enormously increasing day by day, elastic resources are required to store and compute. Hadoop framework supports to store and compute big data in parallel and distributed platform with the help of HDFS and Map reduce. This paper exhibits an approach to cluster text documents using vector space model. The results obtained by executing map reduce k-means algorithm on both single and multi node cluster shows that the performance of the algorithm increases as the text corpus increases in multi node cluster.
In the current approach of map reduce k-means algorithm, the intial centroids are selected randomly. In future, Canopy clustering algorithm can be used as intial step to get intial centroids and then fed this as input to map reduce k-means algorithm. In future, we can try to cluster text corpus by map reduced text clustering based on frequent itemsets.
REFERENCES
[1] G. Salton , A. Wong , C. S. Yang. A vector space model for
automatic indexing. Communications of the ACM, version.18 n.11, pages.613-620, Nov. 1975.
[2] Anna Huang," Similarity measures of Text document clustering",
NZCSRSC 2008, Christchurch, New Zealand, April 2008. 0
50 100 150
0 0.2 0.4 0.6 0.8
R
u
n
tim
e
in
se
c
Convergence delta
0 1000 2000 3000 4000 5000
10 20 30 40 50
R
u
n
tim
e
e
xec
u
tion
in
se
c
Text corpus (%)
Singlenode
[image:5.595.49.282.395.529.2]International Journal of Emerging Technology and Advanced Engineering
Website: www.ijetae.com (ISSN 2250-2459,ISO 9001:2008 Certified Journal, Volume 4, Issue 9, September 2014)
634
[3] GeorgeTsatsaronis and Vicky Panagiotopoulou. A generalized
vector space model for text retrieval based on semantic relatedness. Proceedings of the EACL 2009 student research workshop, pages 70-78, April 2009.
[4] J Dittrich, JA Quiané-Ruiz . Efficient big data processing
in Hadoop MapReduce. Proceedings of the VLDB Endowment, 2012 - dl.acm.org, Volume 5 Issue 12, August 2012 ,Volume 5 Issue 12, August 2012.
[5] Weizhong Zhao, Huifang Ma, Qing He. Parallel KMeans
Clustering Based on MapReduce. Processdings of First international conference on cloudcom 2009, pages 674-679, Beijing , China, December 1-4, 2009.
[6] Sanjay, G., G. Howard, and L. Shun-Tak, The Google file system,
in Proceedings of the nineteenth ACM symposium on Operating systems principles. ACM: Bolton Lan,ding, NY, USA 2003,
[7] Jeffrey, D. and G. Sanjay,. MapReduce: simplified data
processing on large clusters. Commun. ACM, 51(1): pages 107-113 2008.