International Journal of Emerging Technology and Advanced Engineering
Website: www.ijetae.com (ISSN 2250-2459, ISO 9001:2008 Certified Journal, Volume 3, Issue 12, December 2013)
107
AASC: Advanced Ant Based Swarm Computing for
Detection of Edges in Imagery
Rebika Rai
1, Ratika Pradhan
2, M. K. Ghose
31,2,3
Department of CSE, Sikkim Manipal Institute of Technology
Abstract--The social insect allegory for working out problems has become a promising area in the recent years emphasizing on stochastic construction practice building the key probabilistically. The approach focuses on direct or indirect communications among uncomplicated agents. Swarm Intelligence is the collective behavior of decentralized, self-organized system whereby the joint behavior of agent interacting locally with the environment causes coherent global pattern to emerge. Ant Colony Optimization (ACO) is an algorithm inspired by the foraging behavior of ants wherein ants leaves a volatile substance call pheromone on the soil surface for the purpose of foraging and collective interaction via indirect communication. Edge detection mainly is the set of mathematically methods aiming to identify points in an image at which the image brightness changes sharply or formally generating some formation of discontinuities. This paper explores the Swarm computing technique called Ant Colony Optimization (ACO) and further proposes a new technique called as Advanced Ant based Swarm Computing (AASC) for edge detection of imagery.
General Terms-- Swarm Intelligence, Artificial Intelligence, Ant Colony Optimization, pheromone, Edge detection, Advanced Ant based Swarm Computing, Imagery.
Keywords--Ant Colony Optimization (ACO), Artificial Intelligence (AI), Swarm Intelligence (SI), Advanced Ant based Swarm Computing (AASC).
I. INTRODUCTION
Swarm Intelligence highlights on the problem-solving attempt made by the collective behavior of social agent. The problems vary ranging from a Travelling Salesman Problem [3][4] (TSP) to Classification [1][7] to Edge detection[2] on the other hand.
With the progress in image confining devices, the image data is being generated in high aspects. Edge detection is one of the imperative ingredients of image processing. It is effectively implicated in the pre-processing stage of image analysis and identifies the outline of an image thus providing important details about it. So, it significantly lessens the content to process for the high-level processing assignments like object recognition and image segmentation.
The most important step in the edge detection, on which the success of production of true edge map depends, lies on the determination of threshold. In this work, intention of edge detection, inspired from Ant Colonies is fulfilled using Advanced Ant Colony Optimization (AACO) technique. For the determination of threshold calculation, Otsu‟s method is used which
automatically perform clustering-based image
thresholding. The accomplishment of the proposal is visually tested with the help of test images and empirically tested on the basis of several statistical parameter of comparison.
Swarm Intelligence (SI) is the branch [12] of Artificial Intelligence that intends to basically simulate the behavior of swarms or social agents. Swarm refers to any loosely arranged collection of interacting agents that has the ability to act in a coordinated way without any coordinator or external controller. Collective intelligence is the key which basically refers to a shared or group intelligence that emerges from the collaboration and competition of many individuals and appears in consensus decision making in animals, humans and computer networks. A single ant, for example, is not that intelligent but a colony of ants is. As colonies, ants react speedily and effectively to their environment. They find shorter path to the best food source, assign workers to various tasks, and defend their territory from enemies. Ant colonies make these possible by countless interactions between individual ants. This coordination among the ants does not stem from a „center of control‟ rather each ant follows a simple rule of thumb i.e. each ant acts only on local information. A system that exhibits this performance is said to be self-organizing. And the intelligence the ant‟s exhibit collectively is called Swarm Intelligence.
II. ANT COLONY OPTIMIZATION
International Journal of Emerging Technology and Advanced Engineering
Website: www.ijetae.com (ISSN 2250-2459, ISO 9001:2008 Certified Journal, Volume 3, Issue 12, December 2013)
108
Here, the collective behavior of ants provides intelligent solution for finding the shortest path from the nest to the food source. If a single ant finds a shorter path and deposit higher concentration of pheromone on the way to food source then all the other ants gets attracted towards the higher concentration and hence following the shorter path. Ant Colony Optimization [25] is an iterative algorithm wherein at each iteration; a number of artificial ants are builds a solution by walking from vertex to vertex on the graph with the constraint of not visiting any vertex that she has already visited in her walk. At the end of an iteration [27] [28], on the basis of the quality of the solutions constructed by the ants, the pheromone values are modified in order to bias ants in future iterations to construct solutions similar to the best ones previously constructed.Artificial ants are like real ants [26] with some major differences:1) Artificial ants have memory, 2) They aren't completely blind, 3)They live in a discrete time environment.
However they have some adopted characteristics from the real ants, like 1) They probabilistically prefer path with a larger amount of pheromone, 2)Shorter path is true path, larger is the rate of growth in the pheromone concentration, 3)They communicate to each other by means of the amount of pheromone laid on each path.
The underlying mechanism for real ant system is illustrated in Figure 1 [3] [4]. Ants communicate with each other using pheromones. In species that forage in groups, a forager that finds food marks a trail on the way back to the colony; this trail is followed by other ants (Figure 1(a)), these ants then reinforce the trail when they head back with food to the colony. When the food source is exhausted, no new trails are marked by returning ants and the scent slowly dissipates. This behavior helps ants deal with changes in their environment. For instance, when an established path to a food source is blocked by an obstacle (Figure 1(b)), the foragers leave the path to explore new routes (Figure 1(c)). If an ant is successful, it leaves a new trail marking the shortest route on its return. Successful trails are followed by more ants (Figure 1(d)), reinforcing better routes and gradually finding the best path.
Figure 1(a): Ants moving from nest (source) towards its food (Destination) [3][4].
Figure 1(b): An obstacle placed on the way between nest and food [3][4].
Figure 1(c): Ants randomly choosing the path [3[4]].
Figure 1(d): Shortest path choosen by maximum ants based on pheromone deposits [3][4].
III. EDGE DETECTION
[image:2.595.319.548.133.383.2]International Journal of Emerging Technology and Advanced Engineering
Website: www.ijetae.com (ISSN 2250-2459, ISO 9001:2008 Certified Journal, Volume 3, Issue 12, December 2013)
[image:3.595.61.284.144.264.2]109
Figure 2: Factors that are likely to correspond to the discontinuities in image brightness [2].
Various edge detection methods available in the literature are: The Marr-Hildreth edge detector, The Canny edge detector, The Local Threshold and Boolean Function Based Edge Detection, Color Edge Detection Using Euclidean Distance and Vector Angle, Color Edge Detection using the Canny Operator, Depth Edge Detection using Multi-Flash Imaging and many more
The major steps involved using Ant Colony Optimization algorithm for edge detection is:
a)Initialize the positions of all ants as well as
pheromone matrix (same size as mage).
b)For the construction step, move the ant K for L
steps according to the probability transition matrix.
c)Update the pheromone matrix.
d)Make the binary decision to decide if there is an
edge or not based on final pheromone matrix.
Artificial Intelligence and its theory provide a scope for edge detection using various swarm computing techniques and most popularly the Ant Colony Optimization methods to detect the edge in an image. The general Ant Colony Optimization algorithm focuses
on the stochastic construction process that
probabilistically build the solution by iteratively adding the solution components to the existing partial solution generated using the heuristic information by updating the pheromone trail and finally ants working concurrently and independently via indirect communication that leads to a final solution.
Parameters defined in the procedure of ACO are as follows:
1) Pheromone matrix: This matrix contains the value of
pheromone intensity which attracts the ants to follow paths traversed by other ants. Pheromone matrix are updated twice, once after the movement of each ants and secondly after movement of all the ants.
2) Probabilistic transition matrix: The value of
probability for the ant's movement from one pixel to another is stored in probability transition matrix. The procedure of ACO can be summarized as follows:
a) Let total K ants are applied to find the optimal solution in a space χ that consists of M1× M2 nodes. b) Initialize the positions of total K ants, as well as the
pheromone matrix t(0).
c) For the construction-step index n = 1 : N and for the ant index k = 1: K. Consecutively, move the kth ant for L steps, from the node i to the node j according to a probabilistic transition matrix P(t)
[1]
Where, τij is the amount of virtual pheromone on edge
(i, j), ηij is the heuristic desirability of choosing feature j
when at feature i.
d) Update the pheromone matrix τ (n) after the movement
of each ant within each construction step.
[2]
Where, ρ is the pheromone evaporation coefficient, τij
is the thickness of pheromone and Q is the quality of a classification rule.
e) Make the solution decision according to the final
pheromone matrix τ (n), performed after the move of all K
ants within each construction step; and the pheromone matrix is updated as
[3]
Where, is the pheromone decay coefficient;
Ant Colony System performs two update operations [2] and [3] for updating the pheromone matrix, while the
Ant System only performs one operation (i.e. [3]). The
proposed ACO-based approach takes advantage of the improvements introduced in Ant Colony System (ACS).
IV. PROPOSED ADVANCED ANT BASED SWARM
COMPUTING (AASC)
International Journal of Emerging Technology and Advanced Engineering
Website: www.ijetae.com (ISSN 2250-2459, ISO 9001:2008 Certified Journal, Volume 3, Issue 12, December 2013)
110
Several modifications have been proposed on the existing ACO algorithms: Initialization process: assigned to pheromone matrix, weights assigned [36] [24] to calculate the heuristic function ACS based rule for Construction process, modified decision process based on selection of threshold value calculated using Otsu‟s method [31] and finally using the calculated threshold, pheromone matrix is used to classify each pixel either as an edge or a non-edge.An M × N 2-D image can be represented as 2-D matrix with the image pixels as its elements. In the representation used, each pixel in the image represents both a node and an edge in the graph. A pixel represents a node because locations in the graph are associated with pixel locations: ants move from one pixel to another. At the same time, it also represents an edge because the heuristic information is determined from the local variation of the image‟s intensity values and hence, is associated with a pixel location in the image. The components of the pheromone and transition matrices are associated with pixels in the image. The algorithm consists of three main steps. The first is the initialization process. The second is the iterative construction-and-update process, where the goal is to construct the final pheromone matrix. The construction and-update process is performed several times, once per iteration. The final step is the decision process, where the edges are identified based on the final pheromone values.
4.1 Ant Based Initialization Process:
Each of the ants is assigned a random position in the image. The initial value of each element in the pheromone matrix is set to a constant, which is small but
non-zero. The heuristic information matrix is
constructed. In the initialization process, each of the K ants is assigned a random position in the M image. The initial value of each element in the pheromone matrix is set to a, which is small but non-zero. Also, the heuristic information matrix is constructed based on the local variation of the intensity values. The heuristic information is determined during initialization since it is dependent only on the pixel values of the image. The initial value of each component of pheromone matrix τ
(0) is set a fixed value τinit as 1/(M1M2).
Till date no standard method has been explained to initialize the pheromone matrix, so an initial value has been assigned for the pheromone matrix which will allow the ants to explore other pixels that may be considered as edge pixels.
4.2 Heuristic Function Calculation & Ant Based Construction Process:
Heuristic information which is used to determine the probability using which ants moves from one pixel to another.
In the proposed method we have used weights to for calculating the heuristic value. As the ant moves farther the weight is reduced. This gives addition information
about the neighborhood to calculate transition
probability.
In this step modification done is in formation of new clique and addition of two new kernel functions. In the construction process, selected ant will move on the image for L movement-steps & this process will be repeated in each construction step and till each ant moves on image. The selected ant moves from node (l, m) to its neighboring node (i, j) according to the transition probability that is defined as follows:
[4]
Where, is the pheromone value of the node (i, j),
Ω (l, m) is the neighborhood nodes of the node (l, m), ηij represents the heuristic information at the node (i, j). The fixed value α and β represent the influence of the pheromone matrix and the heuristic matrix, respectively.
There are two essential issues in the construction process. The first issue is the determination of the
heuristic information ηij in (5). In this paper, it is
proposed to be determined by the local statistics at the pixel position (i, j) as
[5]
Where Z =∑i=1:M1∑j=1:M2Vc (Ii,j), which is a
normalization factor, Ii,j is the intensity value of the pixel
at the position (i, j) of the image I, the function Vc (Ii,j)
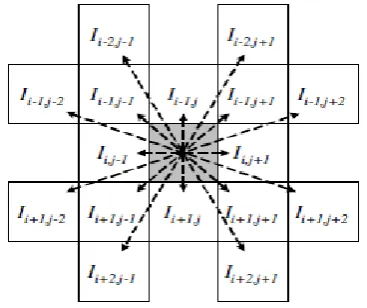
is a function of a local group of pixels c (called the clique), and its value depends on the variation of image‟s intensity values on the clique c (as shown in figure 3).
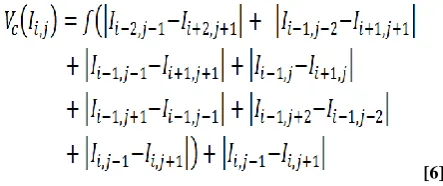
More specifically, for the pixel Ii,j under
consideration, the function Vc(Ii,j) is
[6]
[image:4.595.322.544.608.701.2]International Journal of Emerging Technology and Advanced Engineering
Website: www.ijetae.com (ISSN 2250-2459, ISO 9001:2008 Certified Journal, Volume 3, Issue 12, December 2013)
111
[7]
[8]
[9]
[10]
The parameter λ in each of above functions [7]-[10] adjusts the functions‟ respective shapes.
The second issue is to determine the permissible range
of the ant‟s movement (i.e., Ω(l, m) in [4]) at the position
(l, m). In this paper, it is proposed to be either the
4-connectivity neighborhood or the 8-connectivity
[image:5.595.56.275.137.257.2]neighborhood, both of which are demonstrated in Figure 4.
Figure 3: A local configuration at the pixel position Ii,j for
computing the variation Vc(Ii,j) defined in [6]. The pixel Ii,j is
marked as gray square.
Figure 4: Various neighborhoods (marked as gray regions) of the
pixel Ii,j : (a) 4-connectivity neighborhood; and (b) 8-connectivity
neighborhood.
4.3 Ant Based Decision Process:
Finally, a modified decision process and the modification is in the selection of new threshold. Here pheromone matrix is used to classify each pixel either as an edge or a non-edge. The decision is made by applying a threshold T on the final pheromone. The threshold T is computed based on Otsu technique [31] as specified earlier.
The initial threshold T (0) is selected as the mean value
of the pheromone matrix. The entries of the pheromone matrix are classified in two parts as:
(a) Those entries of pheromone matrix whose value is
less than T (0)
(b) Those entries of pheromone matrix whose value is
larger than T (0)
Then the new threshold is calculated by taking the square of two mean values of each of the two categories and then taking their average. The complete process is repeated again and again until the threshold value becomes constant (in terms of user defined tolerance).
V. SIMULATION RESULTS
Experiments were conducted using several test images. The proposed AASC based edge detection method was implemented using Matlab. The program is run on a PC with an AMD E-450 APU with Random ™ HD graphics 1.65 GHz CPU and 2 GB RAM.
[image:5.595.79.263.363.517.2]Parameters, its significance, values for each parameter used for experiments are summarized in following table:
Table 1
Parameters used in Experiment
Parameter Significance
τinit Initial pheromone value
N No. of iterations L No. of construction steps K No. of ants
α Influence of pheromone β Influence of heuristic value
[image:5.595.335.530.504.781.2]Pheromone decay coefficient ρ Pheromone evaporation coefficient
Table 2
Parameters value used in Experiment
Parameter Value
τinit 1/(M1M2)
N 1-20
L 40
K 256
α 1
β 1
[image:5.595.83.267.573.689.2]International Journal of Emerging Technology and Advanced Engineering
Website: www.ijetae.com (ISSN 2250-2459, ISO 9001:2008 Certified Journal, Volume 3, Issue 12, December 2013)
112
In the experimental / Simulation results, five images : Designer door, Bedroom, Three kids, Snowy mountains, bathroom images has been taken into consideration.In the existing literature, Traditional ACO has been compared with various edge detector methods such as Roberts‟s method, Sobel method, Prewitt method, LoG method, canny method and many more and ACO has proved to be generating better performance compared to the existing methods [38].
In the simulation results given below, we have compared the traditional ACO method with our proposed Advanced Ant based Swarm Computing (AASC) method in terms of processing / execution time (Time), Figure Of Merit (FOM), Kappa value.
Image 1: Designer Door Obtained Threshold: 149.03
Parameter Traditional ACO Proposed AASC
[image:6.595.319.548.156.680.2] [image:6.595.55.283.324.578.2]Time required 2.04 seconds 1.95 seconds Figure of Merit 0.80996 0.89609
Kappa value 18.16925 19.04703
Image 2: Bedroom
Obtained Threshold: 118.3
Parameter Traditional ACO Proposed AASC
Time required 3.06 seconds 2.77 seconds Figure of Merit 0.91475 0.92878
Kappa value 19.22606 19.35825
Image 3: Three kids
Obtained Threshold: 123.87
Parameter Traditional ACO Proposed AASC
Time required 3.36 seconds 2.86 seconds Figure of Merit 0.79138 0.92613
International Journal of Emerging Technology and Advanced Engineering
Website: www.ijetae.com (ISSN 2250-2459, ISO 9001:2008 Certified Journal, Volume 3, Issue 12, December 2013)
113
Image 4: Snowy Mountains Obtained Threshold: 164.35
Parameter Traditional ACO Proposed AASC
[image:7.595.54.281.157.432.2] [image:7.595.340.532.158.647.2]Time required 3.13 seconds 2.15 seconds Figure of Merit 0.80461 0.89269
Kappa value 18.11175 19.01388
Image 4: Bathroom
Obtained Threshold: 170.06
Parameter Traditional ACO Proposed AASC
Time required 2.49 seconds 2.37 seconds Figure of Merit 0.8009 0.89994
International Journal of Emerging Technology and Advanced Engineering
Website: www.ijetae.com (ISSN 2250-2459, ISO 9001:2008 Certified Journal, Volume 3, Issue 12, December 2013)
114
VI. CONCLUSION AND FURTHER RESEARCH DIRECTIONS
Edge detection as specified earlier is an important phase in image processing applications.. In this paper an advanced ACO based image edge detection technique has been proposed and the results highlight the quality performance of proposed technique called AASC when suitable parameters are provided to an image.
Based on the conclusions and experiments, it leads to following research directions:
a)The quality of edge detection is highly dependent
on lighting conditions, the presence of objects of similar intensities, density of edges in the scene, and noise. While each of these problems can be handled by adjusting certain values in the edge detector and changing the threshold value for what is considered an edge, no good method has been determined for automatically setting these values, so they must be manually changed by an operator each time the detector is run with a different set of data.
b)Effective way to calculate heuristic information.
c)Reduction of the computational time
d)Since different edge detectors work better under
different conditions, it would be ideal to have an algorithm that makes use of multiple edge detectors, applying each one when the scene conditions are most ideal for its method of detection.
Acknowledgements
We would like to express our gratitude towards the experts who has contributed with the different methods of image processing using ant based mechanism. We express our thanks to the IJETAE platform for giving such opportunity to the emerging researcher to contribute their work in best possible way.
REFERENCES
[1] Rebika Rai, Ratika Pradhan, M.K.Ghose, “Ant based Swarm Computing for Image Classification - A Brief Survey”, in IJCA Special Issue on Computational Intelligence and Information Security (CIIS) November15,2012 [ ISBN: 973-93-80870-58-7] [2] Rebika Rai, Ratika Pradhan, M.K.Ghose, “Ant based Swarm
Computing for edge detection of images- A Brief Survey”, International Journal of Emerging Technology and Advanced Engineering (IJETAE), ISSN 2250-2459, ISO 9001:2008 Certified Journal, Volume 3, Issue 4, April 2013
[3] Rebika Rai, Tejbanta Singh Chinghtam, M.K.Ghose, 2009, “Optimization of Autonomous Multi-Robot Path Planning & Navigation using Swarm Intelligence”, In National Conference on LEAN Manufacturing Implementations : The future of Process Industries (LEMAN „2009)”.
[4] Rebika Rai, Tejbanta Singh Chinghtam, "A hybrid framework for Robot path planning and Navigation using ACO & Dijkstra", IJCA Proceedings on International Symposium on Devices MEMS, Intelligent Systems & Communication (ISDMISC) (9):19-24, October 2011. Published by Foundation of Computer Science, New York, USA.
[5] Ling Chen, Bolun Chen and Yixin Chen, 2011, “Image Feature Selection Based on Ant Colony Optimization”, AI'11 Proceedings of the 24th international conference on Advances in Artificial Intelligence, pp. 580-589.
[6] Simranjeet Kaur, Prateek Agarwal, Rajbir Singh Rana,2011” Ant Colony Optimization: A Technique used for Image Processing, Dept. of CSE, Lovely Professional University, IJCST Vol. 2, Issue 2.
[7] Lintao Wen, Qian Yin, Ping Guo, 2009, “Ant Colony Optimization algorithm for feature selection and Classification of multispectral remote sensing image”, 2nd International congress on Image and Signal Processing, CISP‟09.
[8] Xiaoping Liu, Xia Li, Lin Liu, Jinqiang He and Bin Ai, 2008, “An Innovative method to classify Remote-Sensing Images using Ant colony Optimization”, IEEE transactions on geoscience and remote sensing, vol. 46, no. 12.
[9] T. Piatrik and E. Izquierdo, 2008, "An Application of Ant Colony Optimization to Image Clustering," in Proc. K-Space Jamboree Workshop.
[10] S.N. Omkar, Manoj Kumar M, Dheevatsa Mudigere, Dipti Muley, 2007, “Urban Satellite Image Classification using Biologically Inspired Techniques”, In: IEEE International Symposium on Industrial Electronics.
[11] H. Liu, F. Hussain, C. L. Tan, and M. Dash, 2002, “Discretization: An enabling technique,” Data Mining Knowl. Discovery, vol. 6, no. 4, pp. 393–423.
[12] R. Eberhart, Y. Shi, and J. Kennedy, 2001, Swarm Intelligence. San Francisco, CA: Morgan Kaufmann.
[13] M. Dorigo and L. M. Gambardella, 1997, “Ant colony system: A cooperative learning approach to the traveling salesman problem,” IEEE Trans. Evol. Comput. vol. 1, no. 1, pp. 53–66. [14] H. Gutowitz, “Complexity-seeking ants”, 1993, In Proc. of the
Third European Conference on Artificial Life.
[15] M. Dorigo, 1992, “Optimization, learning and natural algorithms,” Ph.D. dissertation, Dept. Electron., Politecnico di Milano, Milan, Italy.
[16] Y. Tyagi, T. A. Puntambekar, Preeti Sexena, Sanjay Tanwani, “ A Hybrid Approach to Edge Detection using Ant Colony Optimization and Fuzzy Logic”, International Journal of Hybrid Information Technology Vol. 5, No. 1, January, 2012
[17] Mohit Mehta, Munish Rattan, “An improved ACO based algorithm for image edge detection”, International Journal of Computing and Corporate Research, Volume 2 Issue 5, September 2012.
[18] Ehsan Nadernejad, Sara Sharifzadeh, Hamid Hassanpour,” Edge Detection Techniques: Evaluations and Comparisons”, Applied Mathematical Sciences, Vol. 2, 2008, no. 31, 1507 - 1520 [19] D.-S. Lu and C.-C. Chen, “Edge detection improvement by ant
colony optimization,” Pattern Recognition Letters, vol. 29, pp. 416–425, March 2008.
[20] H. Nezamabadi-Pour, S. Saryazdi, and E. Rashedi, “Edge detection using ant algorithms,” Soft Computing, vol. 10, pp. 623–628, May 2006.
[21] H. Zheng, A. Wong, and S. Nahavandi, “Hybrid ant colony algorithm for texture classification,” in Proc. IEEE Congress on Evolutionary Computation, Canberra, Australia, Dec. 2003, pp. 2648–2652.
[22] M. Randall and A. Lewis, “A parallel implementation of ant colony optimization,” Journal of Parallel and Distributed Computing, vol. 62, pp. 1421–1432, Sep. 2002.
International Journal of Emerging Technology and Advanced Engineering
Website: www.ijetae.com (ISSN 2250-2459, ISO 9001:2008 Certified Journal, Volume 3, Issue 12, December 2013)
115
[24] T. Stutzle and H. Holger H, “Max-Min ant system,” FutureGeneration Computer Systems, vol. 16, pp. 889–914, Jun. 2000. [25] M. Dorigo and L. M. Gambardella, 1997, “Ant colony system: A
cooperative learning approach to the traveling salesman problem,” IEEE Trans. Evol. Comput. vol. 1, no. 1, pp. 53–66. [26] H. Gutowitz, “Complexity-seeking ants”, 1993, In Proc. of the
Third European Conference on Artificial Life.
[27] Javad Rahebi, Hamid Reza Tajik, “Biomedical Image Edge Detection using an Ant Colony Optimization Based on Artificial Neural Networks”, International Journal of Engineering Science and Technology (IJEST).
[28] Jing Tian, Weiyu Yu, and Shengli Xie, “An Ant Colony Optimization Algorithm for Image Edge Detection”, IEEE Congress on Evolutionary Computation (CEC 2008).
[29] N. Otsu, “A threshold selection method from gray level histograms,” IEEE Trans. Syst., Man, Cybern. vol. 9, pp. 62–66, Jan. 1979.
[30] Y. Becerikli and H. Engin Demiray, Alternative Neural Network Based Edge Detection, Neural Information Processing, Vol. 10, Nos. 8-9, Sept. 2006.
[31] M. Egmont-Petersen, D. de Ridder, H. Handels, Image processing with neural networks – a review, Vol. 35, No. 10, pp. 2279-2301, 2002.
[32] J. Tian, W. Yu, and S. Xie, “An Ant Colony Optimization Algorithm For Image Edge Detection”, IEEE Congress on Evolutionary Computation,1-6, pp. 751-756, June. 2008. [33] N.Otsu, “A threshold selection method from gray level
histograms,” IEEE Trans.Syst., Man, Cybern. vol.9, pp.62–66, Jan.1979
[34] Peng Xiao, Jun Li, Jian-Ping LI3, Ant colony Optimization Algorithm for Image Extracting. IEEE 2010
[35] Javed Rahebi, Zahra Elmi, Ali Farzam Nia and Kamraan Shayan,” Digital image edge detection using an ant colony optimization based on genetic algorithm”, IEEE 2010.
[36] Puneet Rai,Maitreyee Dutta, Image Edge Detection using Modified Ant Colony Optimization Algorithm based on Weighted Heuristics, International Journal of Computer Applications (0975 – 8887),Volume 68– No.15, April 2013. [37] Mohit Mehta, Munish Rattan, “An Improved ACO based
![Figure 1(d): Shortest path choosen by maximum ants based on pheromone deposits [3][4]](https://thumb-us.123doks.com/thumbv2/123dok_us/8721376.884286/2.595.319.548.133.383/figure-shortest-path-choosen-maximum-based-pheromone-deposits.webp)
![Figure 2: Factors that are likely to correspond to the discontinuities in image brightness [2]](https://thumb-us.123doks.com/thumbv2/123dok_us/8721376.884286/3.595.61.284.144.264/figure-factors-likely-correspond-discontinuities-image-brightness.webp)