2594
ORTHOGONAL WAVELET FUNCTION FOR COMPRESSION
SATELLITE IMAGERY OF PEAT FOREST FIRES
1NOVERA KRISTIANTI, 2ALBERTUS JOKO SANTOSO, 3PRANOWO
1,2,3Magister Teknik Informatika, Universitas Atma Jaya Yogyakarta, Yogyakarta, Indonesia
E-mail: 1[email protected], 2[email protected], 3[email protected]
ABSTRACT
Background: In the process of digital image data representation, constrained the number of data volumes are required. One of the main sources of information in data processing of imagery is satellite imagery. Some applications of remote sensing technology requires a good quality image but in small size. Purpose: This study focuses on image compression is done to reduce the size of the image needs. However, the information contained in the image retained its existence. Method: In this study, using 17 orthogonal wavelet function used to reduce data satellite images of peat forest fires. Then, 17 of these orthogonal wavelet functions are compared with the parameter measurement i.e. PSNR (Peak Signal to Noise Ratio) and compression ratio. The benchmark of image compression is seen from the largest PSNR and large compression ratio Finding: Based on orthogonal wavelet function testing, then the Haar (daubechies 1) wavelet function results obtained has the highest PSNR for all level of decomposition on all test image i.e 50.783 dB for test image 1, 50.954 dB for image 2 and 49.855 dB for image 3. For the highest compression ratio on all test image is a function of wavelet symlet 8 i.e 97.00% for image 1, 97.05% for image 2 and 96.90% for image 3. Originality value: Satellite imagery that has been reduced would contribute to facilitating the processing of data as well as data input for the creation of digital image processing for system detection peat forest fires hotspots.
Keywords: Image Compression, Satellite Imagery, Peat Forest, Orthogonal Wavelet function, Information
System
1. INTRODUCTION
Each day, a remote sensor produces large amounts of data including satellite images. This large volume of data causing inefficient in storage and processing using computers. In order to reduce data storage memory the data should be compressed [1] [2]. In image compression, it is not just focus on reducing the size but also focus on reducing the size of the image without removing the quality as well as the information of the image itself. [3]
The purpose of the image compression is to lower redundancies in the image data. Image compression is doing removals of one or more of the three fundamental data that has redundancies on it [3]. Compression is necessary in order to make an image more manageable with smaller size [4].
Compression of satellite imagery is used to reduce the use of memory needed to keep the image. In general case, satellite images often require large amounts of memory used [5]. Image
and data compression of remote sensing could use wavelet. The use of wavelet in image compression due to his ability to analyze the data image [6].
The use of wavelet image compression is considered effective and decrease memory usage, as well as fasten devices ability. The application of wavelet could also be used to improve the resolution of satellite imagery that has a low resolution to obtain satellite images without losing image information. Wavelet can improve the quality of an image as well as maintaining the information on the image as a texture and the edges line. [1] [7] [8].
2595 The compression process of large satellite imagery, needs to be done as the first step to making a prediction system. One method for doing compression is by using the wavelet. Utilization of wavelet can accelerate the process of transmission so that the process of peat forest fire prediction can be done more quickly. Prediction of peat forest fires is the first step to reduce forest fires and reducing the disaster victims.
1.1 Information Hiding
The determination of the right wavelet to do compressed of detection place satellite imagery before and during natural disasters can be used to prevent the potential dangers of natural disasters [9].
A forest fire is defined as a disaster caused by a natural forest area that is destroyed by fire. The cause of these fires includes the following factors; human carelessness, extremely hot weather and other factors [10].
The utilization of satellite imagery can be used as data advice in the design of an early detection system of fires on peat forests which is one of peat forest fire preventive measures.
1.2 Purpose
The purpose of this research is conducting a comparison process in the orthogonal wavelet compression of peat forest fires satellite image using parameters measure the PSNR (Peak Signal to Noise Ratio) and compression ratio. The type of wavelet used is orthogonal wavelet type 17 i.e. Daubechies Family ( db 1 to db 5), Coiflets Family ( coiflet 1 to coiflet 5 ), and the family of Symlets ( symlet 2 to symlet 8).
2. RELATED LITERATURE
Wavelet is a mathematical function that performs Division of data into several components with different frequencies, then each component will be studied with a resolution that is suitable for any size [11]. Wavelet is divided into two types namely orthogonal and biorthogonal [12].
Orthogonal Wavelet is a wavelet that is associated with the wavelet transform are orthogonal i.e. have the same analysis and synthesis. Orthogonal Wavelet is composed of 17 types of daubechies family (db1 to db 5), family coiflet (coiflet 1 to coiflet 5) as well as the family of symlet (symlet 2 to symlet 8).
Daubechies family included in orthogonal wavelet discrete wavelet transform that defines. In this, there is a kind of wavelet scale function (called the father wavelet) which produces analysis of orthogonal multiresolution [13]. Coiflet is a discrete wavelet family are approaching symmetrical. The second function scale (low pass filter) and the wavelet function (high-pass filter) must be in the normalization in advance [14]. The family symlet is a modified version of the daubechies wavelet with increased symmetry [15].
Some previous studiesis alreadyusing wavelet for image compression. As in research [16], that use Haar wavelet image compression to do imagery compression. Research results showed the effectiveness of the use of wavelet in reducing the size of the image without removing too much resolution. Furthermore, research [17] is about image compression using Haar wavelet and wavelet Daubechies. This study using the measuring parameters the Mean Square Error (MSE) and others on a system which implements the compression of images. The purpose of the study is as a reference for application development using the right wavelet image compression.
In research conducted by [18], is researching the influence of wavelet for compression ratio and PSNR to find the optimal wavelet compression ratio and high PSNR. This study using 8-bit gray scale test image with size 512 x 512. With the results of the study found that wavelet which has the highest compression ratio in each family is Haar, Coiflet 1 and Symlet 2. While the highest PSNR wavelet features in each family is Haar, Coiflet 3 and Symlet5. For a wavelet have compression ratio PSNR values and optimal for each family is Haar, Coiflet 3 and Symlet 5.
The data processing has now turned into computerization. Thus the data that continues to increase in certain period affect the data storage that also getting bigger. Research conducted by this [11], trying to figure out the effect of decomposition level of wavelet to PSNR. Image test used is the 24-bit color image with 512 x 512 sizes. It is found that the effect of decomposition rate on PSNR is the greater level of decomposition, the smaller the PSNR.
2596 MSE and compression ratio. Utilization of wavelet conducted by [20] is for conditional random fields simulation. Wavelet compression used for the scale of the map domain spatial simulation. The goal of wavelet approach in this study is to acquire secondary data available but at different scales, which are used for the simulation of the main variables.
Furthermore, [21], using wavelet for extraction of roads from satellite imagery. The discrete wavelet transform is used as an approximation to the decomposition of the image to cut objects that are not needed on an image. Utilization of wavelet is also used by [22], in this research wavelet used for compression and satellite image watermark. DWT is used because it has features that support the progressive image transmission.
Furthermore, in a study conducted by [23] using a DWT as compression of remote sensing image with high spatial resolution. This approach was proposed to improve performance as well as reduce performs the computing. Wavelet decomposition also used this way in understanding topographic features with the research on Mount Merapi and Merbabu [24]. Analysis by wavelet decomposition is rated well in doing an analysis of topography using a computer because it is successfully separating the structure element from the named topography
Next research conducted by [25], about the use of 31 wavelet to compress satellite imagery. In the study comparing the functions of wavelet by looking at its effect on PSNR, compression ratio, and bits per pixel (bpp) and the influence of decomposition level of PSNR and compression ratio. In the study conducted by [20] is the comparison of algorithms that resulted in the application of discrete wavelet transform (DWT) in the optimal scale of decomposition of the test image of the mining site has the same good realization but with a shorter computation time.
Study to find the proper wavelet compression in satellite images of the tornado and hurricane disaster has been made by [26] . The result of the test image is a comparison using the compression ratio to get the correct wavelet image compression, can save memory, time of access, the processing time and delivery time
3. METHOD
This study focuses on testing particular 17 orthogonal wavelet function i.e. Daubechies Family ( db1 to db 5), Coiflets Family (coiflet 1 to 5), and the family of Symlets (symlet 2 to 8).
In order to do comparisons of wavelet function to find the correct wavelet to compress the peat forest fires satellite imagery.
Image data input in the form of image colors in size 512 x 512. Satellite imagery obtained from MODIS Terra satellite. Stages of the process of compression of peat forest fire satellite image by using orthogonal wavelet can be seen in the following figure
The image compression result using orthogonal wavelet compared using PNSR and compression Ratio to obtain a correct wavelet conclusion in doing satellite imagery compression of peat forrest fires.Business process for this study can be seen at figure 1.
2597 3.1 Wavelets Functions
Orthogonal wavelet on analysis, has the number of convolutions for each scale proportional to the wavelet that is the basis on the scale [27].
Wavelet is a wavelet function that comes from the base of the ψ (x) is called the mother wavelet. The two main underlying wavelet operations are translation and dilation.
1. Translation for example ψ(x-1), ψ(x-2), ψ(x-b)
2. Dilation for example ψ(2x), ψ(4x), and ψ(2jx). [28].
Combination from translation and dilation produce the formula of wavelet that expressed in equations [29] :
ψ , b x | |ψ | | (1)
Where,
,b ϵ R; ≠ 0 (R = Real-valued),
= dilation parameter = translation parameter
3.2 Orthogonal wavelet function for compression satellite imagery of peat forest fires
[image:4.612.76.514.95.691.2]The steps of compression satellite imagery can be seen at figure 2 :
Figure 2: The process of compression satellite imagery
Algorithm :
1. Read the original satellite imagery
2. Applying the wavelet transform (orthogonal wavelet).
3. Quantize the coefficient to reduce the number of bits required for image compression.
4. Generate the image that has been compressed
4. SIMULATION RESULT
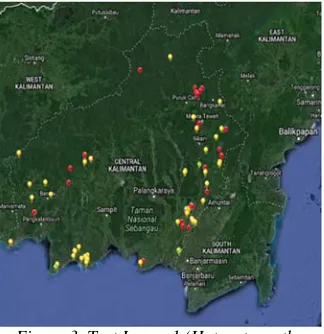
[image:4.612.338.500.300.467.2]This research uses the color image as the input in 512 x 512 sizes. Tested image retrieved from MODIS Terra satellite image on peat forest fires in Central Kalimantan. The image used is as follows at figure 3, figure 4, and figure 5 .
Figure 3. Test Image 1 (Hotspots on the 22nd until September 23, 2014) Source:
http://modis-catalog.lapan.go.id
Figure 4. Test Image 2 (Hotspots on the 23rd until September 24, 2014) Source :
http://modis-catalog.lapan.go.id
Original Satellite imagery
Compression using Daubechies family
Compression using
Coiflet family Compression using Symlet family
Compression Satellite imagery
2598
Figure 5. Test Image 3 (Hotspots on the 24th until September 25, 2014) Source:
http://modis-catalog.lapan.go.id
This study doing a test image compression using some orthogonal wavelet function (17 orthogonal wavelet functions). Then, the result of this peat forest fires satellite imagery compression will be compared using parameters measure the PSNR (Peak Signal to Noise Ratio) and compression ratio.
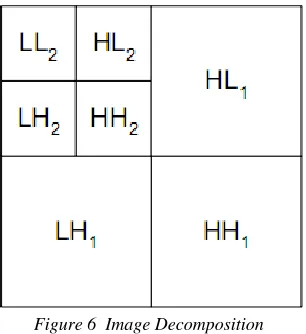
Figure 6 Image Decomposition Source : Albertus Joko Santoso et al [11]
[image:5.612.98.325.68.278.2]In Figure 6 showing an image of the decomposition process that divides the image into 4 sub bands, i.e. HH, HL, LH, and LL on the decomposition process of level 1. Then the process is repeated in accordance with the specified level.
Figure 7 Decomposition Level 1
In Figure 7 displays the simulation results from the test image 3 compression using Haar wavelet with 3 levels of decomposition of 1.
Figure 8 Decomposition Level 2
[image:5.612.315.521.350.535.2] [image:5.612.120.273.401.568.2]2599
Figure 9. Decomposition Level 3
[image:6.612.92.296.342.522.2]In Figure 9 displays the simulated results of compression test image 3 using Haar (daubechies 1) wavelet decomposition with level 3.
Figure 10 Reconstruct Image
In Figure10 displays the simulated results of reconstruct image decomposition level 2 using Haar wavelet
5. RESULT AND CONCLUSION
5.1 Peak Signal to Noise Ratio (PSNR)
PSNR is a measurement parameter that is often used to measure the quality of image reconstruction, which is then compared to the original image. The results of the qualitative measure of PSNR form based on the mean-square-error in image reconstruction [30].
PSNR showing a comparison of several methods for finding a suitable method to solve problems as well as according to your needs [31]. If
the PSNR of having more results it will produce quality imagery is rated better [26].
The formula for measuring the PSNR is as follows:
PSNR = 20xlog10 √ (3)
Where,
MSE = , , (4)
Where,
PSNR = Peak Signal to Noise Ratio
MSE = Mean Square Error
M = lines of the input image N = columns of the input image
I(x,y) = original image
I’(x,y) = reconstruct image
[image:6.612.317.519.418.712.2]
In this study, PSNR is used to compare some of the functions of the orthogonal wavelet (17 wavelet orthogonal function ) in compression of peat forest fires satellite imagery. The filter coefficients are longer than the smaller value of PSNR.
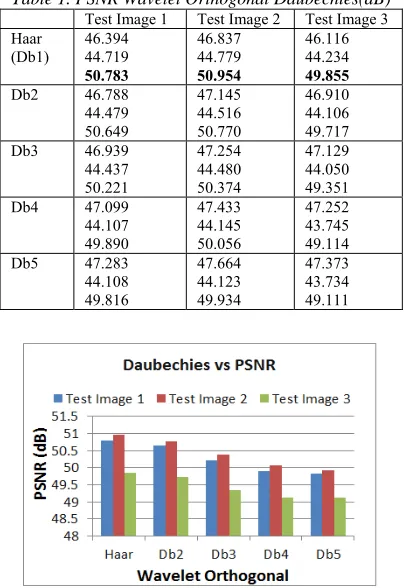
Table 1. PSNR Wavelet Orthogonal Daubechies(dB)
Test Image 1 Test Image 2 Test Image 3 Haar
(Db1)
46.394 44.719 50.783
46.837 44.779 50.954
46.116 44.234 49.855
Db2 46.788
44.479 50.649
47.145 44.516 50.770
46.910 44.106 49.717
Db3 46.939
44.437 50.221
47.254 44.480 50.374
47.129 44.050 49.351
Db4 47.099
44.107 49.890
47.433 44.145 50.056
47.252 43.745 49.114
Db5 47.283
44.108 49.816
47.664 44.123 49.934
47.373 43.734 49.111
2600 In table 1 and figure 11 could be seen the results of PSNR for the test image 1, image 2, and image 3 on wavelet orthogonal Daubechies family with decomposition levels 1, 2 and 3 are in Haar wavelet, and which has the lowest PSNR is the Daubechies wavelet of 5.
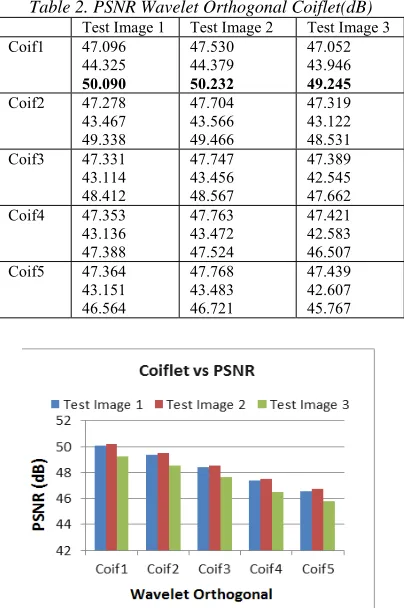
Table 2. PSNR Wavelet Orthogonal Coiflet(dB)
Test Image 1 Test Image 2 Test Image 3
Coif1 47.096
44.325 50.090 47.530 44.379 50.232 47.052 43.946 49.245
Coif2 47.278
43.467 49.338 47.704 43.566 49.466 47.319 43.122 48.531
Coif3 47.331
43.114 48.412 47.747 43.456 48.567 47.389 42.545 47.662
Coif4 47.353
43.136 47.388 47.763 43.472 47.524 47.421 42.583 46.507
Coif5 47.364
43.151 46.564 47.768 43.483 46.721 47.439 42.607 45.767
Figure 12.Coiflet wavelet influence towards PSNR
In table 2 and figure 12 could be seen the results for PSNR testing image 1, image 2, and image 3 on wavelet orthogonal decomposition Coiflet family with level 1, 2 and 3 is on the Coiftlet1 wavelet , and which has the lowest PSNR is Coif wavelet 2 for the test image 1 and image 2 test, and the test image wavelet coif 4 for 1 and 3 test image.
Table 3. PSNR Wavelet Orthogonal Symlet(dB)
Test Image 1 Test Image 2 Test Image 3
Sym2 46.788
44.479 50.649 47.145 44.516 50.770 46.910 44.106 49.717
Sym3 46.939
44.437 50.221 47.254 44.480 50.374 47.129 44.050 49.351
Sym4 47.211
43.783 49.605 47.642 43.855 49.755 47.281 43.421 48.779
Sym5 47.018
43.665 49.440 47.416 43.748 49.630 47.256 43.302 48.602
Sym6 47.264
43.300 49.065 47.688 43.365 49.211 47.357 42.902 48.263
Sym7 47.021
43.316 48.702 47.372 43.407 48.865 47.381 42.932 47.952
Sym8 47.290
43.133 48.237 47.707 43.469 48.395 47.391 42.573 47.410
Figure 13. Symlet wavelet influence towards PSNR
In table 3 and figure 13 can be seen the results of PSNR testing image 1, image 2, and image 3 on wavelet orthogonal decomposition level symlet with families 1, 2 and 3 are on wavelet
symlet 2 and that have a low PSNR wavelet is symlet 6.
5.2 Compression Ratio
[image:7.612.94.296.173.477.2]2601 The formula for measuring compression ratio is:
[image:8.612.93.296.155.460.2]CR = x 100% (5)
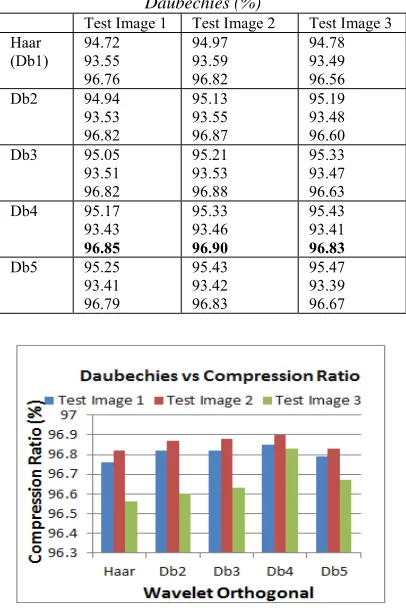
Table 4. Compression Ratio Wavelet Orthogonal Daubechies (%)
Test Image 1 Test Image 2 Test Image 3 Haar
(Db1) 94.72 93.55 96.76 94.97 93.59 96.82 94.78 93.49 96.56
Db2 94.94
93.53 96.82 95.13 93.55 96.87 95.19 93.48 96.60
Db3 95.05
93.51 96.82 95.21 93.53 96.88 95.33 93.47 96.63
Db4 95.17
93.43 96.85 95.33 93.46 96.90 95.43 93.41 96.83
Db5 95.25
93.41 96.79 95.43 93.42 96.83 95.47 93.39 96.67
Figure 14 .Daubechies wavelet influence towards compression ratio
Seen from table 4 and figure 14, the highest the compression ratio (CR) for the orthogonal Daubechies wavelet family is the Daubechies 4 for all the test images. While the Haar has the lowest compression ratio for all the test images.
Table 5. Compression Ratio Wavelet Orthogonal Coiflet(%)
Test Image 1 Test Image 2 Test Image 3
Coif1 95.13
93.51 96.87 95.36 93.54 96.93 95.30 93.47 96.69
Coif2 95.30
93.34 96.94 95.49 93.35 96.99 95.50 93.32 96.86
Coif3 95.38
93.26 96.93 95.57 93.50 96.98 95.61 93.18 96.83
Coif4 95.40
93.57 96.91 95.62 93.80 96.96 95.69 93.62 96.83
Coif5 95.36
93.63 96.83 95.64 93.91 96.89 95.75 93.84 96.79
Figure 15.Coiflet wavelet influence towards compression ratio
Seen from table 5 and figure 15, the compression ratio (CR), the highest for the orthogonal wavelet families coiflet is Coiflet 2 for all the test images. While Coiflet 5 has the lowest compression ratio for all the test images.
Table 6 Result of Compression Ratio Wavelet Orthogonal Symlet(%)
Test Image 1 Test Image 2 Test Image 3
Sym2 94.94
93.53 96.82 95.13 93.55 96.87 95.19 93.48 96.60
Sym3 95.05
93.51 96.82 95.21 93.53 96.88 95.33 93.47 96.63
Sym4 95.26
93.46 96.97 95.46 93.48 97.03 95.48 93.44 96.83
Sym5 95.20
93.43 96.98 95.39 93.45 97.05 95.50 93.41 96.84
Sym6 95.34
93.35 96.98 95.54 93.38 97.03 95.57 93.34 96.86
Sym7 95.23
93.31 96.96 95.38 93.36 97.00 95.59 93.31 96.84
Sym8 95.39
[image:8.612.302.525.353.718.2]93.46 97.00 95.58 93.68 97.05 95.64 93.36 96.90
2602 Seen from Table 6 and figure 16, the compression ratio (CR), the highest for wavelet orthogonal family of symlet is symlet 8 for all the test images. While symlet 2 has the lowest compression ratio for all the test images.
5.3 Comparison with previous work
The difference research of previous literature among others on the use wavelet devoted to 17 types of orthogonal wavelet i.e Daubechies Family ( db 1 to db 5), Coiflets Family ( coiflet 1 to coiflet 5 ), and the family of Symlets ( symlet 2 to symlet 8).
Then, in the previous research conducted as at [18] [11] is the use of the general image in the grayscale image or color image to the process of compression using wavelet.
This research uses specifically is a satellite image of peat forest fires. As well as research is also devoted to the process of compression of peat forest fire satellite imagery. This is done so that the results of this research can be used in particular in the areas of peat forest fires satellite imagery
5.4 Conclusion and Discussion
.Based on the research on the image of peat forest fires test results it is found that Haar wavelet has the highest PSNR for all test images up to testing at the level of decomposition three.
For each family of orthogonal wavelet highest PSNR are Haar/daubechies 1 (Daubechies Family) i.e 50.783 dB for test image 1, 50.954 dB for image 2 and 49.855 dB for image 3, Coiflet 1 (Coiflet Family) i.e 50.090 dB for image 1, 50.232 dB for image 2, 49.245 dB for image 3 and Symlet 2 (family Symlet) i.e 50.649 dB for image 1, 50.770 dB for image 2, 49.717 dB for image 2.
And for the highest compression ratios on all test image is Symlet 8. For each family of orthogonal wavelet compression ratio is highest Daubechies4 (Daubechies Family) i.e 96.85 % for image 1, 96.90 % for image 2 and 96.83% for image 3, Coiflet 2 (Coiflet Family) 96.94% for image 1, 96.99% for image 2 and 96.86% for image 3 and Symlet 8 (family Symlet) i.e 97.00% for image 1, 97.05% for image 2 and 96.90% for image 3.
PSNR is the benchmark of the similarity between the original image to the image
reconstruction. The benchmark of image compression is seen from the largest PSNR and large compression ratio. So it is concluded that the right orthogonal wavelet to compress satellite images of peat forest fires when using the PSNR parameter is wavelet haar because it obtains the highest results for all test images so it is judged to have good compression image quality. And from the compression ratio parameter then symlet 8 gets the highest result for all test images.
ACKNOWLEDGMENT
We would like to thank Universitas Atma Jaya Yogyakarta, Indonesia for supporting this study.
REFERENCES :
[1] Ladan Ebadi and Helmi Z.M Shafri, "Compression of remote sensing data using second-generation wavelets: a review,"
Environ Earth Sci, pp. 1379-1387, 2014.
[2] Ebadi Ladan , Helmi Z. M. Shafri, Shattri B. Mansor, and Ravshan Ashurov, "A review of applying second-generation wavelets for noise removal from remote sensing data," Environ
Earth Sci , pp. 2679-2690, 2013.
[3] Kitty Arora and Manshi Shukla , "A
Comprehensive Review of Image
Compression Techniques ," International Journal of Computer Science and Information
Technologies, vol. 5, pp. 1169-1172, 2014.
[4] V. V. Sunil Kumar and M. Indra Sena Reddy, "Image Compression Techniques by using Wavelet Transform ," Journal of Information
Engineering and Applications, vol. 2, no. 5,
pp. 35-40, 2012.
[5] Khaled Sahnoun and Noureddine Benabadji , "Satellite Image Compression Algorithm Based On The FFT," The International Journal of Multimedia & Its Applications
(IJMA), vol. 6, February 2014.
[6] K Gopi and Dr. T. Rama Shri, "Medical Image Compression Using Wavelets ," IOSR Journal
of VLSI and Signal Processing, vol. 2, no. 4,
pp. 01-06, 2013.
[7] Akansha Garg, Sashi Vardhan Naidu, Hussein Yahia, and Darmendra Singh, "Wavelet Based Resolution Enhancement for Low Resolution Satellite Images," IEEE Morocco Section. 9th IEEE International Conference on Industrial
and Information Systems (ICIIS2014), 2014.
2603 Reconstruction Based on Discrete Shearlet Transform," Sensors & Transducers, vol. 181,
no. 10, pp. 127-133, October 2014.
[9] Albertus Joko Santoso, Findra Kartika Sari Dewi , and Thomas Adi Purnomo Sidhi , "Natural Disaster Detection Using Wavelet and Artificial Neural Network," in Science and
Information Conference , London, UK, 2015,
pp. 761-764.
[10] Amandeep Kaur, Rohit Sethi, and Kamalpreet Kaur, "Comparison of Forest Fire Detection Techiques Using WSNs," International Journal of Computer Science and Information
Technologies, vol. 5, pp. 3800-3802, 2014.
[11] Albertus Joko Santoso, Lukito Edi Nugroho, Gede Bayu Suparta, and Risanuri Hidayat, "Color Image Compression Using Orthogonal Wavelet Viewed From Decomposition Level and Peak Signal to Noise Ratio," International
Journal of Advanced Science and Technology ,
vol. 31, pp. 81-92, June 2011.
[12] Langis Gagnon, "Wavelet Filtering of Speckle Noise-Some Numerical Results," Proceedings
of the conference Vision Interface, pp.
336-343, 1999.
[13] Ingrid Daubechies, Ten lectures on wavelets.:
Society for industrial and applied mathematics, 1992.
[14] Dr.B Eswara Reddy and K Venkata Narayana, "A lossless image compression using traditional and lifting based wavelets," Signal
& Image Processing, vol. 3, no. 2, p. 213,
April 2012.
[15] S. Kumari and R. Vijay, "Effect of Symlet Filter Order on Denoising of Still Images ,"
Advanced Computing, vol. 3, no. 1, pp.
137-143, January 2012.
[16] Monika Rathee and Alka Vij, "Image compression Using Discrete Haar Wavelet Transforms ," International Journal of Engineering and Innovative Technology
(IJEIT), vol. 3, no. 12, pp. 47-51, June 2014.
[17] Dipalee Gupta and Siddhartha Choubey, "Discrete Wavelet Transform for Image Processing," International Journal of Emerging Technology and Advanced
Engineering, vol. 4, no. 3, pp. 598-602, March
2015.
[18] Albertus Joko Santoso, Dr. Lukito Edi Nugroho, Dr. Gede Bayu Suparta, and Dr. Risanuri Hidayat, "Compression Ratio and Peak Signal to Noise Ratio in Grayscale Image
Compression using Wavelet," International
Journal of Computer Science and Technology,
vol. 2, no. 2, pp. 7-11, June 2011.
[19] A. J. Rajeswari Joe and N. Rama, Ph.D, "Image Compression based on Scaling Functions and Wavelet Transformations,"
International Journal of Computer
Applications, vol. 88, pp. 5-8, February 2014.
[20] Snehamoy Chatterjee and Roussos Dimitrakopoulos, "Multi-scale stochastic simulation with a wavelet-based approach,"
Computers & Geosciences, vol. 45, pp.
177-189, 2012.
[21] Tamer M. Talal et al., "Extraction of Roads from High-Resolution Satellite Images with the Discrete Wavelet Transform," Sens
Imaging, pp. 29-55, 2013.
[22] M. Abolfathi and R. Amirfattahi, "Design and implementation of a reliable and authenticated satellite image communication," Telecommun Syst, vol. 49, no. 2, pp. 171-177, 2012.
[23] Libao Zhang and Bingchang Qiu, "Fast orientation prediction-based discrete wavelet transform for remote sensing image compression," Remote Sensing Letters, vol. 4,
pp. 1156-1165, 2013.
[24] Christopher Gomez, "Multi-scale topographic analysis of Merbabu and Merapi volcanoes using wavelet decomposition," Environ Earth Sci, vol. 67, no. 5, pp. 1423-1430, 2012.
[25] Albertus Joko Santoso, F. Soesianto, and B. Yudi Dwiandiyanto, "Satellite Image Compression Using Wavelet," in Second International Conference on Digital Image
Processing, 2010.
[26] Albertus Joko Santoso, Findra Kartika Sari Dewi, and Thomas Adi Purnomo Sidhi, "Compression of Satellite Imagery Sequences Using Wavelet for Detection of Natural Disaster," International Journal of Advanced
Science and Technology , vol. 62, pp. 55-64,
2014.
[27] Christopher Torrence and Gilbert P. Compo, "A practical guide to wavelet analysis,"
Bulletin of the American Meteorological
society, vol. 79, pp. 61-78, 1998.
[28] Gilbert Strang, "Wavelets and dilation equations: A brief introduction.," SIAM
review, vol. 31, no. 4, pp. 614-627, 1989.
2604 implementation," IEEE Transactions on Circuits and Systems II: Analog and Digital
Signal Processing, vol. 45, no. 2, pp. 217-226,
1998.
[30] Amr M. Kishk, Nagy W. Messiha, Nawal A El-Fishawy, Abd-Elrahman A. Alkafs, and Ahmed H. Madian, "Low Energy Lossless Image Compression Algorithm for Wireless Sensor Network (LE-LICA) ," Sensors &
Transducers, vol. 188, no. 5, pp. 102-106,
May 2015.
[31] Paras Jain and Vipin Tyagi, "A survey of edge-preserving image denoising methods,"
Information Systems Frontiers, pp. 159-170,
2016.
[32] A. M. Raid, W. M. Khedr, M. A. El-dosuky, and Wesam Ahmed, "Jpeg Image Compression Using Discrete Cosine Transform - A Survey,"
International Journal of Computer Science &
Engineering Survey (IJCSES) , vol. 5, pp.
39-47, April 2014.
[33] S. Abhishek, S. Veni, and K. A. Narayanankutty, "Splines in Compressed Sensing," International Journal on Advanced
Science Engineering Information Technology,
vol. 6, pp. 469 - 476, 2016.
[34] Navpreet Saroya and Prabhpreet Kaur, "Analysis of IMAGE COMPRESSION Algorithm Using DCT and DWT Transforms,"
International Journal of Advanced Research in
Computer Science and Software Engineering,
vol. 4, no. 2, pp. 897-900, February 2014. [35] Snehamoy Chatterjee, Hussein Mustapha, and
Roussos Dimitrakopoulos, "Fast wavelet-based stochastic simulation using training images,"