ORIGINAL RESEARCH ARTICLE
SURVEY AND PREVENTIVE MANAGEMENT OF MISSING DATA DUE TO UNANSWERED
*Vincent J. M. Kiki, Marie Odile ATTANASSO and Gino Roland Kiki
Ecole Nationale d’Economie Appliqu´ee et de Management, Universit´e d’Abomey-Calavi;
03 BP 1079 Cotonou, Republic of Benin
ARTICLE INFO ABSTRACT
An important challenge in statistical modeling involves determining an appropriate structural form for a model to be used in sampling. Various sampling methods have been developed by many researchers, namely the Time Location Sampling (TLS) method by Quaglia and Vivier, the Respondent Driven Sampling (RDS) method by Heckathorn, and the filter-survey method (MEF) by Kalton, etc. In this paper, we propose the Sampling By Use of Complicity (SBUC) model based on the principle of use of interviewers assisted by accomplice units. Thus, the SBUC model is developed for recruiting sample units using accomplice units. The SBUC model is applied to the hidden population of 2013 contraband fuel sellers in Benin, who smuggle the fuel from the federal republic of Nigeria. Thus, we predict the average rates of contraband fuel sellers who are aware of the dangerous nature of this activity and those willing to give up the trade.
Copyright © 2018,Vincent J. M. Kiki, et al. This is an open access article distributed under the Creative Commons Attribution License, which permits unrestricted use, distribution, and reproduction in any medium, provided the original work is properly cited.
INTRODUCTION
The purpose of statistics is, among other things, observing everything that characterizes human activity in order to obtain necessary information that will be processed and analyzed, the final goal being to help make good decisions whatever the area. To obtain useful figures, 5 we often need to interview populations through comprehensive statistical surveys or by sample survey, Chevry, G. (1962) and J. Genet et al (1974). Sampling models are therefore used for these investigations. But classic models for sampling difficult-to-reach populations do not allow the researcher to eliminate the big difficulty of reluctance and hostility from most of the hidden populations to respond to the statistical survey questionnaires. In this paper, we make a sit- uational analysis of classic models in order to identify those more or less suitable for sampling hidden populations, by highlighting the consequences of the absence of sampling frame. The hostility and reluctance of units of interest are important issues that need to be solved, because until now, no work focused on this type of generalized non-response problem has caught our at- tention. Thus, as solution, we hereby propose an original and innovative sampling model named ”SBUC Model” (Sampling By Use of Complicity).
*Corresponding author: Vincent J. M. Kiki
Ecole Nationale d’Economie Appliqu´ee et de Management, Universit´e d’Abomey-Calavi; 03 BP 1079 Cotonou, Republic of Benin
It is more or less inspired by the TLS, the RDS and the MEF, but based on an innovative concept, that of accomplice units. In this paper, the SBUC model is presented through its hypotheses, its principle and procedure, together with a practical application to contraband fuel sellers (CFS) in 2013 in Benin. Indeed, they represent a special case of hidden and reluctant population. Non-registered, they are hostile to any form of survey because of the illegal nature of their activity. The main elements of this paper are devoted to the problem of generalized refusals to respond in statistics (2), the presentation of the SBUC model (3), the application of the SBUC model to the hidden and reluctant population of contraband fuel sellers in Benin (4), and finally the main conclusions and prospects (5).
Problem of Generalized Refusals to Respond in Statistics
Non-responses are the cause of collective or partial reluctance of some people to respond to the survey questionnaire. We show in a relevant literature review that reluctant populations are a special case of hidden populations that we cannot reach with even the most recent classic sampling models, to wit:
• Empirical methods (quota method, itinerary method, snowball method, etc.)
• Probabilistic methods (cluster sampling method, multi-stage sampling method, etc.)
ISSN: 2230-9926
International Journal of Development Research
Vol. 08, Issue, 08, pp. 22224-22234, August, 2018
Article History: Received 14th May, 2018
Received in revised form 21st June, 2018
Accepted 07th July, 2018
Published online 30th August, 2018
Key Words:
Sampling, Hidden populations, Reluctance to surveys.
Citation: Vincent J. M. Kiki, Marie Odile ATTANASSO and Gino Roland Kiki. 2018. “Survey and preventive management of missing data due to unanswered”, International Journal of Development Research, 8, (08), 22224-22234.
TLS, RDS, filter survey
Simple Random Sampling Method: Without the numbered
list of the individuals of the population, it would be extremely difficult or even impossible to consider a simple random sampling or a stratified sampling. In fact, the N units of interest (constituting the parent population) are numbered in the ”sample frame”. The numbers were drawn by lot until we have obtained the desired number n of individuals. The individuals and the numbers they bear on the list are recorded in the order of draw with their addresses, Chevry, G. (1962), Cochran (1977) and Thompson (1992). In practice, the numbers are drawn by lot either by using a random number table or by the ”ballot box strategy”. It appears obvious that for this method, it is necessary to have the numbered list of the N individuals of the parent population, that is, an exhaustive sampling frame.
Stratified Sampling Method: In a stratified random sampling,
the units of interest are first grouped into homogeneous categories or strata based on certain characteristics that are known in advance. Then, a fixed percentage of individuals is drawn by lot from each stratum. The draws in a stratum are based on the exhaustive numbered list of individuals in this stratum. It is thanks to the sampling frame that this can be done. It is therefore necessary to have a document providing in details the exhaustive list of the whole population as well as each of the lists of units of interest constituting the different strata. Only under such circumstances is it possible to randomly draw the k subsamples respectively representative of the k strata of the whole parent population. Let’s consider for example the pulation of contraband fuel sellers in Benin during a specified period. Suppose we wanted to carry out a sample survey on this population. Since they are registered nowhere, we cannot extract a random sample using a simple random sampling or a stratified sampling method. We do not have any information or document providing their list. It is therefore necessary to find a way to identify them as a whole; otherwise extracting a sample is not possible through these two probabilistic methods. Thus, in the absence of sampling frame, it is not possible to make use of either the simple random sampling or the stratified random sampling. Both methods and other similar methods are therefore not suitable for the statistical survey of difficult-to-reach populations, whether they are reluctant or not.
Cluster Sampling and Multistage Sampling Methods:
Because having direct access to the individuals is not the major concern in a cluster survey, it is not strictly necessary to have the list of these individuals. Suffice it to have the necessary information about the clusters represented by the groups in which these individuals are distributed. The impact of not having a sampling frame is therefore much smaller in this case. But what is certain is that the cluster sampling procedure offers no possibility to get a unit of interest that refuses to respond to the survey, to cooperate. As for the multistage sampling, since it consists in selecting the sample units by cascades, we do not necessarily need an exhaustive sampling frame providing the list of the units of interest. For example, with the cluster survey, a sample of SONACOP fuel station managers can be constituted as follows: At the first stage, we select a sample of departments; at the second stage, we focus on selecting a sample of municipalities within the departments drawn by lot. So far, we do not necessarily need an exhaustive sampling frame providing the list of the managers. At the third stage, we can draw by lot within the selected municipalities, the
SONACOP station managers that will compose the sample. But if the managers are reluctant and refuse to respond to the survey questionnaire, the cluster sampling model provides no specific solution to this type of problem. In total, for both conventional sampling models, the sampling frame will obviously facili- tate the selection of the sample and will allow to best control the representativeness. But they can still be used in the absence of a sampling frame as long as the individuals are not hostile to surveys and remain available once identified through the clusters or after the last stage. Suf- fice it to have a good knowledge of the clusters or the structure of the stages. However, they provide no solution to the surveyed individual’s reluctance to respond to the statistical survey questionnaire.
Quota Method, Itinerary Method and Snowball Method:
The quota method is based on the so-called control variables that are used to ensure the sample’s structural compliance with the whole parent population. The availability of a sampling frame would be, in the best case, useful for assessing such compliance because it is helpful to know a priori the structure of the population in regard to the control variables. We obtain quotas that must be respected in the structuring of the sample. This ensures that the sample has the same structure as the parent population in regard to the control variable. But the sampling frame is not strictly necessary: suffice it to have adequate information on the general structure 95 of the population of interest. Moreover, the quota method gives free rein to the interviewer to select himself along his path, but in compliance with the quotas that are set, the individuals to be interviewed. So we do not truly need the sampling frame here. So the sampling is conducted indirectly on the spot. This freedom lessens the indispensability of the sampling frame and thus limits the sensitivity of this empirical method to the lack of sampling frame. The itinerary method is nothing more than the quota method improved by the fact that the interviewer is imposed the places where he must stop to question the sample units. But these methods inevitably reach their limit when the reluctance of respondents is real. The snowball method is used to form a sample of sufficient size, but unfortunately ’inex- trapolable’, in a population of rare attributes which is difficult to identify on the spot, Marpsat, M. et Razafindratsima, N. (2010). We identify some individuals whom we asked the subsidiary question: do you know of other individuals conducting the same activity as you? If yes, give their names and addresses. On this basis, we complement the list until we reach the desired sample size while of course avoiding duplicates. So the survey is a respondent-driven one. It is therefore a method that does not necessarily require the availability of a sampling frame. Like other empirical models, it is ineffective in terms of the question of reluctance from the informant. Using the LAVALEE’s ’weight share’ idea, HECKATORN made the snowball method called RDS become probabilistic in 1997.
RDS Method: The RDS method or probabilistic snowball is
areas were investigated using the RDS, namely that of HIV prevalence in France studied by Jauffret-Roustide et al. (2008) and that of homosexuals by Polack et al. (2005), etc. But they failed to get reluctant individuals to talk because the RDS has no specificity that allows this. It’s the same with Johnston and Sabin who conducted in 2010 a study on HIV prevalence also using RDS.
TLS Method: The TLS method consists in identifying places
frequented at specific times by the units of interest where they will be interviewed. It was successfully used for sampling hidden populations such as homeless people by QUAGLIA and VIVIER (1995), Marpsat and Firdion (2000 and 2007), Ardilly and Le Blanc (2001). It has also been used by Deville and Maumy (2006) to sample tourists.
Filter Survey Method: The filter survey method consists in
creating a reference list that can be used instead of the unidentifiable parent population a priori for selecting the sample, Marpsat, M. et Razafind- ratsima, N. (2010). Since the goal is to identify and list the maximum number of units of interest to be surveyed, the filter survey method is not really sensitive to the phenomenon of reluctance from the respondents. It has the merit of providing a kind of non-exhaustive sampling frame from which the sample will be selected. Once the sample is selected, all that remains is to find other ways to administer the questionnaire by solving the problem of reluctance. In conclusion, the TLS and RDS methods, the Kalton’s filter survey, and the Lavalle’s weight share theory lead us to interesting results with regard to the statistical survey of hidden populations. However, these methods do not solve the problem of hostility and reluctance of the units of interest to survey questionnaires. Thus, there arises the problem of finding an approach that can take these aspects into account, which is solved by this paper through the SBUC model.
SBUC Model
Principles and Hypotheses: SBUC model is fundamentally
based on a new concept, that of ”accomplice units”. An accomplice unit is an individual that has a reciprocal trust relationship with the unit of interest to be surveyed. The SBUC model consists in using interviewers assisted by accomplice units for sampling hidden populations that are reluctant and hostile to statistical surveys, with a judicious system. This model operates on the basis of a principle that justifies its procedure. Its implementation depends on three identified hypotheses that we will clarify later, right after the presentation of the principle.
Principle: The SBUC sampling model operates on the basis of
a recruitment process of sample units by interviewers, who are assisted by accomplice units on the one hand, with the implementation of a weighting system by filter survey on the other hand. Thus, in the development of the SBUC m/odel, we substitute the respondent-driven ap- proach of the RDS with the use of interviewers. We also substitute the idea of identifying the time-locations of the TLS with that of identifying and using accomplice units to assist in- terviewers in order to help them collect questionnaire responses. Finally, the model foresees the construction by filter survey of a non-exhaustive sampling frame combined with a rational weighting system. Through this innovative principle of use of interviewers guided and helped by accomplice units in the sensitization of
respondents, not only is it possible to sample the hidden populations, but we can also overcome the reluctance and hostility of the units of interest to respond to the questions of the survey questionnaire. In fact, it is undeniable that the accomplice units have the ability to play a dual role: since they have trust relationships with the units of interest, they are able to easily direct us towards relevant members of the hidden population to be sampled. The second role is that thanks to this mutual trust existing between a unit of interest and an accomplice unit, the latter is able to convince the unit of interest so that they give up their hostility and reluctance to belong to the sample and respond to the questionnaire. Thus, the accomplice unit is both a facilitator in identifying the individuals to be recruited in the sample and an ’interview negotiator’ with them despite their reluctance and hostility. Therefore, there is no doubt that individually, the SBUC model works for constructing the sample of a difficult-to-reach population, and at the same time, it is very efficient for getting the individuals of the sample, who refuse to cooperate with statistical surveys, to talk.
Hypotheses of the Model
We distinguish the following hypotheses:
First hypothesis: The historical, geographical, and
sociological data must be available to identify the main areas included in the scope of the study.
Second hypothesis: There is a population of accomplice
units attached to the population of interest.
Regarding the first hypothesis, the areas represent the different hotbeds of the studied phenomenon. The filter survey or pre-survey will then take into account the so-called historical, geographical, and sociological data for a substantial arbitration that fosters a judicious weight share system, which induces a weighting system as efficient as possible for building unbiased estimators. The historical and sociological data are fundamentally useful for having a more or less precise idea of individual and collective behaviors, as well as specificities perceptible from one area to another with regard to the studied phenomenon. When it comes to the second hypothesis, the SBUC model foresees drawing the accomplice units. A number of accomplice units will be allocated to each interviewer to help them overcome the nuisances likely to cause refusals to respond, whether partial or generalized.
Procedures of the model: The SBUC sampling method has
two key steps: the first step is that of the pre-survey or filter survey after taking into account geographical data and historical and sociological realities of the population of interest. This step leads to the availability of a non-exhaustive sampling frame from which the sample is constituted based on a substantial weighting system. The second step is then that of the survey itself. It consists in interviewing the individuals comprising the sample. This procedure assumes that the following tasks are successively carried out.
• First task: identifying areas which constitute the
geographical scope of the survey and reviewing the historical and sociological data.
• Second task: recruiting the interviewers to be sent to
different areas.
• Third task: recruiting accomplice units
different areas for the constitution of the non-exhaustive sampling frame.
• Fifth task: weight sharing between areas
• Sixth task: implementing the actual survey
• Seventh task: implementing the statistical inference
Building the Sample: Pre-survey and Actual Survey: The
pre-survey is organized in collaboration with some interviewers and accomplice units, and with resource persons with good knowledge of the environment of the survey thanks to their mastery of the historical, geographical and sociological realities of the environment with regard to the studied phenomenon. They must be able to help identify the units of interest despite the fact that they are hidden. For the moment, we are not interested in their aggravating status which is reluctance, especially since there is no need to interview them at this stage. So it is thanks to this pre-survey that the compositions of the k target regions will be identified. We can build the representative statistical distribution of weight share between areas, that is, the suitable weighting system given by the weight calculation for each area against the whole. Thus, we will determine the respective numbers nhof the k subsamples to be
extracted from the k areas with the respective weights fh, h = 1,
2, . . . , k., as follows: for a sample of size n, we have nh= n.fh,
h = 1, 2, . . . , k, with n1 + · · · + nk= n. We thus have a weight
share system for determining, after the actual survey, unbiased estimators from an ’extrapolable’ sample. For a good implementation of the survey, it is important to recruit interviewers along with their respective accomplice units. We will determine the final numbers qh of interviewers in the
different areas as well as the number chof accomplice units to
be hired per area, with the collaboration of the recruited interviewers. If q is the total number of interviewers, and c that of accomplice units, then,
q = ∑ and c ∑ = , h = 1, 2, . . . , k
After these steps, we get the numbers q, c, and n of interviewers, accomplice units and units of interest to be surveyed respectively. The accomplices being drawn by lot among a number of proposals by each of the interviewers in each hotbed, we can consider that, by implication, the nhunits
of interest selected in each area h are drawn by lot, too. In addition, the mixing is done on the basis of a weight share between the areas; these precautions ensure the representativeness of the sample. Under these conditions, the more n is high, the more the representativeness of the sample is enhanced. In this way, the sample will have been both constituted and surveyed on the spot by interviewers and accomplice units, yet in strict compliance with the itineraries imposed by the configuration of the targeted strategic areas during the pre-survey.
Relevance of the SBUC model: The model that we thus
propose for sampling populations that are difficult to reach because of their reluctance, is a kind of very effective strategy for preventing many cases of non- response and missing data that make it difficult, and sometimes even impossible, to estimate many models. This model is of great relevance when it comes to investigating populations such as sex workers, young drug users, homeless people, sellers of generally prohibited products such as drugs, fake medicines, contraband fuel, etc.
So instead of giving free rein to the proliferation of cases of non-response and missing data that one seeks to correct
through specific models, we believe it is better to prevent them instead. Here, we present two models related to studies published in 2010 and 2015, which are among the models for which it is likely for researchers to encounter enormous estimation diffi- culties when respondents are reluctance to respond to questionnaires: the model of McCormick et al, (2010) and that of Molher et al, (2015). In 2010, McCormick, Salganik and Zheng conducted a work in order to effectively estimate individual network sizes. Specifically, their methodological approach consisted in estimating in- dividual network sizes as well as distributions of network sizes, the aim being the implementation, through this distribution, of a specific weight share scheme between networks. In such an ap- proach, the SBUC model could be useful if the respondents were hidden and reluctant. Indeed, the filter survey and the principle of use of accomplice units that we advocate in the SBUC model are therefore of great relevance. Thus, in situations of reluctance of units of interest, the models recommended by the authors to estimate, among other things, the social network sizes, may be difficult to estimate and therefore would lack relevance in case of hostility and refusal of respondents to cooperate. In fact, it is important that they cooperate when asked how many people they know in specific subpopulations. Thereupon, we think that the SBUC model would be of great use because of its principle of use of accomplice units which are facilitators of interview between respondents and interviewers.
As recently as October 2015, a group of researchers, including Mohler, made a publication in which they tried to model certain aspects of police fight against crime in Los Angeles in the U.S. and Kent in the U.K. They think that police must be able to anticipate the future location of dynamic hotspots to disrupt any criminals or authors of public disorder. This study also provides another clear application scope of the SBUC model. Indeed, the commonly known survey scopes pertaining to criminality are necessarily related to hidden and reluctant populations. Thus, to gather the statistics needed for the implementation of the models used by these authors, we also believe that the SBUC model would be of great relevance due to its principle of use of accomplice units The relevance of the SBUC is more perceptible in the following application to the popu- lation of the many Beninese traffickers who engage in the sale of contraband fuel in Benin.
Applying the SBUC model
Study Areas
areas mentioned above are likely to provide five subsamples. In order to establish an appropriate weighting scheme between these areas, a filter survey was carried out from March 20 to March 31, 2013, in accordance with the procedure of the SBUC model.
Implementation of the SBUC model
This implementation is based on the two hypotheses of the SBUC model. The first hypothesis states that the historical, geographical and sociological data necessary for identifying the main hotbeds of contraband fuel sale in Benin, are available. According to the second hypothesis, there is an accomplice population attached to the population of contraband fuel sellers. As foreseen in the model, we must target accomplice units that are likely to negotiate and facilitate the interview with contraband fuel sellers in the selected sample. The goal here is to manage to interview a representative sample of 700 CFS in the whole population of CFS operating throughout the national territory. In this experiment, it is the motorcycle taxi drivers that have been identified as accomplice units. They meet the conditions foreseen in the second hypothesis of the model. In fact, most of the motorcycle taxi drivers are loyal customers of the CFS in general. There is an atmosphere of reciprocal trust between a motorcycle taxi driver and his contraband fuel suppliers. These ties of trust are taken advantage of to persuade the CFS to respond to the survey questionnaire. Seventy (70) interviewers have been recruited and trained according to the objectives and spirit of the survey methodology. Each interviewer was asked to suggest within five (05) days, three (03) names and addresses of motorcycle taxi drivers with whom they want to collaborate. Of the three proposals from each interviewer, a motorcycle taxi driver is chosen by lot. So a total of seventy (70) motorcycle taxi drivers were selected (to limit costs) because both the accomplice units and the interviewers are paid. Eighteen (18) supervisors were hired to supervise the actions of the interviewers and their accomplice units, and there are at least two supervisors for a group of eight (08) interviewers. The supervisors were instructed to necessarily supervise together (both of them) each of the eight interviewers they are responsible for. Each interviewer and their accomplice unit are responsible for recruiting and interviewing a specific number of CFS in the area they are allocated to. The actual survey was conducted in May 2013. The thirty interviewers recruited for the implementation of the pre-survey were allocated as follows: three (03) for Natitingou, six (06) for Parakou, three (03) for Tchaourou, nine (09) for Porto-Novo and nine (09) for Cotonou. They were able to count from May 15 to May 31, 2013 (17 days), 369 outlets in Natitingou, 626 in Parakou, 405 in Tchaourou, 1105 in Porto-Novo and 1179 in Cotonou, totaling 3684 outlets for all five regions. This data is summarized in Table 4.1 and represented in the diagram in Figure 4.1 in Appendix. It is noted that the weight share scheme for these five areas is as follows: 10% for Natitingou, 17% for Parakou, 11% for Tchaourou, 30% for Porto-Novo and 32% for Cotonou . Thus, a non- exhaustive sampling frame of 3684 contraband fuel outlets across these five regions is obtained and will be used. The survey was based on a specific questionnaire to which the surveyed individuals massively responded thanks to the collaboration of motorcycle taxi drivers. 660 CFS responded fully to the questionnaire on 700 surveyed individuals, which is 94%. This application of the SBUC model to the CFS 2013 (Contraband Fuel Sellers during 2013) enabled us to carry out an opinion
poll on the dangerous nature of their activity and the idea of conversion. More specifically, it is question of:
Questioning the CFS 2013 on their opinion about the dangerous nature of contraband fuel sale;
Polling them about a possible conversion into official fuel cooperative members or into other activities.
The following four analytical hypotheses were then formulated:
Hypothesis 1: at least 90% of the CFS 2013 are aware of the
dangerous nature of their activity.
Hypothesis 2: at least 95% of the CFS 2013 support the idea
of conversion.
Hypothesis 3: at least half the CFS 2013 support becoming
member of a micro-station coop- erative.
Hypothesis 4: at least half the CFS 2013 support a change of
activity.
These hypotheses have been inspired by the statistics collected.
Processing methodology of the statistical data collected
The sample data were handled and synthesized by category (using MS Excel) in a variety of statistical tables that appear in Appendix with their respective graphic representations. This allowed for a series of graphic and numerical descriptions of the sample according to the topics discussed in the different hypotheses. The sample data and characteristics are used to make statistical inference on the whole population of CFS 2013. The four hypotheses on the population of CFS were tested using estimates and tests on the data collected.
Statistical inference on the population of CFS 2013
In order to test the four hypotheses, four testing problems have been resolved.
Problem 1
: ≥ 0.90
: < 0.90
The critical value V C1 of this test is:
=
( ̅ − 0.90)
̅ ( ̅ )
n being the size of the sample and p1, the proportion of the sample of CFS 2013 who agree that their activity is dangerous. By statistical inference, it is also a point estimate of the proportion π1 of all CFS 2013 that agree that their activity is dangerous.
Decision criterion: at the 5% error risk threshold, we accept
the hypothesis H0 if
Problem 2
0 : ≥ 0.95
1 : < 0.95
The critical value V C2 of this test is:
= ( ̅ − 0.95)
̅ ( ̅ )
n being the size of the sample and p2, the proportion of the sample of CFS 2013 who agree that their activity is dangerous. By statistical inference, it is also a point estimate of the proportion π2 of all CFS 2013 that agree that their activity is dangerous.
Decision criterion: at the 5% error risk threshold, we accept
the hypothesis H0 if
V C2≥ −1.96
Problem 3
0 : ≥ 0.50
1 : < 0.50
The critical value V C3 of this test is:
=
( ̅ − 0.95)
̅ ( ̅ )
with n being the size of the sample and p3, the proportion of the sample of CFS 2013 who agree to becoming member of a micro-station cooperative.
Decision criterion: at the 5% error risk threshold, we accept
the hypothesis H0 if
V C3≥ −1.96
Problem 4:
0 : ≥ 0.50
1 : < 0.50
The critical value V C4 of this test is:
= ( ̅ − 0.95)
̅ ( ̅ )
with n being the size of the sample and p4, the proportion of the sample of CFS 2013 who agree to a change of activity
Decision criterion: at the 5% error risk threshold, we accept
the hypothesis H0 if
V C4≥ −1.96
RESULTS AND DISCUSSIONS
The data were grouped into two broad categories: the general statistics on the CFS and the data on their opinion about the dangerous nature of their activity and the idea of conversion.
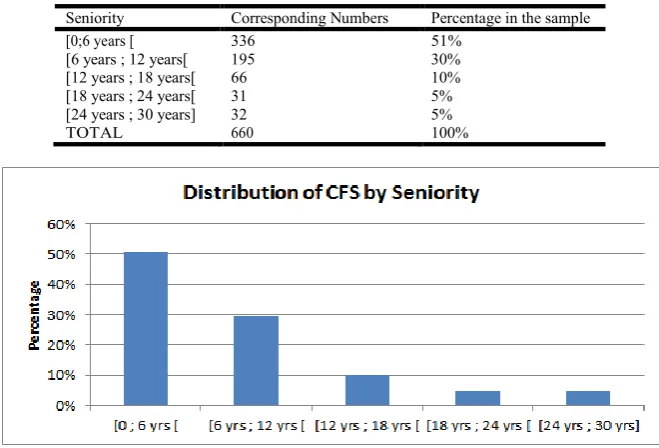
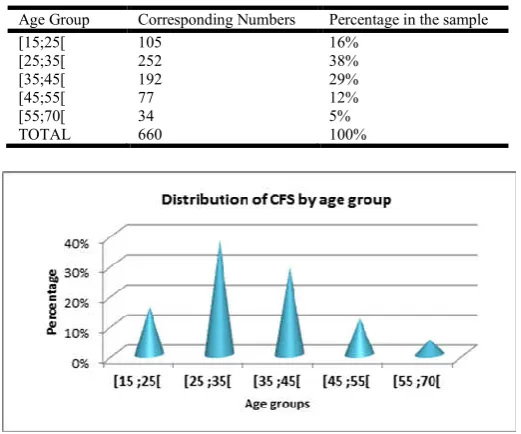
In this application of the SBUC model, we are particularly interested in the results of the opinion poll of the CFS. But before, we present some interpretive elements of the general statistics. All statistical data produced in this application appear in Appendix. From Table 4.2, we can see that 19% of the CFS have a seniority of at least 12 years in this trade. 30% are between 6 and 12 years of seniority. More than half or 51% are under 6 years of seniority. The distribution by gender of these traffickers (Table 4.3) indicates that they are predominantly males (88%). 79% are aged 25-55 (Table 4.4) while 16% are under 25 and 5% are 55 and older. The majority is therefore in the age group 25-55. Furthermore, Table 4.5 describes the distribution of daily earnings: 60% earn more than 5,000 CFA francs per day. The CFS that earn between 20,000 and 300,000 CFA francs per day are up to 20% whereas 40% earn between 5,000 and 20,000 per day. The remaining 40% earn a maximum of 5,000 CFA francs per day. We thus see that the sale of contraband fuel is very beneficial for those who practice it. Table 4.6 gives an idea of the number of dependent children they have. 30% of the CFS have less than two dependent children, 34% have between 2 and 4 dependent children and 36% have between 4 and 18 dependent children. Finally, Table 4.7 indicates that nearly 30% of the CFS employ between 2 and 10 people to help them in their activities.
Results of the opinion poll on the CFS
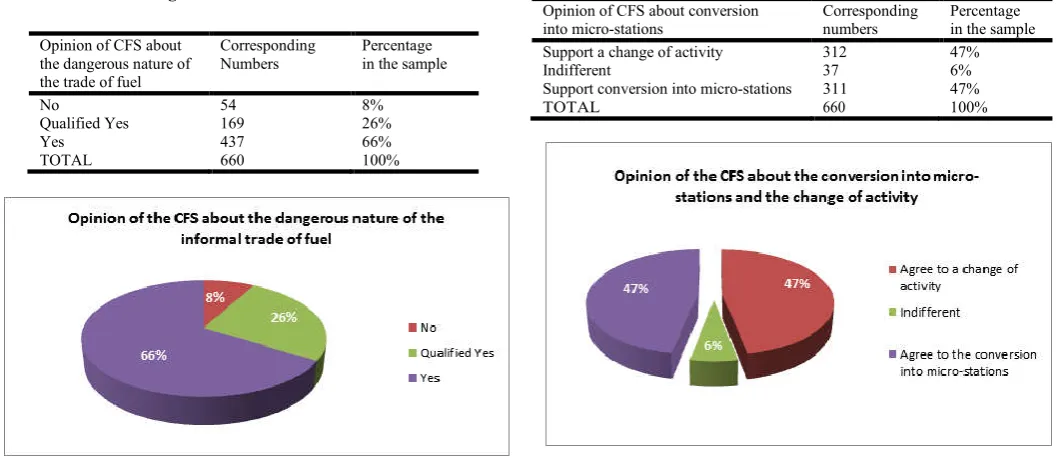
Table 4.8 basically highlights the fact that the majority of the CFS (92%) believe that their activity is actually dangerous. Only 8% believe otherwise. Furthermore, by observing Table 4.9, we can see that barely 6% of the CFS are indifferent to the idea of their conversion. Among the CFS who support to the idea of conversion, 47% affirm that they are ready to change their activity and the same percentage of the CFS support a conversion into micro-station cooperatives. According to the first hypothesis, at least 90% of the CFS 2013 are aware of the dangerous nature of their activity. In the light of the statistics graphically described by Table 4.8, the relevance and the validity of this hypothesis are clearly noticeable. By statistical inference, we estimate that approximately 8% of the individuals in the CFS population do not agree that their activity is dangerous. This finding is confirmed by testing this first hypothesis. We estimate that 92% of the CFS are aware that their activity is dangerous, a figure quite close to 90%.
For the Problem 1 mentioned above, the critical value V C1 of this test is:
= (0.92 − 0.90)
. ( . )
So we accept the null hypothesis H0 with an error risk of 5%,
is greater than -1.96. We conclude, with an error risk of 5%, that the null hypothesis H0 is accepted. Furthermore, there is a
small proportion of CFS 2013 that are not hostile to the idea of a conversion but are rather indifferent. So we can say that almost unanimously, the CFS 2013 are aware that they must abandon this illegal trade. At least half the CFS 2013 agree to becoming member of a micro-station cooperative. The point estimate indicates that 47% of the CFS adhere to the idea of grouping into micro-station cooperatives. This proportion confirms the hypothesis and the critical value of the corresponding problem 3 is −1.54 ≥ −1.96. Thus we accept the null hypothesis H0 with an error risk of 5%. According to the fourth hypothesis, at least half the CFS 2013 support a change of activity. It was estimated that 47% of the CFS 2013 support the idea of a change of activity. This finding goes in favor of validating this hypothesis and the critical value of the corresponding problem 4 is −1.54 ≥ −1.96. We therefore accept the null hypothesis H0 with an error risk of 5%. This experiment with the SBUC model using this particular type of hidden population made up by the CFS 2013 because of their reluctance, reveals that it is quite an efficient model. In all cases, the overall SBUC is coherent and its application has been successful with a success rate of 94%. This success rate could be further improved if we had more resources for the survey. Apart from the CFS 2013, the SBUC model can be used to carry out many studies involving people likely to show, in large numbers, hostility or resistance to respond to statistical survey questionnaires. We can mention, for example, studies about the opinion poll of sex workers, the behaviors and motivations of young drug users, the activity of fake medicine sellers, and the behaviors of homeless people.
Acknowledgments
We thank the KIVINSTAT Statistical Investigation Practice for having helped us conduct the statistical surveys. We thank INSAE and ENSPD in Tchaourou for their collaboration. We thank the National School of Applied Economics and Management of the University of Abomey- Calavi for its financial support in the statistical surveys of March and May 2013.
REFERENCES
Ardilly, P., et Le Blanc D. 2001. Echantillonnage et pondération d’une enquête auprès de per- sonnes sans domicile : un exemple franais, INSEE Méthodes, 23p. Borovkov A. 1984 ” Statistique Mathématique ”, traduction
francaise, Editions Mir Moscou, 1987, du russe par Embarek D., Editions 1984.
Chevry, G. 1962. ” La pratique des enquêtes statistiques ” préface de GRUSON C. Paris, collection PUF, 310 p Cochran,W.G. 1977. Sampling Techniques. John Wiley and
Sons, New York.
Doutetien, H. 2012. Commerce informel de l’essence frelatée : et si nous osions formaliser le ” kpayo ” ?. Hebdomadaire catholique, la Croix
Genet J., Pupion G. Et Repussard M. 1974. Probabilités, statistiques et sondages, VUIB- ERT, Paris
Heckathorn, D.D. 1997 ”Respondent-Driven Sampling: A New Approach to the Study of Hidden Populations ?, Social Problems, Vol. 44, No. 2, pp. 174-199.
Heckathorn, D.D. 2002. ”Respondent-Driven Sampling II: Deriving Valid Population Esti- mates from Chain-Referral
Samples of Hidden Populations”, Social Problems, Vol. 49, No.1, pp. 11-34.
Heimer, R. 2005. ”Critical Issues and further questions about RDS : comment on Ramirez Valles et al.”, Aids and behavior, Vol. 9, No.4, pp. 403-408.
Igue, J.O. 2008. Le secteur informel au Bénin : Etat des lieux pour sa meilleure structuration, LARES, p18.
INSAE Cotonou, Bnin 2006. Résultats de l’Enquête Modulaire Intgrée sur les Conditions de Vie des ménages.
INSAE Cotonou, Bnin 2010. ECENE : Rapport dénitif du premier passage, 128p.
Jauffret-Roustide, M., Le Strat, Y., Razafindratsima, N., Emmanuelli, J., et Desenclos J.C. 2008. ” Enquête de prévalence du VIH et du VHC chez les UD, complte par une recherche socio anthropologique en France métropolitaine 2004-2007 ” in P. Guilbert, D. Haziza, A. Ruiz-Gazen et Y. Till (sous la direction de) Méthodes de sondage, Paris : Editions Dunod.
Johnston, L., et Sabin, K. 2010. ” Echantillonnage déterminé selon les répondants pour les populations difficiles à joindre ”, Methodological Innovations Online (2010) 5(2) 38-48. World Health Organization - University of California. Kalton, G. 2009. Methods for oversampling rare
subpopulations in social surveys, Survey Methodology, Vol. 35, №. 2, pp.125-141.
LARES 1998. Estimation des importations de produits nigrians au Bnin, LARES-MCAC, 480 1998, 95p.
LARES 2005. Le traffic illicite des produits pétroliers entre le Bénin et le Nigéria : vice ou vertu pour l’économie béninoise. Série des changes régionaux. Septembre 2005. 137p.
LARES, et SONACOP. 2011. Etude du marché des produits pétroliers au Bénin, juillet 2011. 93p.
Lecoutre, J-P., Legait-Maille, S. et Tassi, P. (1990). Statistique : Exercices corrigés et rappels de cours, 2 ème dition MASSON Paris Milan Barcelone Mexico, p 9.
Marpsat, M. et Firdion, J-M. 1999. The homeless in Paris : a representative sample survey of users of services for the homeless , in D. Avramov (dir) Coping with homelessness : issues to be tackled and best practices in Europe, Aldershot, Brookeld USA, Singapore, Sydney : Ashgate Publishing. Marpsat, M. et Razafindratsima, N. (2010), Les méthodes
d’enquétes auprès des populations diffciles à joindre : introduction au numéro spécial, INSEE-INED-ERIS, Methodological innovation online, 11p.
Marpsat, M., Quaglia, M., et Razafindratsima, N. 2004. ”Les sans domicile et les services itinérants”, Travaux de l’Observatoire 2003-2004, pp. 255-290.
McCormick, T.H., Salganik, M.J., and Zheng, T. 2010. ”How many people do you know ? : efficiently estimating personal network size”, Journal of the American Statistical Association, Vol . 105, No. 489, pp. 59-70.
Ouellet, G. 1985. Statistiques théorie-exemples-problèmes, Edition le Griéon d’Argile.
Pollack, L.M., Osmond D.H., Paul J.P. et Catania, J.A. 2005. ”Evaluation of the Center for Disease Control and Preventions HIV behavioral surveillance of men who have sex with men: Sampling issues”, Sexually Transmitted Diseases, Vol. 32, No.9, pp. 581-589.
Quaglia, M. et Vivier, G. 2006. Conducting surveys among diffcult to reach populations : from theory to practice and reality, European conference on quality in survey statistics, Cardi, 24-26 avril 2006.
Quaglia, M., et Razafindratsima, N. 2004. Enquête auprès des sans-abri qui n’ont jamais ou rarement utilisé les services Quaglia, M., Razafindratsima, N., et Sirot, A. 2003.
Point-in-time statistical surveys of the homeless population in France, CUHP, rencontre de Madrid, www.cuhp.org. Recueil du Symposium 2004 de Statistique Canada - Méthodes
innovatrices pour enquêter auprès des populations diffciles à joindre, Gatineau, Québec, 3-5 novembre 2004.
Tassi, P. 1985. Méthodes Statistiques, Edition ECONOMICA, Collection Economie et Statistiques avancées, p7
Thompson, S.K. 1992. Sampling. John Wiley and Sons, New York.
UEMOA (2002). Principaux résultats de l’enquête 1-2-3 de 2001-2002 réalisés par les instituts nationaux de statistique des Etats membres avec l’appui technique d’AFRISTAT et de DIAL et sur le financement de l’Union Européenne.
.
Appendix
Statistics on the characteristics of the CFS 2013 population
[image:8.595.134.472.301.527.2]These statistics were obtained after applying the SBUC model to contraband fuel sellers in Benin in 2013 (pre-survey in March 2013 and actual survey in May 2013).
Table 1. Table of weight share between the strategic hotbeds from the distribution of the numbers of contraband fuel outlets per area
H Hotbeds Number of outlets in the hotbed Weight
1 Natitingou 369 10%
2 Parakou 626 17%
3 Tchaourou 405 11%
4 Porto-Novo 1105 30%
5 Cotonou 1179 32%
Total 3684 100%
[image:8.595.136.466.567.791.2]Figure 1. Weight share scheme between the five areas
Table 2. Distribution of CFS by seniority
Seniority Corresponding Numbers Percentage in the sample
[0;6 years [ 336 51%
[6 years ; 12 years[ 195 30%
[12 years ; 18 years[ 66 10%
[18 years ; 24 years[ 31 5%
[24 years ; 30 years] 32 5%
TOTAL 660 100%
Table 3. Distribution of CFS by gender
Gender Corresponding Numbers Percentage in the sample
Female 81 12%
Male 579 88%
TOTAL 660 100%
[image:9.595.169.430.317.534.2]Figure 3. Diagram of CFS distribution by gender
Table 4. Distribution of CFS by age group
Age Group Corresponding Numbers Percentage in the sample
[15;25[ 105 16%
[25;35[ 252 38%
[35;45[ 192 29%
[45;55[ 77 12%
[55;70[ 34 5%
TOTAL 660 100%
[image:9.595.136.463.586.683.2]Figure 4. Diagram of the distribution of CFS 2013 by age group
Table 5. Distribution of CFS by daily earnings
Daily earnings (in CFA Francs) Corresponding Numbers Percentage in the sample
[0;5000[ 255 39%
[5000;10000[ 135 20%
[10000;20000[ 131 20%
[20000;30000[ 58 9%
[30000;40000[ 23 3%
[40000;50000[ 15 2%
[50000;100000[ 37 6%
[100000;300000] 6 1%
[image:9.595.123.475.709.796.2]TOTAL 660 100%
Table 6: Distribution of CFS by number of dependent children
Number of dependent children Corresponding Numbers Percentage in the sample
[0;2[ 201 30%
[2;4[ 222 34%
[4;6[ 131 20%
[6;8[ 50 8%
[8;10[ 21 3%
[10;12[ 21 3%
[12;18[ 14 2%
Figure 5. Diagram of the daily earnings of CFS 2013 (in thousand francs CFA)
Figure 6. Diagram of the distribution of CFS 2013 by number of dependent children
Table 7. Distribution of CFS by individual number of employees
Number of employee Corresponding Numbers Percentage in the sample
[0;2[ 469 71%
[2;4[ 152 23%
[4;6[ 26 4%
[6;10[ 7 1%
[10;55] 6 1%
[image:10.595.135.448.476.764.2]TOTAL 660 100%
Statistics on the opinion poll
Table 8. Distribution of CFS according to their opinion about the dangerous nature of the trade
Opinion of CFS about the dangerous nature of the trade of fuel
Corresponding Numbers
Percentage in the sample
No 54 8%
Qualified Yes 169 26%
Yes 437 66%
TOTAL 660 100%
Figure 8. Opinion of the CFS about the dangerous nature of their activity
Table 9. Distribution of CFS according to their opinion about grouping into official micro-station cooperatives and changing
activity
Opinion of CFS about conversion into micro-stations
Corresponding numbers
Percentage in the sample Support a change of activity 312 47%
Indifferent 37 6%
Support conversion into micro-stations 311 47%
TOTAL 660 100%
Figure 9. Distribution of the CFS 2013 according to their opinion about the idea of conversion