Full Length Research Article
INFLUENCE OF DIFFERENT ROW SPACING ON AGRONOMIC TRAITS IN DIFFERENT WHEAT
VARIETIES
1*
Ghulam Shah Nizamani,
1Imtiaz Ahmed Khan,
1Abdula Khatri,
1Muhammad Aquil Siddiqui,
2
Muhammad Rashid Nizamani and
2Muhammad Ibrahim Khaskheli
1
Nuclear Institute of Agriculture (NIA), Tando Jam, Pakistan
2
Sindh Agriculture University, Tando Jam, Pakistan
ARTICLE INFO ABSTRACT
A series of experiment was conducted at Malir Experimental Farms, Sindh Agriculture University, Tandojam during 2009-10 to study the response of different wheat varieties under various row spacing. The experiment was laid out in RCB design with split plot arrangements having four replications. Three varieties of wheat (Sarsabz, Kiran - 95 and TD-1) and three rows spacing (15.00, 22.50 and 30 cm) were used studied. The results indicated that maximum biological yield (10017 kg ha-1),plant height (104.00) in Sarsabz, spike length (12.65 cm), grain yield (4659.0 kg ha-1) in Kiran-95, tillers (333.00 m2), number of grains spike-1 (46.66), grain weight spike-1 (45.41
g) in TD-1 were recorded under 30.00 cm row spacing; while 1000- grain weight (44.75 g) in under 22.50 row spacing and harvest index (48.10 %) under 15.00 cm row spacing in TD-1 variety. Based on the findings it can be concluded that wheat variety Kiran-95, followed by T D-1 and Sarsabz produced better performance with respect to yield and yield components. Similarly, 30 cm row apart was superior to 15.00 and 22.50 cm row spacing.
Copyright © 2014 Ghulam Shah Nizamani et al. This is an open access article distributed under the Creative Commons Attribution License, which permits unrestricted use, distribution, and reproduction in any medium, provided the original work is properly cited.
INTRODUCTION
Wheat is the basic staple food for most of the population and largest grain source of the country. Its importance is always recognized when formulating agricultural policies. It contributes 12.5 percent to the value added in agriculture and 2.6 percent to GDP. Wheat is cultivated in an area of 8666 thousand hectares in 2011-12, showing a decrease of 2.6 percent over last year’s area of 8901 thousand hecctares. The production of 23.5 million tons is estimated during July-March, 2011-12 (GoP, 2011-12). Among the factors responsible for low wheat yield, delay in sowing, traditional sowing methods, low seed rate and improper row spacing are very important. Under the present practice of sowing wheat after rice and cotton, wheat sowing often gets delayed,
reducing the yield to a considerable extent (Iqbal et al., 2010).
According to Singh and Uttam (1994) the highest yield was obtained by using a seed rate of 125 kg whereas, seed rate of
160 kg for getting maximum yield was suggested by Ram et
al., 1988. Plant population in a unit area is regarded as an
*Corresponding author: Ghulam Shah Nizamani
Nuclear Institute of Agriculture (NIA), Tando Jam, Pakistan
important input to have a bumper crop stand ending in a plentiful harvest. There are two common ways of manipulating plant population such as by increasing seed rate and by
changing row spacing (Sial et al., 2001). Shaheena et al.,
(1987) studied the effect of population density on yield and yield components of wheat. They found that the plant population increased at 25 cm row spacing as compared to 30 cm, but the yield performance of various row spacing was partly due to the contribution of yield components, such as increased number of grains per spike and 1000 grain weight. Human beings practically attain all their food directly or indirectly from plants. Thus the focus of the researchers’ is to increase the per unit area production. The increased advanced cultural practices like using certified seed of improved varieties, optimum seed rate, timely sowing, proper irrigation and fertilizers. Due to the above mention usefulness of proper row spacing it may be helpful to increase and improve the yield components of wheat crop. This low production is indication of the vast potential gap, which can be bridged up through vertical increase in the crop yield by seed density and
row spacing (Habibullah et al., 2007). The present study was
aimed to determine the influence of row spacing on grain yield and yield components of spring wheat varieties in our environment.
ISSN:
2230-9926
International Journal of Development Research
Vol. 4, Issue, 11, pp. 2207-2211, November,2014
International Journal of
DEVELOPMENT RESEARCH
Article History:
Received 02nd August, 2014 Received in revised form 22nd September, 2014 Accepted 19th October, 2014 Published online 18th November, 2014
Key words:
MATERIALS AND METHODS
Plant material and details of experiments
The field experiment was conducted at Malir Farm, Sindh Agriculture University Tandojam, Pakistan located at 25o25’60’N 68o31’ 60E during 2009-2010. The three spring wheat varieties were planted under three different rows spacing to determine the influence on yield components. The experiment was conducted in three replicated randomized complete block design (Factorial) and plot size of 1.2 x 2 m = 2.4 m2 (2m long 4 rows) with three wheat varieties; Sarsabz, Kiran-95 and TD-1 under row spacing 15.00, 22.50 and 30.00 cm. The standard seed rate of 125 kg ha-1 was used in this experiment. Twelve plants were selected randomly from each treatment for further observations. Meteorological data for season (2009-2010) were obtained from Wheat Section, Plant Breeding & Genetics Division, Nuclear Institute of Agriculture (NIA), Tandojam. Recommended land preparation operations were performed for equal distribution of canal irrigation. Sowing was done with single coulter hand drill. The
crop was sown on 12th November in Rabi season.
The basal dose rate of NPK fertilizers at the rate of 140-60-30
kg ha-1 was applied in the form of urea, Di-ammonium
phosphate and sulphate of potash, respectively. All P, K and half N were applied at sowing time; while remaining N was equally divided into two splits and applied at first and third irrigation time. First irrigation was applied 25-30 days after sowing and subsequent irrigations were applied as soil and crop requirement. Weed management practices were done manually for reducing weed crop completion. The soil analysis of experimental areas showed that soil was clay loam in texture, non saline (pH= 7.0- 7.3), low in organic matter (0.82-0.94%), total nitrogen (0.52-0.61%), available phosphorus (0.90-156 mg kg-1) and exchangeable potassium (234-284 mg kg-1). The experiment was harvested on 4th April during
2010. The minimum mean temperature 17.75 oC, maximum
32.38 oC and humidity 69.25 % was recorded during Rabi
season 2009-2010. The temperature was favourable during December to February for growth period.
Determinations of agronomical characters
Plant height was measured from ground level to the top of the
spike termination node. Tiller count was done from m-2 area in
each treatment and these tillers were also used for nodes stem-1
and internodes length (through measuring tape). Spike length was measured from 10 randomly selected spikes through measuring tape. These spikes were separately threshed and grains were counted and weighed on top loading digital
balance. Number of grains spike-1 was counted from ten
randomly selected spikes in each replication at harvest. Grain
weight spike-1 was recorded by using digital electronic balance
at harvest. The 1000 grains were weighed on same electronic balance for seed index. Biological and grain yield were recorded from four rows at the time of harvest from each treatment. Harvest index of each treatment was calculated by
using formula, harvest index = Grain yield/ biological yield x
100. The crop was harvested during March, 30th to April 4th of
2009 and 2010.
Statistical analysis
The experimental data were recorded and statistically analyzed through Statistix 8.1 computer software (Analytical Software,
2005), the means were separated using least significant difference (LSD) test. All differences described in the text were significant at the 5% level of probability.
RESULTS AND DISCUSSION
Tillers (m-2)
It is considered that tillers per unit area increase with increase in row spacing. The data presented in Table 1 showed that
significant differences were found in number of tillers m-2 at
row spacing in all wheat varieties. The mean value for
varieties showed that maximum tillers m-2 (320.00) were
observed in TD-1, While maximum was found (310.89) under row spacing (22.50 cm). The interactive between varieties x
row spacing was also significant. The maximum tillers m-2
(333.33) was found in TD-1 under row spacing (30.00 cm) and
minimum tillers m-2 (234.67) was recorded in Kiran - 95,
[image:2.595.311.555.305.423.2]under row spacing (30.00 cm).
Table 1. Influence of row spacing on tillers (m-2) of wheat varieties during 2009-10
Row spacing (cm)/ Varieties
Tillers (m-2) Mean of row spacing Sarsabz Kiran-95 TD-1
15.00 281.67 a 299.33 a 307.00 a 296.00 a 22.50 296.67 a 316.33 a 319.67 a 310.89 a 30.00 304.00 a 234.67 a 333.33 a 290.67 a Mean of varieties 294.11 a 283.44 a 320.00 a -
Statistics
Traits SE LSD (5%)
Varieties (V) 2.174 3.606
Row spacing (R) 2.174 3.606
Interactive V x R 4.06 6.77
The results agreed with (Kabir et al., 2009) that the number of
grains spike-1 and number of productive tillers m² decrease
with the increasing of seed rate kg ha-1 and also the highest
grain yield of 4280 kg ha-1 was obtained with 100 kg ha-1 seed
rate and 30cm apart-rows followed by the plot of 125 seed rate
kg ha-1 and 30 cm apart rows giving yield of 4075 kg ha-1. The
results supported by Singh and Srivastava (1991) that tiller numbers increased with increasing row spacing. The highest number of productive tillers m² tillers was noted in 30 cm row spacing followed by 22.50 cm row spacing, while the lowest number of productive tillers per m² was observed in 15 cm
row spacing. The results also confirmed by Habibullah et al.
(2007). Similar results are also reported by Rajput et al.
(1989).
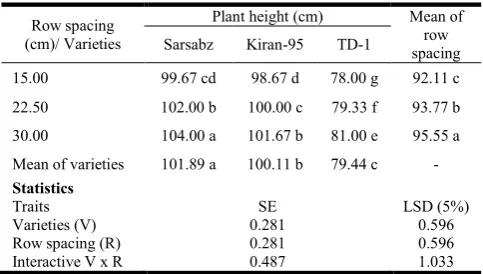
Table 2. Influence of row spacing on plant height (cm) of wheat varieties during 2009-10
Row spacing (cm)/ Varieties
Plant height (cm) Mean of row spacing Sarsabz Kiran-95 TD-1
15.00 99.67 cd 98.67 d 78.00 g 92.11 c
22.50 102.00 b 100.00 c 79.33 f 93.77 b
30.00 104.00 a 101.67 b 81.00 e 95.55 a
Mean of varieties 101.89 a 100.11 b 79.44 c -
Statistics
Traits SE LSD (5%)
Varieties (V) 0.281 0.596
Row spacing (R) 0.281 0.596
[image:2.595.312.554.641.778.2]Plant height (cm)
The results of the experiment revealed that the mean values for maximum plant height was observed (101.89 cm) in Sarsabz variety, while maximum plant height (95.55 cm) for mean value (95.55) under row spacing 30.00 cm in Table 2. The interactive between varieties x row spacing indicated that maximum plant height (104.00 cm) was observed in Sarsabz under row spacing (30.00 cm) and minimum plant height (78.00 cm) was recorded in TD-1 under row spacing (15.00 cm). The differences of plant height could be due the genetic make-up of varieties. Similar results are also reported by
[image:3.595.309.552.177.284.2]Rajput et al. (1989).
Table 3. Influence of row spacing on spike length (cm) of wheat varieties during 2009-10
Row spacing (cm)/ Varieties
Spike length (cm) Mean of row spacing Sarsabz Kiran-95 TD-1
15.00 10.25 h 12.32 c 11.53 e 11.36 c 22.50 10.40 g 12.48 b 11.64 d 11.50 b 30.00 10.49 f 12.65 a 11.71 d 11.61 a Mean of varieties 10.380 c 12.48 a 11.630 b -
Statistics
Traits SE LSD (5%)
Varieties (V) 0.021 0.045
Row spacing (R) 0.021 0.045
Interactive V x R 0.037 0.078
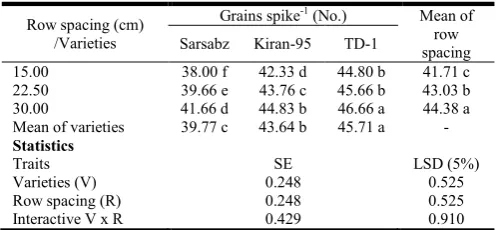
Grains spike-1 (No.)
The mean for varieties indicated maximum number of grain
spike-1 was 45.71 in T D - 1 and maximum mean value 44.38
under row spacing (30.00 cm) was observed. The data presented in Table 4 showed for interactive influence of
varieties and row spacing that maximum grains spike-1 44.66
in TD-1 under 30.00 cm row spacing and minimum 38.00 in Sarsabz under 15.00 cm row spacing were found in number
grains spike-1. Singh and Srivastava (1991) reported that
numbers of grains spike-1 increased with increasing row
spacing. The differences in number of grains spike-1 were
probably due to variation in genetic potential from variety to
variety. Inamullah et al. (2006) also observed significant
differences in grains per spike among different wheat varieties. The results also agree with the finding of Barria and Pihan (1981).
Table 4. Influence of row spacing on grains spike-1 (No.) of wheat varieties during 2009-10
Row spacing (cm) /Varieties
Grains spike-1 (No.) Mean of row spacing Sarsabz Kiran-95 TD-1
15.00 38.00 f 42.33 d 44.80 b 41.71 c 22.50 39.66 e 43.76 c 45.66 b 43.03 b 30.00 41.66 d 44.83 b 46.66 a 44.38 a Mean of varieties 39.77 c 43.64 b 45.71 a -
Statistics
Traits SE LSD (5%)
Varieties (V) 0.248 0.525
Row spacing (R) 0.248 0.525
Interactive V x R 0.429 0.910
Grains weight spike-1 (g)
The results for grains weight spike-1 in Table 5 indicated that
maximum grains weight spike-1 for mean of varieties (45.21 g)
and row spacing mean value (44.05 g) were recorded. The
results indicated for interactive influence of varieties and row
spacing that maximum grains weight spike-1 (45.41 g) in T D -
1 variety under 30.00 cm row spacing while minimum grains
weight spike-1 (40.80 g) in Sarsabz variety under 15.00 cm row
spacing were observed. Yadev et al. (2001) also found similar
results and suggested that seed rate of 125 kg ha-1 had
[image:3.595.37.287.241.355.2]significantly higher values in grain weight spike-1.
Table 5. Influence of row spacing on grains weight spike-1 (g) of wheat varieties during 2009-10
Row spacing (cm) /Varieties
Grains weight spike-1 (g)
Mean of row spacing Sarsabz Kiran-95 TD-1
15.00 40.80 e 42.84 c 45.09 a 42.91 c 22.50 41.84 d 43.62 b 45.12 a 43.52 b 30.00 42.76 c 43.98 b 45.41 a 44.05 a Mean of varieties 41.80 c 43.48 b 45.21 a -
Statistics
Traits SE LSD (5%)
Varieties (V) 0.134 0.285
Row spacing (R) 0.134 0.285
Interactive V x R 0.233 0.495
1000-grains weight (g)
The data regarding 1000 grains weight is presented in Table 6. 1000-grain weight is also an important yield determining component of wheat. The analysis of the data indicates that maximum mean value (44.61 g) for varieties and (43.53 g) was recorded mean value for row spacing was produced. The interactive influence of varieties and row spacing showed that maximum (44.75 g) in T D - 1 under 22.50 row spacing and minimum was noted 40.14 g in Sarsabz under 15.00 cm row spacing in 1000 grain weight. Singh and Srivastava (1991) reported that 1000-grain weight increased with increasing row spacing.
Table 6. Influence of row spacing on 1000-grains weight (g) of wheat varieties during 2009-10
Row spacing (cm)/ Varieties
1000-grains weight (g) Mean of row spacing Sarsabz Kiran-95 TD-1
15.00 40.14 e 42.43 c 44.36 a 42.31 c 22.50 41.36 d 43.25 b 44.75 a 43.12 b 30.00 42.54 c 43.31 b 44.73 a 43.53 a Mean of varieties 41.35 c 43.00 b 44.61 a -
Statistics
Traits SE LSD (5%)
Varieties (V) 0.173 0.367
Row spacing (R) 0.173 0.367
Interactive V x R 0.300 0.636
Grains yield (kg ha-1)
The data regarding grain yield is presented in Table 7. The results indicated that maximum mean value of grain yield
4559.0 kg ha-1 in Kiran - 95 and maximum mean value 4457.6
grain yield kg ha-1 was obtained under 30.00 cm row spacing.
The interactive influence of varieties and row spacing indicated that maximum mean value for grain yield of 4659.0
kg ha-1 was obtained in Kiran - 95 under 30.00 cm row spacing
and minimum 4054.3 grain yield kg ha-1 in Sarsabz under
15.00 cm row spacing. There are controversial reports in the literature regarding the role of row spacing in wheat production. Sharma and Thakur (1990) investigated that grain yield was non-significantly affected by sowing wheat either at
22 or 30 cm row spacing. Raj et al. (1992) reported that row
[image:3.595.308.557.487.593.2] [image:3.595.38.287.602.717.2]the yields were lower in the wider row spacing (30 cm). The results confirm by Dawood (1994) that grain yield increased with increasing row spacing. The results further confirmed by
Habibullah et al. (2007) that highest grain yield was obtained
[image:4.595.36.290.160.300.2]from the plots with wider spacing 30cm followed by the same row spacing of 22.50 cm.
Table 7. Influence of row spacing on grains yield (kg ha-1) of wheat varieties during 2009-10
Row spacing (cm)/ Varieties
Grains yield (kg ha-1) Mean of row spacing Sarsabz Kiran-95 TD-1
15.00 4054.3 g 4454.7 d 4459.3 d 4322.8 c 22.50 4148.0 f 4563.3 b 4503.0 c 4404.8 b 30.00 4160.7 e 4659.0 a 4553.0 b 4457.6 a Mean of varieties 4121.0 c 4559.0 a 4505.1 b -
Statistics
Traits SE LSD
(5%) Varieties (V) 2.943 3.240 Row spacing (R) 2.943 3.240 Interactive V x R 2.098 4.809
Biological yield (kg ha-1)
The data regarding grain yield is presented in Table 8. The results indicated that maximum mean value of biological yield
9963.0 kg ha-1 in Sarsabz and maximum mean value 9760.2
biological yield kg ha-1 was obtained under 30.00 cm row
spacing. The interactive influence of varieties and row spacing indicated that maximum mean value for biological yield of
10017 kg ha-1 was obtained in Sarsabz under 30.00 cm row
spacing and minimum 9270.0 biological yield kg ha-1 in T D -
[image:4.595.39.285.474.591.2]1 for 15.00 cm row spacing.
Table 8. Influence of row spacing on biological yield (kg ha-1) of
wheat varieties during 2009-10
Row spacing (cm) /Varieties
Biological yield (kg ha-1) Mean of row spacing Sarsabz Kiran-95 TD-1
15.00 9924 c 9546 f 9270 i 9580.1 c 22.50 9948 b 9659 e 9377 h 9661.4 b 30.00 10017 a 9766 d 9498 g 9760.2 a Mean of varieties 9963.0 a 9657.0 b 9381.8 c -
Statistics
Traits SE LSD (5%)
Varieties (V) 1.081 3.531
Row spacing (R) 1.081 3.531
Interactive V x R 3.336 5.313
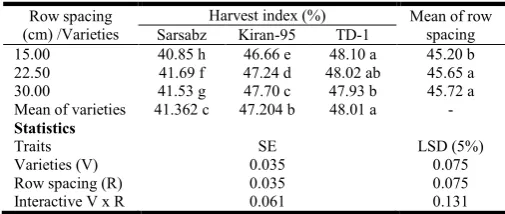
Harvest index (%)
The data was recorded on harvest index is shown in Table 9.
Table 9. Influence of row spacing on harvest index (%) of wheat varieties during 2009-10
Row spacing (cm) /Varieties
Harvest index (%) Mean of row spacing Sarsabz Kiran-95 TD-1
15.00 40.85 h 46.66 e 48.10 a 45.20 b 22.50 41.69 f 47.24 d 48.02 ab 45.65 a 30.00 41.53 g 47.70 c 47.93 b 45.72 a Mean of varieties 41.362 c 47.204 b 48.01 a -
Statistics
Traits SE LSD (5%)
Varieties (V) 0.035 0.075
Row spacing (R) 0.035 0.075
Interactive V x R 0.061 0.131
The mean value for variety indicated that maximum harvest index of 48.01% was noted in T D - 1 and maximum mean value 45.72 for row spacing of 30 cm. While the interactive of varieties x row spacing showed that maximum harvest index value of 48.10% was obtained in T D - 1 under 15.00 cm having row spacing and minimum 40.85% was observed in Sarsabz under 15.00 cm row spacing. The harvest index increase with increasing plant height. The Sarsabz and Kiran - 95 are tall varieties, while the T D - 1 is semi dwarf variety.
REFERENCES
Analytical Software, 2005. Statistix 8.1 user's manual, Tallahassee, FL.
Barriga, B.P. and S.R. Pihan. 1981. Effect of Sowing Rates on agronomic and morphological characters of spring wheat. Agron. J., 72: 113-114.
Dawood, R.A. 1994. Effect of row spacing and timing of nitrogen application on the yield, yield components and
some technological properties of wheat grains (Triticum
aestivum, L.). Assiut J. Agric. Sci. 25: 3 19-340.
GOP (2011-12). Economic Survey of Pakistan. 2011-2012. Ministry of Food, Agriculture and Livestock, Government of Pakistan, Statistics Division (Economic Wing), Islamabad, p. 21.
Habibullah, N.A., N.H. Shah, Anis-u- Rahman1 and F.I. Seed. 2007. Response of row spacing and seed rate on the yield
of wheat. Pak. J. Pl. Sci., 13 (2): 143-146.
Inamullah, H. A., F. Mohammad, S.U. Din, G. Hassan and R. Gul. 2006. Diallel analysis of the inheritance pattern of
agronomic traits of bread wheat. Pak. J. Bot., 38 (4):
1169-1175.
Iqbal, N., N. Akbar, M. Ali, M. Sattar and L. Ali 2010. Effect of seed rate and row spacing on yield and yield
components of wheat (Triticum aestivum L.). J. Agri. Res.,
48(2): 151-156.
Kabir, A.R. Khan, M.A. Islam and M.R. Haque. 2009. Effect of seed rate and irrigation level on the performance of
wheat cv. Gourab. J. Bangladesh Agril. Univ., 7(1): 47-52.
Raj, S., S. Diwan, V.U. Rao, R. Singh and D. Singh. 1992. Effect of date of sowing and row spacing on the yield of
wheat (Triticum aestivum L.). Crop Res. Hisar., 5:
199-206.
Rajput, F.K.M., A.S. Arain, M.J. Rajput, S.M. Alam and A.W. Baloch. 1989. The growth and yield of wheat as affected
by different seed rates and row spacing. Sarhad J. Agri., 5:
479-482.
Ram, K., T. Sing, H. Singh and A. S. Faroda. 1988. Effect of seed rate and spacing on grain yield of late sown wheat
variety WH-291. Haryana Agri. Uni. J. Res., 18(1): 26-28.
Shaheena., S.A. Waraich, S.Z. Mustafa and I. Ahmed. 1987. Effect of population density on yield and yield components
and quality of wheat. Pak. J. Agric. Res., 8(2): 130.132.
Sharma, R.R. and R.C. Thakur. 1990. Effects of seed rates, row spacing and soil moisture conservation practices on
rainfed wheat (Triticum aestivum L.). Himachal J. Agric.
Res., 16: 1-5.
Sial M.A., M. A. Arain, M. A. Javed and N.A. Nizamani. 2001. Response of wheat genotypes on yield and yield
components with changing plant population densities. Pak.
J. Bot. 33: 798-803.
Singh, R.B. and R.K. Srivastava. 1991. Influence of different
spacing on the yield of wheat (Triticum aestivum L.). New
[image:4.595.35.288.668.775.2]Singh, V.P.N. and S.K. Uttam. 1994. Effect of seed rate and sowing depth on yield of wheat under saline alkali soil. Bhartiya Krishi Anusandham Patrika. 9: 73-76.
Yadev, D.P, Valshya, R.D. and Gajendera Singh. 2001. Response of late sown wheat to method of sowing, seed
rate and weed management practices. Ann. Agric. Res.,
22(3): 429-431.