Robson, Colin
Students with disabilities, learning difficulties and disadvantages: statistics and indicators
Original Citation
Robson, Colin (2005) Students with disabilities, learning difficulties and disadvantages: statistics
and indicators. OECD: Organisation for Economic Cooperation and Development, France. ISBN
9264009809
This version is available at http://eprints.hud.ac.uk/id/eprint/464/
The University Repository is a digital collection of the research output of the
University, available on Open Access. Copyright and Moral Rights for the items
on this site are retained by the individual author and/or other copyright owners.
Users may access full items free of charge; copies of full text items generally
can be reproduced, displayed or performed and given to third parties in any
format or medium for personal research or study, educational or notforprofit
purposes without prior permission or charge, provided:
•
The authors, title and full bibliographic details is credited in any copy;
•
A hyperlink and/or URL is included for the original metadata page; and
•
The content is not changed in any way.
For more information, including our policy and submission procedure, please
contact the Repository Team at: [email protected].
S T U D E N T S W IT H D IS A B IL IT IE S , L E A R N IN G D IF F IC U LT IE S A N D D IS A D V A N T A G E S S ta tis tic s a n d In d ic a to rs
The full text of this book is available on line via this link:
http://www.sourceoecd.org/education/9264009809
Those with access to all OECD books on line should use this link:
http://www.sourceoecd.org/9264009809
SourceOECD is the OECD’s online library of books, periodicals and statistical databases. For more information about this award-winning service and free trials ask your librarian, or write to us at [email protected].
This book provides an internationally comparable set of indicators on educational provision for students with disabilities, learning difficulties and disadvantages. It looks in detail at the students concerned, where they are educated (special schools, special classes or regular classes) and what their level of education is (pre-primary, primary, lower secondary and upper secondary education). It also includes information on the physical provision and on student/teacher ratios and discusses policy implications concerning special education.
This volume is an updated edition of the statistics and indicators issued in 2004 under the title Equity
in Education: Students with Disabilities, Learning Difficulties and Disadvantages. It presents quantitative and qualitative data for the school year 2000-01 in 21 OECD countries: Belgium (Flemish and French Communities), Canada (New Brunswick), the Czech Republic, Finland, France, Germany, Greece, Hungary, Italy, Japan, Korea, Mexico, the Netherlands, Poland, the Slovak Republic, Spain, Sweden, Switzerland, Turkey, the United Kingdom (England) and the United States.
In almost all OECD countries, a strong and consistent finding is that for these students boys outnumber girls by three to two. The same ratio can be found throughout the study, regardless of whether the analysis was carried out by location, cross-national or national category, age of student, or by phase of education.
Students with Disabilities, Learning Difficulties and Disadvantages: Statistics and Indicators will be of particular interest to policy makers and education experts looking for an internationally comparative framework on education for these students.
Difficulties and Disadvantages
STATISTICS AND INDICATORS
CENTRE FOR EDUCATIONAL RESEARCH AND INNOVATION
Students with
Disabilities,
Learning Difficulties
and Disadvantages
ORGANISATION FOR ECONOMIC CO-OPERATION
AND DEVELOPMENT
The OECD is a unique forum where the governments of 30 democracies work together to address the economic, social and environmental challenges of globalisation. The OECD is also at the forefront of efforts to understand and to help governments respond to new developments and concerns, such as corporate governance, the information economy and the challenges of an ageing population. The Organisation provides a setting where governments can compare policy experiences, seek answers to common problems, identify good practice and work to co-ordinate domestic and international policies.
The OECD member countries are: Australia, Austria, Belgium, Canada, the Czech Republic, Denmark, Finland, France, Germany, Greece, Hungary, Iceland, Ireland, Italy, Japan, Korea, Luxembourg, Mexico, the Netherlands, New Zealand, Norway, Poland, Portugal, the Slovak Republic, Spain, Sweden, Switzerland, Turkey, the United Kingdom and the United States. The Commission of the European Communities takes part in the work of the OECD.
OECD Publishing disseminates widely the results of the Organisation’s statistics gathering and research on economic, social and environmental issues, as well as the conventions, guidelines and standards agreed by its members.
Publié en français sous le titre :
Élèves présentant des déficiences, des difficultés et des désavantages sociaux
Statistiques et indicateurs
© OECD 2005
No reproduction, copy, transmission or translation of this publication may be made without written permission. Applications should be sent to This work is published on the responsibility of the Secretary-General of the OECD. The
Foreword
In the mid-nineties, the OECD’s Centre for Educational Research and Innovation
(CERI)1 published a collection of data making comparisons in the field of special needs
education in a number of OECD countries. This work strengthened the view that a different comparative framework would need to be developed if reliable and valid comparisons were to be made. Subsequent discussions with participating member countries identified a resource-based definition as the best means of facilitating international comparison. This helps to overcome currently different national interpretations of concepts such as special educational needs which cover very different populations of students who are experiencing difficulties in accessing the curriculum. It is not unproblematic, however, so in the longer run further work will be needed to try to develop and use common definitions of concepts, as has been done to advance the development and use of statistics and indicators in other areas of work on education.
Concurrent work at UNESCO and OECD in revising standards for classifying education systems (ISCED) updated the definition of special needs education and reformulated it to reflect policy developments. In doing so, a much wider range of students, in all types of schools were brought into the frame. In addition, the idea that extra resources may be needed to assist schools to help students access the curriculum more effectively was included in the new description.
In order for policy relevant comparisons to emerge, a resource-based approach would require that the students included under this definition would need to be sub-divided into some form of straightforward classification scheme. Participating countries agreed on a tri-partite system in which students are divided into three cross-national categories, A, B and C. Broadly, they cover:
• Students with disabilities or impairments viewed in medical terms as organic
disorders attributable to organic pathologies (e.g. in relation to sensory, motor or
neurological defects). The educational need is considered to arise primarily from problems attributable to these disabilities (cross-national category “A/Disabilities”).
• Students with behavioural or emotional disorders, or specific difficulties in
learning. The educational need is considered to arise primarily from problems in the interaction between the student and the educational context (cross-national category “B/Difficulties”).
• Students with disadvantages arising primarily from socio-economic, cultural, and/or
linguistic factors. The educational need is to compensate for the disadvantages attributable to these factors (cross-national category “C/Disadvantages”).
It is in Category C that the resource-based definition is most problematic because the numbers of students in this category reflect both demand, based on student need, and supply, based on national capacity as well as willingness to provide support. The extent of supply can, therefore, depend on national wealth as well as national policy. It can also be influenced by the adequacy of the base-level resources in schools to deal with student disadvantage. The extent of demand can also vary between countries because of differences in the nature and levels of immigration and the impact of policies to overcome poverty.
Work to refine the concepts and definitions continues. Meanwhile, the data provided in this book are based on the application of the three categories as outlined above. This edition presents an updated (2000-2001) account of the development of the work, and provides qualitative data to contextualise the quantitative information. It provides breakdowns by national category systems as well as comparisons using the cross-national framework described.
The work was supported by contributions from the US Department of Education, Office of Special Education and Rehabilitative Services (OSERS) as well as by additional funds from the following participating countries: Belgium (Flemish Community), Canada (British Columbia and Saskatchewan), Finland, France, Germany, Greece (Hellenic American Union), Hungary, Ireland, Japan, Korea, Mexico, the Netherlands, Norway, the Slovak Republic, Spain, Sweden, Switzerland and Turkey.
The book was prepared by the chief consultant to the project, Colin Robson, Emeritus Professor, University of Huddersfield, and by Peter Evans and Marcella Deluca of the OECD/CERI secretariat, with the assistance of Philippe Hervé and James Bouch. The countries involved collaborated closely. This book is published under the responsibility of the Secretary-General of the OECD.
Table of Contents
Chapter 1. Introduction... 11
Background... 11
From special educational needs to disabilities, difficulties, disadvantages ... 12
The resource-based definition... 13
Operational definitions of cross-national categories... 14
The electronic questionnaire... 15
The nature and sources of the database for this report... 16
Data limitations... 16
Symbols for missing data... 16
OECD member country codes ... 17
Chapter 2. Analysis of the qualitative data... 19
Background... 19
Laws... 19
How are planning decisions made to ensure that students with special educational needs receive appropriate additional resources? ... 21
Facilitators and barriers of equity and inclusive education... 22
Definition of special education for gathering statistics... 24
Use of categories... 24
Cross-national classification ... 25
Concluding comments ... 26
Chapter 3. Analysis of the quantitative data based on categories used nationally... 55
Background... 55
Methodology... 55
Data on individual categories ... 56
Description by category ... 59
Conclusions... 87
General notes ... 87
Chapter 4. Analysis of the quantitative data for cross-national categories A, B and C... 89
Background... 89
Availability of data ... 89
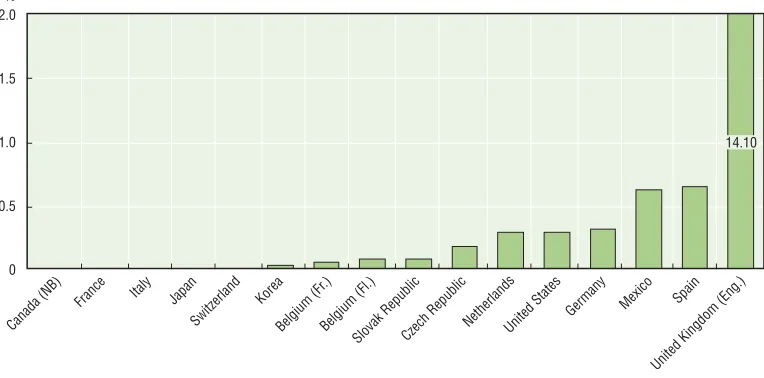
Quantitative data on cross-national category A (students receiving additional resources for disabilities).... 90
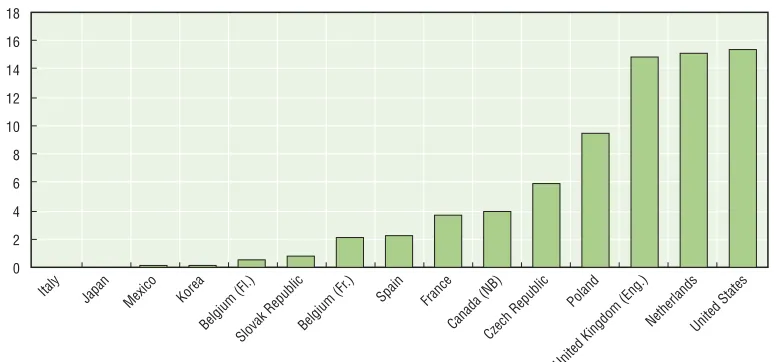
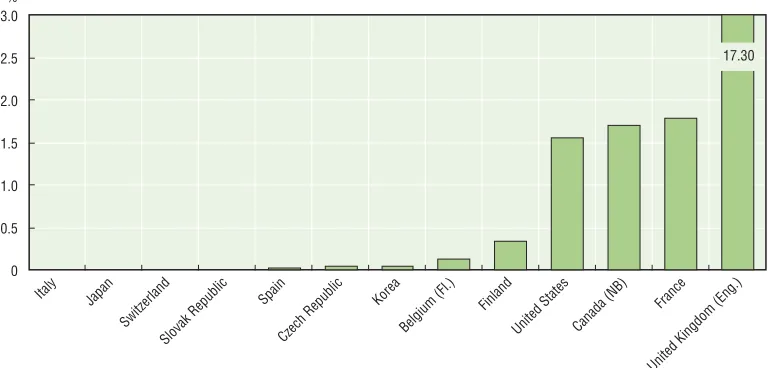
Quantitative data on cross-national category B (students receiving additional resources for difficulties).... 99
Quantitative data on cross-national category C (students receiving additional resources for disadvantages)... 107
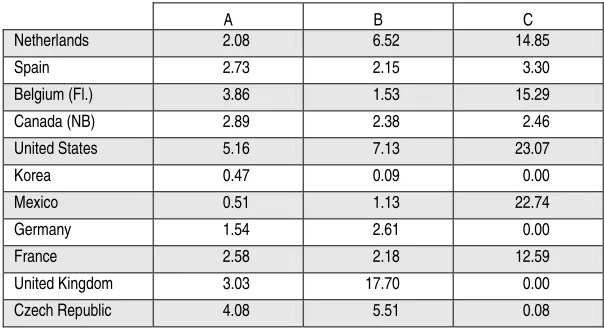
Overall comparisons across the phases of education for the three cross-national categories... 115
Chapter 5. Additional analyses of the quantitative data: gender and age... 117
Introduction... 117
Special classes ... 119
Regular classes... 120
Student/staff ratios ... 121
Relative numbers of male and female students receiving additional resources for disabilities, difficulties or disadvantages ... 122
Age distribution of students receiving additional resources for disabilities, difficulties or disadvantages ... 127
Students not registered within the education system ... 131
Overall discussion... 131
Chapter 6. Further discussion of significant issues... 133
Issues arising from the analyses of the cross-national category A, B and C data... 134
Cross-national category A – students receiving additional resources for disabilities... 134
Cross-national category B – students receiving additional resources for difficulties... 135
Cross-national category C – students receiving additional resources for disadvantages... 138
Gender... 140
Implications of the results of the third data collection exercise for future developments ... 141
Final comments... 143
References... 145
Annex 1. Distribution of individual national categories into 22 general categories used to describe students with disabilities, difficulties and disadvantages... 147
Annex 2. Data availability tables... 148
Annex 3. Compulsory school education... 150
List of charts Chart 3.1. Numbers of students receiving additional resources by nationally classified categories of disability, difficulty and disadvantage and by country, as a percentage of all students in primary and lower secondary education, 2001 ... 57
Chart 3.2. Numbers of blind and partially sighted students by location and by country, as a percentage of all students in primary and lower secondary education... 60
Chart 3.3. Numbers of blind and partially sighted students by location and by country, as a percentage of all blind and partially sighted students in primary and lower secondary education... 60
Chart 3.4. Numbers of blind and partially sighted students by phases of education and by country, as a percentage of all students in that phase of education... 61
Chart 3.5. Numbers of deaf and partially hearing students by location and by country, as a percentage of all students in primary and lower secondary education ... 62
Chart 3.6. Numbers of deaf and partially hearing students by location and by country, as a percentage of all deaf and partially hearing students in primary and lower secondary education... 62
Chart 3.7. Numbers of deaf and partially hearing students by phases of education and by country, as a percentage of all students in that phase of education... 63
Chart 3.8. Numbers of students with emotional and/or behavioural difficulties by location and by country, as a percentage of all students in primary and lower secondary education ... 64
Chart 3.9. Numbers of students with emotional and/or behavioural difficulties by location and by country, as a percentage of students with emotional and/or behavioural difficulties in primary and lower secondary education ... 64
Chart 3.11. Numbers of students with physical disabilities by location and by country,
as a percentage of all students in primary and lower secondary education ... 66 Chart 3.12. Numbers of students with physical disabilities by location and by country,
as a percentage of all students with physical disabilities in primary and lower
secondary education... 66 Chart 3.13. Numbers of students with physical disabilities by phases of education and by country,
as a percentage of all students in that phase of education... 67 Chart 3.14. Numbers of students with speech and language problems by location and by country,
as a percentage of all students in primary and lower secondary education ... 68 Chart 3.15. Numbers of students with speech and language problems by location and by country,
as a percentage of all students with speech and language problems in primary and
lower secondary education... 68 Chart 3.16. Numbers of students with speech and language problems by phases of education and
by country, as a percentage of all students in that phase of education... 69 Chart 3.17. Numbers of students in hospitals by location, as a percentage of all students in primary
and lower secondary education... 70 Chart 3.18. Numbers of students in hospitals by location and by country, as a percentage of all
students in hospitals in primary and lower secondary education... 70 Chart 3.19. Numbers of students in hospitals by phases of education and by country,
as a percentage of all students in that phase of education... 71 Chart 3.20. Numbers of students with combinatorial disabilities in primary and lower secondary by
location and by country, as a percentage of all students in primary and lower secondary... 72 Chart 3.21. Numbers of students with combinatorial disabilities by location and by country, as a
percentage of all students with combinatorial disabilities in primary and lower
secondary education... 72 Chart 3.22. Numbers of students with combinatorial disabilities by phases of education and by
country, as a percentage of all students in that phase of education... 73 Chart 3.23. Numbers of students with autism in primary and lower secondary by location and by
country, as a percentage of all students in primary and lower secondary education ... 73 Chart 3.24. Numbers of students with autism by location and by country, as a percentage of all
students with autism in primary and lower secondary education ... 74 Chart 3.25. Numbers of students with autism by phases of education and by country,
as a percentage of all students in that phase of education... 74 Chart 3.26. Numbers of students with severe learning problems by location and by country, as a
percentage of all students in primary and lower secondary education... 75 Chart 3.27. Numbers of students with severe learning problems by location and by country, as a
percentage of all students with severe learning problems in primary and lower
secondary education... 76 Chart 3.28. Numbers of students with severe learning problems by phases of education and by
country, as a percentage of all students in that phase of education... 76 Chart 3.29. Numbers of students with moderate learning problems by location and by country,
as a percentage of all students in primary and lower secondary education ... 77 Chart 3.30. Numbers of students with moderate learning problems by location and by country,
as a percentage of all students with moderate learning problems in primary and lower secondary education... 77 Chart 3.31. Numbers of students with moderate learning problems by phases of education and by
country, as a percentage of all students in that phase of education... 78 Chart 3.32. Numbers of students with severe and/or moderate learning problems by location and
Chart 3.33. Numbers of students with severe and/or moderate learning problems by location and by country, as a percentage of all students with severe and/or moderate learning
problems in primary and lower secondary education ... 79 Chart 3.34. Numbers of students with severe and/or moderate learning problems by phases of
education and by country, as a percentage of all students in that phase of education ... 80 Chart 3.35. Numbers of students with light learning problems by location and by country, as a
percentage of all students in primary and lower secondary education... 80 Chart 3.36. Numbers of students with light learning problems by location and by country, as a
percentage of all students with light learning problems in primary and lower
secondary education... 81 Chart 3.37. Numbers of students with specific learning difficulties by location and by country,
as a percentage of all students in primary and lower secondary education ... 81 Chart 3.38. Numbers of students with specific learning difficulties by location and by country,
as a percentage of all students with specific learning difficulties in primary and lower secondary education... 82 Chart 3.39. Numbers of students with specific learning difficulties by phases of education and by
country, as a percentage of all students in that phase of education... 82 Chart 3.40. Numbers of second language and mother tongue teaching students by location and by
country, as a percentage of all students in primary and lower secondary education ... 83 Chart 3.41. Numbers of travelling students by location and by country, as a percentage of all
students in primary and lower secondary education ... 84 Chart 3.42. Numbers of travelling students by phases of education and by country,
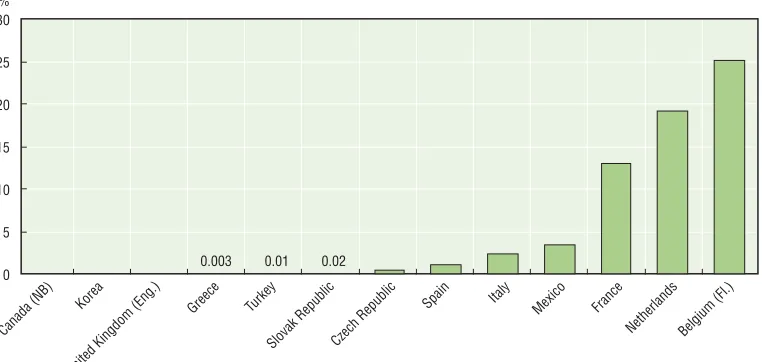
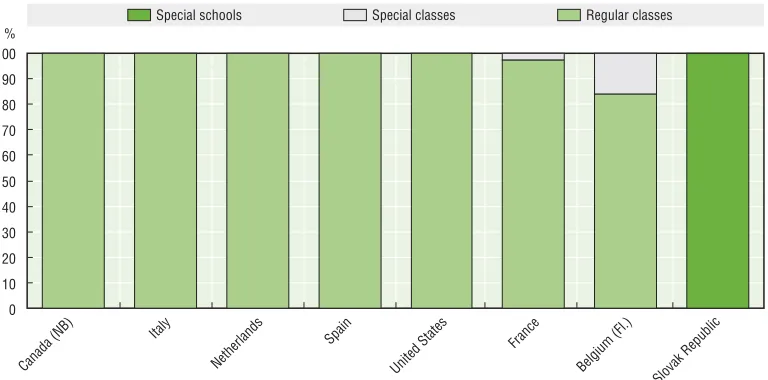
as a percentage of all students in that phase of education... 85 Chart 3.43. Numbers of disadvantaged students by location and by country, as a percentage of all
students in primary and lower secondary education ... 85 Chart 3.44. Numbers of disadvantaged students by location and by country, as a percentage of all
disadvantaged students in primary and lower secondary education ... 86 Chart 3.45. Numbers of disadvantaged students by phases of education and by country, as a
percentage of all students in that phase of education... 86 Chart 4.1. Numbers of students receiving additional resources over the period of compulsory
education in cross-national category A, as a percentage of all students in compulsory education, 2001... 91 Chart 4.2. Percentage of students receiving additional resources over the period of compulsory
education in cross-national category A by location ... 91 Chart 4.3. Numbers of children receiving additional resources in pre-primary education in
cross-national category A, as a percentage of all children in pre-primary education, 2001... 92 Chart 4.4. Percentages of children receiving additional resources in pre-primary education in
cross-national category A by location... 93 Chart 4.5. Numbers of students receiving additional resources in primary education in
cross-national category A, as a percentage of all children in primary education, 2001... 94 Chart 4.6. Percentages of students receiving additional resources in primary education in
cross-national category A by location ... 94 Chart 4.7. Numbers of students receiving additional resources in lower secondary education in
cross-national category A, as a percentage of all students in lower secondary education, 2001... 95 Chart 4.8. Percentages of students receiving additional resources in lower secondary education
in cross-national category A by location ... 96 Chart 4.9. Numbers of students receiving additional resources in upper secondary education in
cross-national category A, as a percentage of all students in upper secondary education, 2001... 97 Chart 4.10. Percentages of students receiving additional resources in upper secondary education
Chart 4.11. Numbers of students receiving additional resources over the period of compulsory education in cross-national category B, as a percentage of all students in compulsory education, 2001... 100 Chart 4.12. Percentages of students receiving additional resources over the period of compulsory
education in cross-national category B by location ... 100 Chart 4.13. Numbers of children receiving resources in pre-primary education in cross-national
category B, as a percentage of all children in pre-primary education, 2001... 101 Chart 4.14. Percentages of children receiving additional resources in pre-primary education in
cross-national category B by location... 102 Chart 4.15. Numbers of students receiving additional resources in primary education in
cross-national category B, as a percentage of all students in primary education, 2001... 103 Chart 4.16. Percentages of students receiving additional resources in primary education in
cross-national category B by location ... 103 Chart 4.17. Numbers of students receiving additional resources in lower secondary education in
cross-national category B, as a percentage of all students in lower secondary education, 2001 ... 104 Chart 4.18. Percentage of students receiving additional resources in lower secondary education in
cross-national category B by location... 105 Chart 4.19. Numbers of students receiving additional resources in upper secondary education in
cross-national category B, as a percentage of all students in upper secondary education, 2001 ... 106 Chart 4.20. Percentages of students receiving additional resources in upper secondary education
in cross-national category B by location... 107 Chart 4.21. Numbers of students receiving additional resources over the period of compulsory
education in cross-national category C, as a percentage of all students in compulsory education... 108 Chart 4.22. Percentages of students receiving additional resources in compulsory education in
cross-national category C by location... 109 Chart 4.23. Numbers of children receiving additional resources in pre-primary education in
cross-national category C, as a percentage of all children in pre-primary education, 2001... 110 Chart 4.24. Percentages of students receiving additional resources in pre-primary education in
cross-national category C by location... 111 Chart 4.25. Numbers of students receiving additional resources in primary education in
cross-national category C, as a percentage of all students in primary education... 111 Chart 4.26. Percentages of students receiving additional resources in primary education in
cross-national category C by location ... 112 Chart 4.27. Numbers of students receiving additional resources in lower secondary education in
cross-national category C, as a percentage of all students in lower secondary education, 2001 ... 112 Chart 4.28. Percentages of students receiving additional resources in lower secondary education
in cross-national category C by location... 113 Chart 4.29. Numbers of students receiving additional resources in upper secondary in cross-national
category C, as a percentage of all students in upper secondary education, 2001... 114 Chart 4.30. Percentages of students receiving additional resources in upper secondary education
in cross-national category C by location... 115 Chart 4.31. Mean number of students receiving additional resources at different levels of education
by cross-national category, as a percentage of all students in that level of education ... 116 Chart 4.32. Mean number of students receiving additional resources at different levels of education
Chart 5.3. Numbers of students receiving additional resources in special schools as a proportion
of all students by age, 2001... 128
Chart 5.4. Numbers of students receiving additional resources in special classes as a proportion of all students by age, 2001... 129
Chart 5.5. Age distribution of students not registered within the education system... 131
List of tables Table 2.1. Classification of nationally gathered categories used in collecting data within the national definition of special educational needs ... 27
Table 2.2. Allocation of categories of students with disabilities, difficulties and disadvantages included in the resources definition to cross-national categories A, B and C... 28
Table 4.1. Comparison of numbers of children with disabilities receiving additional resources in pre-primary and primary education, as a percentage of all children in that phase of education... 93
Table 4.2. Comparison of numbers of children with disabilities receiving additional resources in primary and lower secondary education, as a percentage of all children in that phase of education... 96
Table 4.3. Comparison of numbers of children with disabilities receiving additional resources in lower and upper secondary education, as a percentage of all children in that phase of education... 98
Table 4.4. Comparison of numbers of children with difficulties receiving additional resources in pre-primary and pre-primary education, as a percentage of all children in that phase of education... 101
Table 4.5. Comparison of numbers of students with difficulties receiving additional resources in primary and lower secondary education, as a percentage of all students in that phase of education... 104
Table 4.6. Comparison of numbers of children with difficulties receiving additional resources in lower and upper secondary education, as a percentage of all children in that phase of education... 106
Table 4.7. Comparison of percentages of children in cross-national categories A, B and C over the period of compulsory education... 108
Table 4.8. Comparison of numbers of children with disadvantages receiving additional resources in pre-primary and primary education, as a percentage of all children in that phase of education... 110
Table 4.9. Comparison of numbers of children with disadvantages receiving additional resources in primary and lower secondary education, as a percentage of all children in that phase of education... 113
Table 4.10. Comparison of numbers of children with disadvantages receiving additional resources in lower and upper secondary education, as a percentage of all children in that phase of education... 114
Table 5.1. Number of special schools by level of education relative to total school population... 118
Table 5.2. Size of special schools by level of education... 118
Table 5.3. Percentage of public special schools... 119
Table 5.4. Number and size of special classes... 119
Table 5.5. Number of regular classes with students receiving additional resources... 120
Table 5.6. Student/teacher ratios... 121
Table 5.7. Gender ratios of students receiving additional resources for disabilities... 123
Table 5.8. Gender ratios of students receiving additional resources for difficulties... 124
Table 5.9. Gender ratios of students receiving additional resources for disadvantages... 125
Chapter 1
Introduction
Background
The performance of national education systems is a topic which continues to receive a large amount of interest. All OECD member countries are concerned with the standards attained by students and the type of learning that all children and young people are engaged in, as educational reforms are planned and put in place as part of a strategy for moving countries into the knowledge economy.
Students with disabilities, learning difficulties and disadvantages are no exception, and programmes are being developed to assist these students to improve their skills and to be included more fully into society and work. The demographic trends are such that in the coming years, as a result of the increasing numbers of retired citizens and the decreasing birth rate, all available skills will be needed to maintain our economies.
The gathering of statistics and the development of indicators of education systems are viewed as indispensable to this endeavour, and the effort has been spearheaded by OECD in collaboration with UNESCO and the European Union. However, it has been noticeable that data on students who have difficulties in accessing the curriculum are more difficult to come by than for the rest of the student population.
In 1995, OECD published a first set of data intended to provide a comparative review of provision for students with disabilities and disadvantages in OECD countries. Although the work showed that the definitions used were so different among countries that comparisons were almost impossible to make, sufficiently large differences existed between countries to indicate the occurrence of substantial variations in provision.
This monograph follows on from this work and describes the continuation of a
process which is intended to improve the quality of the database and international comparability. In this way policy making in the field of education for disabled and disadvantaged students will be better informed.
More recently, and providing additional motivation for a new initiative in this area, the instrument used for defining the nature of education statistics to be gathered internationally, the International Standard Classification of Education (ISCED), has been revised. In the original version of the classification, special education was defined as the education provided in special schools; a definition wholly out of keeping with both theory and practice in many countries, and which in itself limits interest in obtaining data in this area.
The most recent version of ISCED (ISCED 97) has attempted to put this right and provides the following definition of special education:
Special needs education – Educational intervention and support designed to
into use as a replacement for the term “special education”. The older term was mainly understood to refer to the education of children with disabilities that takes place in special schools or institutions distinct from, and outside of, the
institutions of the regular school and university system. In many countries today a large proportion of disabled children are in fact educated in institutions of the regular system. Moreover, the concept of “children with special educational needs” extends beyond those who may be included in handicapped categories to cover those who are failing in school for a wide variety of other reasons that are known to be likely to impede a child’s optimal progress. Whether or not this more broadly defined group of children are in need of additional support depends on the extent to which schools are able to adapt their curriculum, teaching and organisation and/or to provide additional human or material resources so as to
stimulate efficient and effective learning for these pupils. (UNESCO, 1997)
It is clear that this definition substantially changes and updates the definition of special education – particularly in terms of resources made available, and it carries with it a requirement for a rather different operationalisation for the purposes of gathering statistics.
As noted above, earlier work had identified the difficulty in comparing data in special needs education among countries. Two outstanding problems were identified. First, the term “special needs education” means different things in different countries. In some it covers only children with traditional disabilities, while in others it includes a broader range of students covering, for instance, disability, learning difficulty and disadvantage. Second, because of the wide variations in the definitions of disability and learning difficulty which are in use, the extent to which quantitative estimates for any particular category from different countries are comparable remains unclear. Furthermore, there has been in special educational circles particular concern about the lack of educational utility of descriptive categories which are derived from medical classifications. Disability categories are viewed as having only partial implications for educational provision or for the development of teaching programmes, which inevitably have to take the whole child into account. In this way, therefore, categories based on medical descriptions are at best of only limited value to education policy makers, who are the main audience for data gathered within the ISCED framework at OECD.
From special educational needs to disabilities, difficulties, disadvantages
It is clear that in an international setting the use of the term “special educational needs” leads to confusion because it means different things for different countries. As a result, except where necessary for historical reasons, the term is not used in this monograph. Instead the words disabilities, difficulties and disadvantages are used. These terms broadly describe the students for whom countries make additional resources available so that they can access the curriculum more effectively.
OECD countries provide additional resources to help students with disabilities, difficulties and disadvantages access the curriculum and benefit as fully as possible from education. Further analysis of how these resources are used and for whom and to what ends becomes key to understand whether education systems are as equitable as they should be. It is towards illuminating this goal that the data collection on these students is directed. Given the very different approaches taken by member countries of the OECD it is an area which should benefit from international comparisons.
The resource-based definition
The points raised above argue, then, for a new approach and following proposals from the Secretariat at OECD and in discussion with member countries it was decided to tackle the problem in the following way. In order to overcome the different definitions of special needs education that operate among countries, it was necessary to provide a means to identify and include all students for whom extra provision is made in order to help them make progress through the school curriculum.
It was decided to identify this envelope of students through a supply side approach based on resources made available. This has the advantage of being educationally based and at the same time fits with the intent of the ISCED 97 definition.
Thus, the definition of special needs education agreed is that “those with special educational needs are defined by the additional public and/or private resources provided to support their education”. The use of this definition in a consistent manner calls for agreement about the term ADDITIONAL and an appreciation of the various kinds of possible RESOURCES PROVIDED which should be considered.
Thus “additional resources” are those made available over and above the resources
generally available to students1 where no consideration is given to needs of students
likely to have particular difficulties in accessing the regular curriculum.
Resources can be of many different kinds. Examples are:
• PERSONNEL RESOURCES. These include a more favourable teacher/student
ratio than in a regular classroom where no allowance is being made for students with special needs; additional teachers, assistants or any other personnel (for some or all of the time); training programmes for teachers and others which equip them for work in special needs education.
• MATERIAL RESOURCES. These include aids or supports of various types (e.g.
hearing aid); modifications or adaptations to classroom; specialised teaching materials.
• FINANCIAL RESOURCES. These include funding formulae which are more
favourable to those with special needs (including classes where it is known or assumed that there are students with special needs); systems where money is set aside for special educational needs within the regular budget allocation; payments made in support of special needs education; and the costs of personnel and material resources.
The key question is whether these resources are made available to support their education and are provided when students have particular difficulties in accessing the
regular curriculum.
One result of the resources approach is that it brings together students with learning difficulties with very different causes, and it was recognised that a group formed in this way would itself need to be further sub-divided. To achieve this, a tri-partite categorisation system was devised based on perceived causes of difficulty in accessing the regular curriculum. Countries are asked to re-classify the data into this framework based on the classification and data collection arrangements used in their own national system following the operational definitions provided.
Operational definitions of cross-national categories
2The three agreed cross-national categories are referred to as “A/Disabilities”, “B/Difficulties” and “C/Disadvantages” respectively.
Cross-national category “A/Disabilities”: students with disabilities or impairments
viewed in medical terms as organic disorders attributable to organic pathologies (e.g. in
relation to sensory, motor or neurological defects). The educational need is considered to arise primarily from problems attributable to these disabilities.
Cross-national category “B/Difficulties”: students with behavioural or emotional
disorders, or specific difficulties in learning. The educational need is considered to arise primarily from problems in the interaction between the student and the educational context.
Cross-national category “C/Disadvantages”: students with disadvantages arising
primarily from socio-economic, cultural, and/or linguistic factors. The educational need is to compensate for the disadvantages attributable to these factors.
The definition of special educational needs (SEN) given in the ISCED 97 manual and the derived resources definition have in practice presented problems for some countries. Specifically for example the association of students from ethnic minorities with those with special education needs clashes with some national policy frameworks and national understanding of the concept of SEN.
Given the roots of this work it is not straightforward to easily deal with this issue. Nevertheless the statistical analysis recognises the problem and in general analyses data for A, B and C separately unless it is clear that combining the data is useful, and the issue is taken up more fully in the final chapter where policy implications are drawn out.
In the following chapters, these ideas and descriptions are elaborated upon and data gathered within this new framework are presented.
• Chapter 2 provides an analysis of the qualitative data.
• Chapter 3 provides a comparative analysis of quantitative data based on
categories used nationally to identify students who are in need of additional resources to help them access the curriculum.
• Chapter 4 provides an analysis of quantitative data for cross-national categories A, B, C.
• Chapter 5 provides an additional analysis of the quantitative data, including
gender and age distributions.
• Chapter 6 provides discussion and conclusions.
The electronic questionnaire
An electronic questionnaire is used to gather data on students with disabilities, learning difficulties and disadvantages thus allowing the development of a database, and of a methodology and technology compatible with the general education statistics work undertaken by OECD. It was put together to take account of the wide variety of national systems in use which was highlighted in the initial phase and comprises:
• Table 0 which requests information on any categories of students which are
considered to fall within the resources definition and their classification into cross-national categories A, B or C.
• Table 1 which asks for information on the starting and ending ages of various
stages of education.
• Table 2 which asks for information on number of students with special
educational needs in special schools, on the institutions (public and private), numbers of classes and on the teaching staff.
• Table 3 which asks for information on number of students with special needs in
special classes, on the institutions (public and private), numbers of classes and on the teaching staff.
• Table 4 which asks for information on number of students with special needs in
regular classes, on the institutions (public and private), and numbers of classes.
• Table 63 which asks for information on all students enrolled in special
educational programmes classified by age as well as on those not registered in the education system.
In addition, information on total numbers of students in each level of education including compulsory is requested as well as gender and age breakdowns.
The electronic questionnaire aims to simplify data collection and already available information is pre-entered individually for each country and thereby only needs checking during completion. Also, the requested coverage includes both pre-school and upper secondary education, since both of these phases of education are of considerable interest in relation to special educational needs provision and are necessary for providing a full picture of the education of these students. Other technical changes have been made to allow ultimately for data sets fully compatible with the new ISCED requirements. In particular, consideration for classification by programme content is allowed for.
The electronic questionnaire is designed so that the data requested are almost exclusively based on those already collected for other purposes, although not necessarily
currently collated nationally. However, it may be feasible for central agencies in countries to provide different or additional breakdowns of statistics to those they currently produce; or to augment these data with statistics normally held only at regional or even local level.
The nature and sources of the database for this report
Twenty-two returns of the electronic questionnaire for school year 2000/2001 (but see following paragraphs for exceptions) were received from the following 21 countries and
provinces: Belgium (Flemish Community and French Community), Canada (New
Brunswick, district 18), the Czech Republic, Finland, France, Germany, Greece, Hungary, Italy, Japan, Korea, Mexico, the Netherlands, Poland, the Slovak Republic, Spain, Sweden, Switzerland, Turkey, the United Kingdom (England) and the United States.
Exceptions are Hungary and Mexico, for which data refer to the school year 1999/2000; and Canada (NB) and Greece, for which data refer to the school year 2001/2002. Sweden provided only qualitative data.
The data are provided by national authorities from databases already gathered in countries for administrative purposes. The work reported has benefited from close collaboration between the OECD/CERI Secretariat and country representatives and the data presented are therefore as accurate as possible.
Because it has not yet proved possible to use the programmatic definitions of the ISCED levels the terms pre-primary, primary, lower secondary and upper secondary are used as proxies for ISCED levels 0 to 3.
Data limitations
Despite increasing agreement about the cross-national definitions and growing adherence to these definitions among countries when allocating their individual country categories, there remain some divergences. Work is continuing on harmonising international reporting of these data. For example, the allocation of national categories to cross-national categories A, B and C is permanently under review. Work is also continuing to provide full data sets on all national and cross-national categories. New work based on local data gathering has been initiated for this purpose.
Symbols for missing data
Five symbols are employed in the tables and graphs to denote missing data:
a Data not applicable because the category does not apply.
m Data not available.
m: Data partially missing.
n Magnitude is either negligible or zero.
OECD member country codes
Australia AUS Italy ITA
Austria AUT Japan JPN
Belgium (Flemish Community) BEL (Fl.) Korea KOR
Belgium (French Community) BEL (Fr.) Luxembourg LUX
Canada Alberta CAN (Alb.) Mexico MEX
Canada British Columbia CAN (BC) Netherlands NLD
Canada New Brunswick CAN (NB) New Zealand NZL
Canada Saskatchewan CAN (SK) Norway NOR
Czech Republic CZE Poland POL
Denmark DNK Portugal PRT
Finland FIN Slovak Republic SVK
France FRA Spain ESP
Germany DEU Sweden SWE
Greece GRC Switzerland CHE
Hungary HUN Turkey TUR
Iceland ISL United Kingdom (Eng.) GBR
Chapter 2
Analysis of the qualitative data
Background
This chapter analyses some qualitative descriptions provided by countries in addition to gathering quantitative data. These comprised:
• Information on the country’s definition of special education used for gathering
educational statistics.
• The use of categories in gathering data in this field along with the names and
definitions of the categories and whether or not they fall within the resources definition.
• Whether there were categories of students currently used for data collection which fall
within the resources definition but not within the national definition of special needs.
• How the categories fit into the cross-national categorisation A, B and C.
• How planning decisions are made to ensure that students with special educational
needs receive appropriate additional resources.
• Whether there is specific coverage of special educational needs in the current
legislative framework and if so what it is.
• Factors considered to be facilitators of inclusion and equity; and factors acting as
barriers to inclusion and equity.
The following paragraphs synthesise the information that was provided in 1996, 1999 and 2001. Returns for the three years are collated from 28 OECD member countries: Austria, Belgium (Fl.), Canada (Alb., BC, NB, SK), the Czech Republic, Denmark, Finland, France, Germany, Greece, Hungary, Iceland, Ireland, Italy, Japan, Korea, Luxembourg, Mexico, the Netherlands, Norway, New Zealand, Poland, Portugal, Spain, Sweden, Switzerland, Turkey, the United Kingdom and the United States.
Laws
of the general laws on education. Thus it is clear that this remains an area where there has been substantial development.
The most significant change in these legal frameworks is a move towards inclusion. This is being driven by an agenda comprising human rights issues, equity, parental involvement and social cohesion with the growing understanding that the concept of special educational needs implies that students’ failures to make adequate progress in their learning are in large part the responsibility of the school and cannot be viewed as being caused wholly by the “disability” diagnosis.
The changes in thinking are reflected, for instance, in the Netherlands where new laws on Primary Education (WPO) and on special education (WEC) came into force in 1998. The WPO regulates primary education including the education of children attending special primary schools. According to the WPO, primary schools (including special primary schools) should offer all children appropriate instruction and an uninterrupted school career. All children should receive instruction geared to their educational needs, promoting intellectual, emotional growth and creativity and oriented to inclusion. Directly linked to this new funding system is a re-organisation of special education. The number of different special schools (now ten) will be reduced to four types of expertise centres for students with visual, communication, physical and mental disabilities and severe behaviour problems. Parallel arrangements for older students will come into force with a Secondary Education Act.
The interactive compensatory view of special educational needs has in some countries led to an expansion of the numbers of students under consideration to include those with disadvantages. In Denmark and Spain the term “special education requirements” is used and reflects the fact that many students will need a flexible approach to engender achievement. Furthermore, for instance in Mexico, it is importantly recognised that some disabled students may not have special educational needs. This follows from the observation that if certain disabilities are being skilfully handled in a school as part of the regular provision, additional help to access the curriculum is not needed.
The recognition that schools must adapt themselves is being reflected in other modifications to educational delivery. Where special needs students are included class sizes are sometimes reduced. In Hungary, for example, a student with special needs counts as two or three non-special needs students. So a class of 16, comprising two partially hearing students and 14 others would be equivalent to a class of 20 all non-special needs. More recent directives describe the necessary modifications and extensions to national core curriculum. To help regular schools adapt, outreach from special schools to regular schools is encouraged as is the development of clusters of schools. The aim here is to help develop the necessary skills in the regular schools so that those with special needs can be more effectively educated there. This approach has been described
more fully elsewhere, e.g. in Canada (NB) (OECD, 1999).
Many countries also offer an extension in age of formal education for disabled students. In New Zealand this can extend from the under fives right up to the age of 21.
How are planning decisions made to ensure that students with special educational
needs receive appropriate additional resources?
Fifteen countries and four Canadian Provinces (Alb, BC, NB, and SK) responded to this question approaching the topic from many different viewpoints.
The majority of countries planned within the context of a national legal framework for identifying special needs students which included providing additional resources. This varied from the United States, whose complex federal system and federal laws require that States establish inter-agency agreements with agencies responsible for services for special education students, in contrast to Switzerland where there is no comprehensive uniform statutory approach.
Within these legal frameworks, special education students are identified and classified
to varying degrees of complexity often via a multi-disciplinary approach, e.g.
Luxembourg. These classifications form the basis for resource allocation. In Canada (Alb.) for instance, in 1999/2000, 9.88% of students were classified as having mild/moderate disabilities. To meet their special needs a particular sum is incorporated into the regular per capita student funding and school boards pool these resources to meet the needs of these students. In addition 2.58% of students are described as having severe disabilities, with each student receiving additional funding in addition to the regular per
capita allowance. Other countries (e.g. Finland, the Netherlands) seem to have more
complex arrangements but student classification remains the basis of subsequent statistical data gathering and planning. Resulting budgets could be determined for five
year periods (e.g. the Netherlands) or annually (Mexico). Other countries such as Sweden
appeared to have looser arrangements, frequently decentralised. In Germany, a qualitative and quantitative profile is demanded.
Countries varied considerably in the monitoring arrangements followed for ensuring that funds allotted for special education were used appropriately. In Canada (BC), for instance, there is a reporting and auditing process to ensure compliance. Schools themselves are also reviewed, and individual education plans for special needs students are required. This centralised process looks very different from the decentralised models that are working in countries such as Norway and Sweden. These countries appear to have less strong monitoring procedures in place and in the latter country there is a well used complaints procedure for parents who feel that their child is not receiving adequate support.
Methods were not uniformly applied across the cross-national categories A, B and C. For instance when students are in special schools (usually category A) resources are often based on actual numbers but if students are from disadvantaged backgrounds (category C) then determination of resources may be made on the basis of local indicators leading to block grants, such as in Italy and in funding education priority zones (ZEPs) in France. In the Netherlands resources needed for students from category A in regular schools are estimated from projections.
Facilitators and barriers of equity and inclusive education
Countries were asked to identify characteristics of their educational systems which they believe act as either facilitators or barriers to equity and inclusive education.
Given the diversity of systems involved it is not surprising that answers covered a wide range of topics from the legal system to the practicalities of assessment.
Legal frameworks
Many countries commented on the importance that legal and policy frameworks may play in encouraging inclusion and equity and creating respect for diversity or in creating barriers. Compulsory free education for all children and youth, and mandated integration in one country, were identified as obvious facilitators. If children are not in the system they can hardly be included! One identified the opportunities provided by the EU Helios programme on the inclusion of disabled students into mainstream schools as being especially helpful in achieving changes in attitudes and practices. In the United States (Individuals with Disabilities Education Act [IDEA] and the 1973 Rehabilitation Act) serve to guarantee education and the needed services in the least restrictive environment. In Greece, general educational reform and the development of new pedagogies and the implementation of new technologies were seen as beneficial for inclusion.
The monitoring of these laws for compliance was also given importance in some
countries (e.g. Canada [BC]). In Italy the legal change of 1977 is credited with leading to
a change in society stimulating a positive acceptance of disability where the school for instance is treated as a little community. In Switzerland, decentralisation of the educational system was also cited as a factor beneficial for inclusion. France noted that the central concept of education blocks individual treatment of students and the implementation of individual programme planning. Other countries noted that policies for inclusion were not always implemented consistently.
This relatively straightforward position may, however, be contrasted with other complex effects which appear when policies are put into practice. In Austria for instance, the abolition of statements of special needs for some students, guaranteeing certain forms of provision, were found to be a barrier to effective education of disabled students since without them they were obliged to follow the regular aims of the school. In addition, regular schools provided two years less required education than special schools. In contrast in the Flemish part of Belgium, the stigmatising effects of assessment and a heavy bureaucratic approach were identified as barriers to inclusion.
Educational structures
The historical structure of the education and special education systems were frequently cited as a severe barrier. These had led to inflexible school organisation (tracking for instance was viewed as a barrier to inclusion), over large class sizes, the lack of relevant teaching skills and of individualised teaching programmes, prejudiced attitudes on the part of teachers and parents, poor quality or limited teacher preparation, biased funding systems, unhelpful contractual agreements involving employers and trade-unions and a lack of co-operation between relevant ministries and services.
Funding
Funding of special education was also identified as a key factor. The creation of a level playing field for funding which does not bias placement decisions was seen as an important
facilitator. In some countries, e.g. Denmark, Finland, Hungary and New Zealand, funds
follow students and not schools and, at least in principle, this opens the way to inclusive practices. A paradox emerged in New Zealand with regard to the decentralisation of the special educational needs grant. While central control was viewed as a barrier to inclusion, and decentralisation seen as an important way to help local authorities implement relevant inclusionary policies, decentralisation in the form of the local management of schools in New Zealand was seen as a barrier. A general lack of funds and bias in funding formulae were both
perceived to be barriers. Other countries, e.g. Switzerland and the United States, reported
inconsistencies in the way funding formulae worked at local level while for others the lack of resources and the complexity of their delivery were viewed as barriers. Cuts in spending seemed to encourage segregated provision, partly perhaps because special schools were safeguarded but also because parents, perhaps for the same reason, thought that their children would receive higher quality provision there.
That resources are needed to develop inclusion and equity cannot be denied. Mexico for instance has modified buildings and provided free textbooks and materials aimed at DDD students. Furthermore, these have been translated for the indigenous communities and scholarships provided for students living in isolated areas. In Finland, nutrition and transport are arranged and in Canada (BC) extra funds are made available for in-service education (INSET) and a telephone help line. The government there has also made loans available for the purchase of expensive equipment.
Assessment and training
Many countries mentioned that assessment practices can both facilitate and block inclusion. In Sweden a change from a normative to a criterion-based model of pupil assessment led to more students with severe learning difficulties being identified as “failing” and this increased the likelihood of special school placement. In Canada (Alb.) annual tests with well planned accommodations were reported as facilitating inclusion while at the same time they were also seen as being a way of excluding students with difficulties from the testing arrangements. The reason given for this was fear on the part of schools that including students with special needs would lower average scores – an outcome challenged by research conducted in Alberta, which found just the opposite result.
In many countries, even for those who have been practising inclusion for many years, lack of training and skills was identified as main barrier. This appeared to hold at all levels of pre-service and in-pre-service with a weakness in university level training being identified in one country, Canada (NB). The development of individual training programmes, preventive measures and early diagnosis were particularly mentioned. In Canada (SK), the degree of self-confidence of classroom teachers and school administrators was also cited in the face of growing pupil diversity and the need for more appropriate INSET and skill development. Class sizes were seen as a barrier to inclusion as was the need for effective support services,
e.g. educational psychologists, speech/language pathologists, social workers and the use of
classroom aides.
Others
the structure of primary education itself. At the classroom level, class size and streaming or tracking were seen as barriers. The lack of specialists and the proper use of teachers’ aides were seen as obstacles to be overcome. On the positive side, the addition of extra teachers was a facilitator presumably because they bring additional skills to the classroom, allow for joint planning and lead to a reduction in pupil teacher ratio in classes where disabled students are included.
The involvement of parents as advocates facilitated inclusion but the lack of parental involvement and knowledge were viewed as barriers.
The existence of educational priority policy and non-discriminatory equal opportunities were also important in the fight for equity and deliberately balancing the numbers of ethnic minorities in schools was seen as a positive equity measure.
Definition of special education for gathering statistics
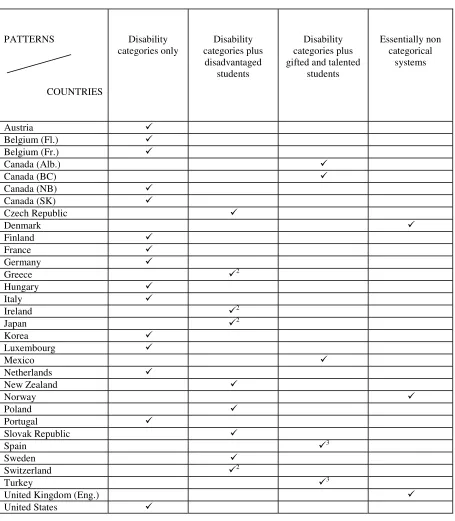
Based on the returns from the countries who responded to this question, the definition of special education for the purposes of gathering national statistics may be grouped into four basic patterns.
Almost all countries collect data via disability categories (always remembering that the term disability itself has limited common usage across countries and in France two systems, emanating from two ministries, operate in parallel); in Canada (SK), for instance, four criteria need to be met: a) the student needs to meet the classification criteria identified in the definitions; b) the student must be being provided with an appropriate programme that meets his/her needs; c) the programme must be delivered by, or the delivery must be supervised by, a teacher with special education teacher qualifications acceptable to the minister; and d) the costs of the programme are equal to or greater than the recognised costs in the grants structure.
Second, there are those countries such as Greece, Ireland and Switzerland, which also include disadvantaged students. Additionally, some countries such as Switzerland include children with a Foreign First Language within these categories whilst others do not.
Third, there are those, e.g. Canada (Alb., BC), Mexico, Spain and Turkey, which also
include gifted students.
The fourth approach used in Denmark and in the United Kingdom1 is to base
provision on the need to respond to exceptionalities leading to perceived difficulties in the
schooling process rather than defining students per se via a categorical approach.
The data are summarised in Table 2.1, which is provided at the end of this chapter.
Use of categories
The data show that most countries gather data by means of categories and this question invited them to provide the names of the categories and their definitions. Most countries were able to provide definitions and the outcomes are provided in full in Annex 1 which reveals the complexity of the different arrangements. In this annex the national categories have been placed into cross-national categories A, B and C according
to the classifications provided by the countries themselves as requested and as modified in subsequent discussions. Definitions of the categories are also provided where available. In addition, those categories which receive additional resources but which are not part of the national special needs category system are included in the table. A detailed discussion based on national categories is provided in Chapter 3.
Some countries report having categories which receive additional resources but which lie outside their national definition of special needs. These tend to cover disadvantaged students, those from ethnic minorities and those with short term learning problems and those with specific learning difficulties. However, some countries include gifted students, those with mild behaviour problems and those with speech impairments. These categories of provision exist in other countries too, but in those countries they will be included under the general rubric of special education.
A small number of countries do not fit this classification and fit into the fourth pattern noted above. This approach deserves further comment. The Canadian Province of New Brunswick does not keep categorical data but does have categories which receive resources but are not part of the special needs framework. The United Kingdom does not gather data by categories but for the current data round was able to identify students with special needs but without statements who received extra resources. These were placed in cross-national category B. Denmark also has a non-categorical system but makes a distinction between students with more extensive special needs (being about 1% who have the most severe disabilities and who need extensive support with their learning) and those with less extensive needs (being about 12% and including those with disadvantages); a framework which is conceptually similar to that in the United Kingdom where 2.74% of students with special education needs have statements of special educational need and a further 14.41% have special educational needs but do not have statements in compulsory education. Resourcing arrangements for these two groups are different. In these three countries resources are made
available for the increased costs which arise in educating students with specialeducational
needs, but they are allotted through local decision-making structures.
Cross-national classification
Countries were asked to carry out the task of re-classifying their categories both national and resource-based according to the cross-national model described in Chapter 1.
The allotment of national categories to cross-national categories was verified at the meetings of participating countries and the results are summarised in Table 2.2 which includes category definitions.
Table 2.2 reveals that the majority of countries use categories to classify their special needs population for the purposes of statistical data gathering. In terms of national categories,
i.e. excluding those that additionally fall into the resources definition, they vary between two,
e.g. the United Kingdom (Eng.), and 19 in Switzerland. Between these extremes many
Students with emotional and behavioural problems represent an interesting case. In Greece, Hungary, Italy and Turkey there is no such category.
The increased availability of detailed definitions for most national categories has increased the reliability of their allocation to cross-national categories A, B and C, since the understanding of the wide variety of national category names is facilitated. However, some anomalies remained, and this has led to the need to re-allocate some national categories.
The main proposed reallocation was of “mild mental handicap” (and equivalently named categories) from cross-national category B to A. This was mainly because, while some countries have a separate “mild mental handicap” category which was placed in B, others have wider categories including both mild and more severe mental handicap, currently allocated to A. Placing all mental handicap (and equivalently named categories) in cross-national category A removes the inconsistency.
A similar reallocation of “children suffering from protracted illnesses’, “health impaired” (and equivalently named categories) from B to A has been agreed. During earlier allocations, while B was a residual category, there was some justification for allocating these students to B (in that these categories are somewhat different from the typical categories currently in A). Their reallocation helps in framing a coherent substantive definition for B.
This discussion of the results of the findings on national categories and the way they are allotted to the cross-national categories of A, B and C strongly supports the rationale of the present study. That is, if meaningful international comparisons are to be made, a method such as the one developed here, which includes all children receiving additional resources and their allotment into straightforward and operationally defined categories, substantially simplifies the situation and improves the possibility of making policy relevant decisions based on internationally valid comparisons.
Concluding comments
In general terms the qualitative data gathered during the study reveals the great national interest in this area as laws, policies and educational provision are adjusted to meet the needs of students who are failing in the regular system. Factors thought to be facilitators for, or barriers to equity and inclusion, cover a whole range of issues which include legal frameworks, funding models, assessment arrangements, school structure, class size, individual teaching programmes, involvement of additional teachers and aides, teacher training, parental involvement and co-operation with other services. Together these make a substantial agenda for reform.
Table 2.1. Classification of nationally gathered categories used in collecting data within the
national definition of special educational needs1
PATTERNS
COUNTRIES
Disability categories only
Disability categories plus
disadvantaged students
Disability categories plus gifted and talented
students
Essentially non categorical
systems
Austria 9
Belgium (Fl.) 9
Belgium (Fr.) 9
Canada (Alb.) 9
Canada (BC) 9
Canada (NB) 9
Canada (SK) 9
Czech Republic 9
Denmark 9
Finland 9
France 9
Germany 9
Greece 92
Hungary 9
Italy 9
Ireland 92
Japan 92
Korea 9
Luxembourg 9
Mexico 9
Netherlands